Transcription
Hindawi Publishing CorporationJournal of Immunology ResearchVolume 2014, Article ID 140728, 16 pageshttp://dx.doi.org/10.1155/2014/140728Research ArticleInflammation and ER Stress Downregulate BDH2 Expressionand Dysregulate Intracellular Iron in MacrophagesSusu M. Zughaier,1 Brandon B. Stauffer,2 and Nael A. McCarty21Department of Microbiology and Immunology, Veterans Affairs Medical Center (VAMC (151-I)), Emory University School ofMedicine and Children’s Healthcare of Atlanta, 1670 Clairmont Road, Atlanta, GA 30033, USA2Emory-Children’s Center for Cystic Fibrosis and Airways Disease Research, Division of Pulmonology, Allergy/Immunology,Cystic Fibrosis and Sleep, Department of Pediatrics, Emory University School of Medicine and Children’s Healthcare of Atlanta,Atlanta, GA 30322, USACorrespondence should be addressed to Susu M. Zughaier; szughai@emory.eduReceived 2 September 2014; Revised 13 November 2014; Accepted 13 November 2014; Published 1 December 2014Academic Editor: Xiao-Feng YangCopyright 2014 Susu M. Zughaier et al. This is an open access article distributed under the Creative Commons AttributionLicense, which permits unrestricted use, distribution, and reproduction in any medium, provided the original work is properlycited.Macrophages play a very important role in host defense and in iron homeostasis by engulfing senescent red blood cells and recyclingiron. Hepcidin is the master iron regulating hormone that limits dietary iron absorption from the gut and limits iron egress frommacrophages. Upon infection macrophages retain iron to limit its bioavailability which limits bacterial growth. Recently, a shortchain butyrate dehydrogenase type 2 (BDH2) protein was reported to contain an iron responsive element and to mediate cellulariron trafficking by catalyzing the synthesis of the mammalian siderophore that binds labile iron; therefore, BDH2 plays a crucial rolein intracellular iron homeostasis. However, BDH2 expression and regulation in macrophages have not yet been described. Here weshow that LPS-induced inflammation combined with ER stress led to massive BDH2 downregulation, increased the expression ofER stress markers, upregulated hepcidin expression, downregulated ferroportin expression, caused iron retention in macrophages,and dysregulated cytokine release from macrophages. We also show that ER stress combined with inflammation synergisticallyupregulated the expression of the iron carrier protein NGAL and the stress-inducible heme degrading enzyme heme oxygenase-1(HO-1) leading to iron liberation. This is the first report to show that inflammation and ER stress downregulate the expression ofBDH2 in human THP-1 macrophages.1. IntroductionIron is an essential nutrient required for numerous cell functions and in order to avoid metal toxicity iron metabolismis tightly regulated [1]. Altered iron homeostasis and dysregulated cellular iron metabolism are associated with manychronic diseases including diabetes mellitus, cardiovasculardiseases, arthritis, and neurodegenerative diseases. Alterediron homeostasis in chronic inflammation is characterized bymisdistribution of iron that is manifested in hypoferremia,commonly called anemia of chronic inflammation, and ironretention in macrophages and the reticuloendothelial system[2, 3].Macrophages play a central role in iron homeostasis byuptake of damaged and senescent red blood cells and recyclelarge amounts of iron daily [4, 5]. Macrophages also play avery important role in host defense by detecting invadingpathogens and responding in order to clear infection. Sinceiron is essential for bacterial growth, macrophages retainiron to limit its extracellular bioavailability which therebylimits bacterial growth. This response to infection is called theiron-limiting innate immune defense mechanism. Hepcidinis the master iron regulating hormone that limits iron egressfrom macrophages [6]. Hepcidin binds to ferroportin, theonly known iron exporter, leading to its internalization anddegradation and consequent iron retention [7]. Therefore,cellular iron homeostasis and iron egress via the hepcidinferroportin axis are very tightly regulated during infectionand inflammation [8–11].
2Iron is a highly reactive metal; thus, to reduce metaltoxicity, iron is maintained bound to hemoproteins and iniron-sulfur clusters or safely stored in ferritin cages [1].Free intracellular iron or poorly liganded iron is toxicsince it catalyzes the production of reactive oxygen species(ROS). Therefore, macrophages detoxify labile iron by multiple mechanisms. Recently, the presence of a mammaliansiderophore, an iron-chelating small molecule, was reportedand the iron-binding moiety of this molecule was identifiedas 2,5-dihydroxybenzoic acid (2,5DHBA) [12]. This mammalian siderophore captures free cytosolic iron and thusprotects the cells from oxidant stress [12]. The enzyme thatcatalyzes the synthesis of 2,5DHBA is a member of the shortchain dehydrogenase/reductase family (DHRS6) [13] called3-hydroxybutyrate dehydrogenase type 2 (BDH2) [12]. Inhibition of BDH2 expression in murine pro-B lymphocytic cellsled to the depletion of the mammalian siderophore and theaccumulation of labile iron. The physiological role of BDH2 insensing cellular iron was further confirmed by the discoverythat the BDH2 enzyme contains an iron responsive elementthat interacts with iron regulatory proteins that controlposttranscriptional gene expression [14]. Recently, Zughaieret al. reported that BDH2 expression in macrophages issuppressed upon bacterial infection suggesting an importantrole for BDH2 in iron-limiting innate immunity [15]. Morerecently, the Devireddy group further confirmed the role ofBDH2 in cellular iron homeostasis and showed that depletionof the endogenous siderophore 2,5-DHBA in a mouse modelresulted in microcytic anemia and iron overload in thespleen [16, 17]. They also reported that BDH2 and ferritinH synergistically regulate intracellular iron levels in an invitro experimental cell culture model [18]. Therefore, BDH2is required for intracellular iron homeostasis [12]. However,the role of BDH2 in iron-limiting innate immune defenses inmacrophages is not known.Macrophages engulf senescent RBCs and recycle hemoglobin; thus, they express heme oxygenase-1 (HO-1), thecatalytic enzyme that degrades heme, consequently liberatingiron and producing carbon monoxide [19]. HO-1 is highlyinduced in response to inflammation, oxidative stress, andhypoxia [19, 20] due to its cytoprotective effects and antiinflammatory activity [21, 22]. Therefore, HO-1, as a stressinducible protein, is an important player in intracellulariron homeostasis. Further, neutrophil gelatinase-associatedlipocalin (NGAL) [23] functions as an iron carrier proteinthat shuttles bound iron across tissues by internalizationwith a membrane-localized receptor [24, 25] and also playsa critical physiological role in intracellular iron homeostasisby trafficking the iron-bound siderophore 2,5DHBA [12] andiron-catecholamine complexes [26]. NGAL plays a crucialrole in iron-limiting innate immune defenses since it limitsiron availability by also scavenging bacterial siderophores andthereby exerts an antibacterial function [27–29].Intracellular iron homeostasis is disrupted by endoplasmic reticulum (ER) stress [30]. ER stress induced upon cellular perturbations is regulated by activation of the unfoldedprotein response to restore homeostatic cellular functions[30]. Control of ER stress is required for cell survival anduncontrolled ER stress leads to cell death [31, 32]. ERJournal of Immunology Researchstress alters cellular iron homeostasis by inducing hepcidinexpression [33, 34]. Altered iron homeostasis and ER stressare associated with chronic neurodegenerative diseases suchas Huntington’s disease and Alzheimer’s disease [35, 36]. It isnot known whether ER stress also affects BDH2 expression.The goal of this study was to investigate whether ER stress andinflammation modulate BDH2 expression in macrophages.Here, we show that LPS-induced inflammation combinedwith chemically induced ER stress led to BDH2 downregulation, increased the expression of ER stress markers includingCHOP, upregulated hepcidin expression, downregulated ferroportin expression, caused iron retention in macrophages,and dysregulated cytokine release from macrophages. Further, we show that ER stress combined with inflammationdramatically upregulated NGAL expression as well as theinducible heme oxygenase-1 enzyme in macrophages. We alsoshow that vitamin D treatment prior to LPS restored BDH2expression. This is the first report to show that ER stressand inflammation downregulate the expression of BDH2 inhuman THP-1 macrophages. The results suggest that BDH2plays an important role in modulating iron-limiting innateimmune defenses.2. Materials and Methods2.1. Reagents. RPMI 1640 medium, Dulbecco’s modifiedEagle medium (D-MEM), HBSS, fetal bovine serum (FBS),penicillin/streptomycin, sodium pyruvate, and nonessentialamino acids were obtained from Cellgro Mediatech (Herdon,VA). Magnetic beads for a panel of human cytokines andchemokines were from Invitrogen (Carlsbad, CA). Tunicamycin, calcein-AM, and thiazolyl blue tetrazolium bromidewere purchased from Sigma Aldrich (St. Louis, MO). Lipopolysaccharide [37] from Neisseria meningitidis serogroup Bwas purified and quantified as previously described [38].2.2. Cell Culture and Macrophage Stimulation. THP-1macrophage-like cells were grown in RPMI 1640 mediumsupplemented with 10% FBS, 50 𝜇g/mL penicillin, and50 IU/mL of streptomycin. HEK293 cells were grown inD-MEM supplemented with 10% FBS, 50 𝜇g/mL penicillin,and 50 IU/mL of streptomycin. Freshly grown cells wereharvested and adjusted to 1 million cells/mL and thentransferred into 12-well tissue culture plates at 2 mL/well.To induce ER stress cells were treated with tunicamycin(10 𝜇g/mL in DMSO) and incubated overnight at 37 C.Control cells were treated with DMSO only and incubatedsimilarly. Following overnight exposure to tunicamycin, cellswere exposed to LPS (40 ng/mL) to induce inflammationand incubated for 6 hr at 37 C. Cells were centrifugedand supernatants were saved at 20 C for cytokine measurements. Harvested cells were washed with PBS and thenplaced in RLT buffer (Qiagen; Hilden, Germany) containing1% 𝛽-mercaptoethanol, passed over QiaShredder columns,and the resulting lysates were saved at 80 C for mRNAextraction.
Journal of Immunology Research2.3. RNA Isolation, Quantitative Real-Time PCR, and GeneExpression Analysis. RNA was isolated using RNeasy Minikits (Qiagen) following the manufacturer’s instructions aspreviously described [39]. Briefly, cell lysates saved in RLTbuffer were mixed in 70% ethanol and then passed overRNeasy columns. Columns were washed and treated with10 𝜇L of RNase-free DNase (Qiagen) for 15 min at roomtemperature prior to RNA extraction, followed by additional washing and centrifugation. RNA was eluted in 35 𝜇Lof RNase-free water and then was reverse transcribed tocDNA using QuantiTect Reverse Transcription kit (Qiagen) following the manufacturer’s instructions. Relative geneexpression was determined by quantitative RT-PCR performed on resulting cDNA using SYBR Green (Promega;Madison, WI) following the manufacturer’s instructions. ThemRNA level was calculated in reference to 𝛽-actin and foldchange gene expression was calculated in reference tocontrols using the ΔΔCT method. Results were normalizedto unstimulated DMSO-treated cells which were used ascontrols for basal gene expression level. The followingprimers were used for qRT-PCR reactions: human hepcidin 5 -GACCAGTGGCTCTGTTTTCC-3 and 5 -CACATCCCACACTTTGATCG-3 ; human BDH2 5 -CAGCGTCAAAGGAGTTGTGA-3 and 5 -TGGCGTATCAACTGTTCCTG-3 ; human NGAL 5 -ATGACATGAACCTGCTCGATA-3 and 5 -TCATAGTCGTTCATTATCTTC-3 ; human𝛽-actin 5 -TCTTCCAGCCTTCCTTCCT-3 and 5 -AGCACTGTGTTGGCGTACAG-3 . Primers for ER stress markers used in this study are as follows: human hsXBP-1 5 -TTCCGGAGCTGGGTATCTCA-3 and 5 -GAACCCCCGTATCCACAGTC-3 ; human GRP78 5 -ACGGCAGCTGCTATTGCTTA-3 and 5 -TCCTGACATCTTTGCCCGTC-3 ;human CHOP 5 -GACCTGCAAGAGGTCCTGTC-3 and5 -GCAGGGTCAAGAGTGGTGAA-3 . Ferroportin (HsSLC40A1 1 SG), transferrin receptor (Hs TFRC 1 SG), andheme oxygenase (Hs HMOX1 1 SG) QuantiTect primerswere purchased from Qiagen.2.4. Western Blot Analysis. Freshly grown THP-1 cells wereharvested and adjusted to 1 million cells/mL and 8 mL of cellswas transferred into 6-well tissue culture plates. To induceER stress, cells were treated with tunicamycin (10 𝜇g/mL) andincubated overnight at 37 C. Control cells were treated withDMSO only and incubated similarly. Following overnightincubation, some cells were exposed to LPS (40 ng/mL)to induce inflammation and incubated for 6 hr at 37 C.Harvested THP-1 cells were lysed in RIPA buffer (BostonBioProducts; Boston, MA) and centrifuged to remove nucleiand debris, and the protein concentration of the supernatantwas measured using a BCA protein assay (Thermo; Waltham,MA). Equal amounts of protein were removed from eachmacrophage treatment group, mixed with 6X Laemlli buffer,and boiled for 15 minutes. For untransfected HEK lysate andthe BDH2 transfected HEK positive control groups (OrigeneTechnologies; Rockville, MD), 50 ng of protein was loadedto adjust for overexpression. Samples were loaded onto a12% MiniProtean TGX gel (BioRad; Hercules, CA), electrophoresed, and transferred onto nitrocellulose membranes3(BioRad; Hercules, CA). To detect BDH2, membranes wereincubated with anti-BDH2 antibody (TrueMAB antibodyclone 2G1 from Origene). To detect actin, membranes wereincubated with a mouse anti-𝛽 actin antibody (Sigma).In both cases, membranes were incubated with an HRPconjugated anti-mouse secondary antibody (Cell Signaling;Danvers, MA), incubated in Amersham western blot detection reagent (GE Healthcare; Cleveland, OH), and visualizedwith HyBlot CL autoradiography film (Denville Scientific;Metuchen, NJ).2.5. Cytokine and Chemokine Measurements. Cytokines andchemokines released from THP-1 macrophages treated withtunicamycin alone, LPS alone, or both tunicamycin and LPSas described above were measured using Luminex magneticbeads (Invitrogen) following the manufacturer’s instructions.2.6. Measurement of Iron Retention in Macrophages. Intracellular accumulation of labile iron in macrophages was measured using the well-established calcein-AM method [40].Freshly grown THP-1 cells were treated with tunicamycin(10 𝜇g/mL) and incubated overnight prior to stimulation withLPS (40 ng/mL) for 6 hr. Control cells were treated withDMSO only. Harvested cells were resuspended in RPMI1640 medium supplemented with 10% FBS, and 0.5 𝜇Mcalcein-AM was added and incubated for 15 min at 37 C.Calcein-loaded cells were washed twice with PBS to removeextracellular calcein-AM and resuspended in HBSS. 100 𝜇Laliquots, containing 0.25 million cells, were transferred intoquadruplicate wells in black 96-well plates. After a 20 minincubation at 37 C, fluorescence was determined at 485 nm(excitation) and 535 nm (emission) wavelengths using a BioTek Synergy 2 Instrument (Winooski; VT).2.7. Cellular Viability Measurement Using the ColorimetricMTT Reduction Assay. The tetrazolium salt dye is cleavedby live and metabolically active cells but not by dead cells;therefore, the MTT reduction assay was used to measurethe viability of THP-1 cells treated with tunicamycin withor without LPS [41, 42]. Briefly, freshly grown THP-1 cellsadjusted to 1 million cells/mL were treated with tunicamycindoses ranging from 0.5 to 10 𝜇g/mL and incubated overnightfollowed in some cases by 6 hr of exposure to LPS. Controlcells treated with DMSO only were coincubated under thesame experimental conditions. Five mg of thiazolyl bluetetrazolium bromide was dissolved in 1 mL of PBS and 15 𝜇Lwas added to 150 𝜇L of treated THP-1 cells which were furtherincubated at 37 C for one hour. Cells were centrifuged toremove extracellular dye and then lysed in 150 𝜇L of DMSOto dissolve the intracellular dye. The absorbance of reduceddye was measured at 591 nm wavelength using a Bio-Tekspectrophotometer.2.8. Statistical Analysis. Mean values SD of three independent experiments, or two in few cases, were calculatedwith Microsoft Excel. Statistical analysis was performed withPrism v5.0 software using one-way ANOVA followed byBonferroni multiple comparisons post hoc analysis. 𝑃 values
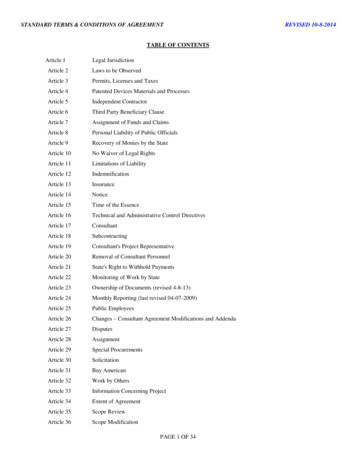
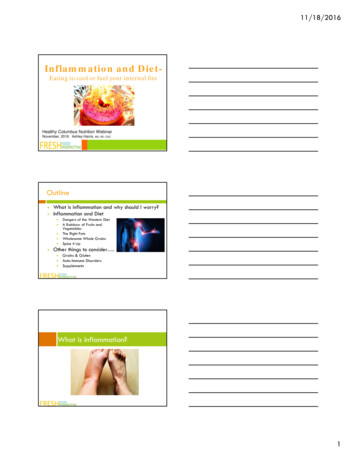
4Journal of Immunology ResearchAnti-BDH275(kD)50 3725BDH2 mRNA relative fold changeHEK BDH2HEK ( )Tun LPSLPSTunicamycinVehicle1.21 0.8 0.6NS0.4 0.2 0No treatment Tunicamycin(i)2345(kD)50 37256(ii)𝛽-Actin(kD)503725Tunicamycin LPS(b)BDH2 mRNA relative fold change1Anti-BDH275LPS1.11 0.9 0.8 0.70.60.5(ii)012.55Tunicamycin dose (𝜇g/mL)(a)(c)Figure 1: ER stress and inflammation downregulate BDH2 expression in macrophages. (a) Western blot analysis of BDH2 protein expressionin THP-1 macrophage-like cells (1 106 cells/mL) treated with tunicamycin (10 𝜇g/mL) or vehicle (DMSO) overnight prior to LPS exposure(40 ng/mL) for 6 hr. BDH2 protein was detected with monoclonal anti-BDH2 TrueMAB antibody clone 2G. Lane 1: vehicle-treated THP-1cells; 2: tunicamycin treated; 3: LPS treated; 4: tunicamycin and LPS treated; 5: untransfected HEK293 cells as negative control; 6: BDH2transfected HEK293 cells as positive control (BDH2 positive control contains a FLAG tag and 10-fold higher concentration was loaded inpanel (i) compared to panel (ii), representing two independent experiments); nonspecific band. (b) THP-1 macrophages were treated withtunicamycin (10 𝜇g/mL) as above and RNA was extracted and BDH2 gene expression was assessed by quantitative RT-PCR normalized to thatof 𝛽-actin. (c) THP-1 cells treated with tunicamycin doses 1, 2.5, or 5 𝜇g/mL and incubated overnight. The fold change in BDH2 gene expressionwas calculated in reference to DMSO treated control THP-1 cells using the ΔΔCT method and presented here normalized to vehicle (DMSO)treatment control. Error bars represent the SD from the mean of nine readouts generated from three independent experiments. 𝑃 valueswere calculated in reference to vehicle (DMSO) treatment control using one-way ANOVA followed by Bonferroni multiple comparisons posthoc analysis. 𝑃 values annotated 𝑃 0.0001; 𝑃 0.001–0.01; 𝑃 0.05 were not significant (NS).annotated 𝑃 0.0001; 𝑃 0.001–0.01; 𝑃 0.01–0.05;𝑃 0.05 were not significant.3. Results3.1. BDH2 Expression in Macrophages Is Downregulated by ERStress and Inflammation. Macrophages play a very importantrole in host defense and in iron homeostasis [1]. Recently,BDH2 was reported to play a crucial role in intracellulariron trafficking by catalyzing the synthesis of 2,5-DHBA [12].Further, ER stress has been shown to dysregulate cellulariron homeostasis [30]. Zughaier et al. reported that BDH2expression in macrophages is downregulated upon bacterialinfection [15]. However, BDH2 expression and regulationin macrophages during ER stress and inflammation havenot yet been described. To investigate BDH2 expression inmacrophages and its regulation by ER stress and inflammation, we employed human macrophage-like monocytic cells(THP-1) treated with tunicamycin overnight prior to LPSexposure for 6 hr to induce ER stress and inflammation,respectively. Here we show that BDH2 protein and geneexpression in macrophages was downregulated by ER stressand inflammation (Figure 1). Reduced BDH2 protein levelswere observed in THP-1 cells after treatment with LPS andtunicamycin as compared to cells treated with DMSO alone(Figure 1(a)). Consistent with this observation, BDH2 geneexpression was significantly downregulated when THP-1macrophages were treated with tunicamycin and LPS eitheralone or in combination (Figure 1(b)). Treatment with tunicamycin alone reduced BDH2 mRNA expression in a dosedependent manner (Figure 1(c)). Further, we examined theactivation of ER stress markers and as expected overnight
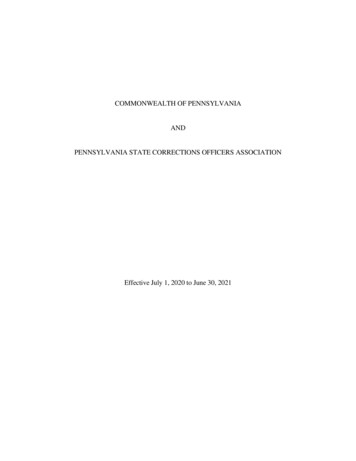
Journal of Immunology Research5NS NS hsXBP mRNA relative fold changeCHOP mRNA relative fold change 20181614121086420NSNo treatment TunicamycinLPSTunicamycin LPS 87 6 5432NS10No treatment Tunicamycin(a)LPSTunicamycin LPS(b) GRP78 mRNA relative fold change706050 40302010NS0No treatment TunicamycinLPSTunicamycin LPS(c)Figure 2: ER stress markers are induced in macrophages by tunicamycin. THP-1 cells (1 106 cells/mL) were treated with tunicamycin(10 𝜇g/mL) or DMSO overnight prior to LPS exposure (40 ng/mL) for 6 hr. RNA was extracted and ER stress markers CHOP (a), hsXBP (b),and GRP78 (c) gene expressions were assessed by quantitative RT-PCR normalized to 𝛽-actin. The fold change in CHOP and hsXBP geneexpression was calculated in reference to DMSO treated control THP-1 cells using the ΔΔCT method and presented here normalized to notreatment control. Error bars represent the SD from the mean of three independent experiments. 𝑃 values were calculated in reference to notreatment (DMSO only) control using one-way ANOVA followed by Bonferroni multiple comparisons post hoc analysis. 𝑃 values annotated 𝑃 0.0001; 𝑃 0.001–0.01; 𝑃 0.01–0.05; 𝑃 0.05 were not significant (NS).tunicamycin treatment significantly induced ER stress markers CHOP, hsXBP-1, GRP78 (Figure 2), and ATF6 (data notshown). In contrast, 6 hr LPS treatment alone did not upregulate ER stress markers in THP-1 cells (Figure 2), as documented previously [43]. Cellular viability was assessed usingthe MTT reduction assay [41] which showed that the doses oftunicamycin and LPS used here did not reduce cellular viability (see Supplementary Figure 1A in Supplementary Material available online at http://dx.doi.org/10.1155/2014/140728).These data indicate that ER stress and inflammation downregulate BDH2 expression in THP-1 macrophages.3.2. Cellular Iron Homeostasis Is Dysregulated by ER Stressand Inflammation in Macrophages. ER stress controls ironhomeostasis via the induction of hepcidin, the master ironregulating hormone [2]. Hepcidin binds to the only knowncellular iron exporter, ferroportin, and leads to its internalization and degradation, consequently inhibiting iron egressfrom macrophages [7]. The dysregulation of the hepcidinferroportin axis leads to iron retention in macrophagesand increases the cytosolic labile iron pool which is highlyreactive and causes oxidative stress [3]. Therefore, detoxifying labile iron is essential to maintaining cellular ironhomeostasis. To investigate intracellular iron status in tunicamycin and LPS treated THP-1 macrophages we determinedthe expression of hepcidin and ferroportin. The data showthat tunicamycin-induced ER stress as well as LPS-inducedinflammation led to significant upregulation of hepcidin geneexpression in THP-1 macrophages (Figure 3(a)). In contrast,tunicamycin and LPS treatment led to a dramatic reduction
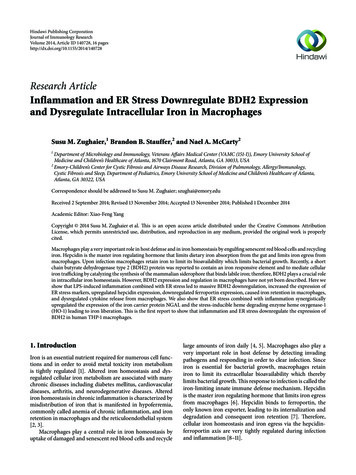
6Journal of Immunology Research NS1.218 16FPN1 mRNA relative fold changeHepcidin mRNA relative fold changeNS 1412 10864210.8NS0.6NSNS0.4 0.2 00No treatment TunicamycinLPSTunicamycin LPSNo treatment Tunicamycin(a)LPSTunicamycin LPS(b)Figure 3: ER stress and inflammation dysregulate cellular iron homeostasis. THP-1 cells (1 106 cells/mL) were treated with tunicamycin(10 𝜇g/mL) or DMSO overnight prior to LPS exposure (40 ng/mL) for 6 hr. ((a), (b)) Hepcidin and ferroportin (FPN1) gene expression wasassessed by quantitative RT-PCR normalized to 𝛽-actin. The fold change in hepcidin and FPN1 gene expression was calculated in referenceto DMSO treated control THP-1 cells using the ΔΔCT method and presented here normalized to no treatment control. Error bars representthe SD from the mean of three independent experiments. 𝑃 values were calculated in reference to vehicle (DMSO) treatment control usingone-way ANOVA followed by Bonferroni multiple comparisons post hoc analysis. 𝑃 values annotated 𝑃 0.0001; 𝑃 0.001–0.01; 𝑃 0.01–0.05; 𝑃 0.05 were not significant (NS). Calcein-AM fluorescence (AU)1000000 900000 800000NS 700000600000500000400000No treatment TunicamycinLPSTunicamycin LPSFigure 4: ER stress and inflammation induce iron retention in macrophages. THP-1 cells (1 106 cells/mL) were treated with tunicamycin(10 𝜇g/mL) or DMSO overnight prior to LPS exposure (40 ng/mL) for 6 hr and iron retention in macrophages was determined using thecalcein-AM fluorescent probe method [40]. DMSO treated cells were incubated simultaneously and used as controls. Calcein-AM fluorescencewas measured by excitation at 488 nm and emission at 528 nm wavelength (see Section 2). Calcein-AM fluorescence is quenched upon bindingiron and is therefore inversely correlated with intracellular iron accumulation. AU: arbitrary units. Error bars represent the SD from the meanof triplicate reading and data are representative of two independent experiments. 𝑃 values were calculated in reference to vehicle (DMSO)treatment control using one-way ANOVA followed by Bonferroni multiple comparisons post hoc analysis. 𝑃 values annotated 𝑃 0.0001; 𝑃 0.001–0.01; 𝑃 0.01–0.05; 𝑃 0.05 were not significant (NS).in ferroportin expression in macrophages (Figure 3(b)). Ferroportin allows iron egress from macrophages; therefore, itsdegradation leads to iron retention. We measured labile ironaccumulation in macrophages using calcein-AM [40] andfound that tunicamycin and LPS treatment led to significantiron retention (Figure 4 and Supplementary Figure 1B).A synergistic effect on iron retention was observed whenmacrophages were cotreated with tunicamycin and LPS. Theresults suggest that chemically induced ER stress and inflammation alter intracellular iron homeostasis in macrophages.
Journal of Immunology Research7 2500 3500 30002500 200015001000500012.3 fold1 foldNo treatment TunicamycinLPSTunicamycin LPSNGAL mRNA relative fold change4000NGAL mRNA relative fold change 2000 1500 1000 500NS052.50.50Tunicamycin doses (𝜇g/mL)TunicamycinTunicamycin LPS(a)(b)Figure 5: NGAL gene expression is massively upregulated by ER stress. (a) THP-1 cells (1 106 cells/mL) were treated with tunicamycin(10 𝜇g/mL) or DMSO overnight prior to LPS exposure (40 ng/mL) for 6 hr. (b) THP-1 cells (1 106 cells/mL) were treated with tunicamycindoses (5, 2.5, or 0.5 𝜇g/mL) as in panel (a) or tunicamycin followed by LPS (40 ng/mL). RNA was extracted and NGAL gene expressionwas assessed by quantitative RT-PCR normalized to 𝛽-actin. The fold change in NGAL gene expression was calculated in reference to DMSOtreated control THP-1 cells using the ΔΔCT method and presented here normalized to vehicle (DMSO) treatment control. Error bars representthe SD from the mean of three independent experiments. 𝑃 values were calculated in reference to no treatment (DMSO only) control usingone-way ANOVA followed by Bonferroni multiple comparisons post hoc analysis. 𝑃 values annotated 𝑃 0.0001; 𝑃 0.001–0.01; 𝑃 0.01–0.05; 𝑃 0.05 were not significant (NS).3.3. ER Stress and Inflammation Dramatically Induce NGALGene Expression. NGAL plays a dual role in physiologiccellular iron homeostasis and in host defense. We recentlyreported that LPS induced NGAL secretion from peripheralmonocytes [44]. ER stress is also reported to highly induceNGAL expression [45]. However, the impact of ER stresscombined with inflammation on NGAL expression is not yetknown. To this end, we determined NGAL gene expressionin tunicamycin and LPS treated macrophages. As expected,LPS treatment led to significant upregulation of NGALgene expression ( 12-fold) but tunicamycin treatment led toa dramatic 1500-fold increase in NGAL gene expression(Figure 5(a)). Tunicamycin induced NGAL gene expressionin a dose-dependent manner (Figure 5(b)). A synergisticeffect was observed when THP1 cells were cotreated withtunicamycin and LPS which resulted in an approximately 3000-fold increase in NGAL gene expression (Figure 5(a)).This synergistic effect was tunicamycin dose-dependent(Figure 5(b)). Tunicamycin-induced ER stress led to 100fold greater increase in NGAL gene expression comparedto LPS. The synergistic cross-talk between tunicamycininduced ER stress and LPS-induced inflammation led to 200-fold increase in NGAL gene expression compared toLPS alone. These data suggest that chemically induced ERstress dramatically increases NGAL expression more thaninflammation but when combined a synergistic upregulationof NGAL is observed.3.4. ER Stress and Inflammation Induce Heme Oxygenase1 (HO-1) Gene Expression. HO-1 is a stress-induced antiinflammatory [19, 21, 22] cytoprotective enzyme that catalyzes the degradation of heme and consequently liberates iron and carbon monoxide [20]. The released carbonmonoxide suppresses hepcidin expression; therefore, HO-1plays a role in regulating iron homeostasis [46]. Our datademonstrate that ER stress and inflammation dysregulateintracellular iron homeostasis in macrophages. Therefore, weinvestigated the impact of ER stress and inflammation onHO-1 expression in macrophages as an anti-inflammatoryimmune response. Here we show that HO-1 gene expressionis significantly upregulated in THP-1 cells treated with tunicamycin or LPS alone (Figure 6). However, the combinationof tunicamycin and LPS treatment synergistically upregulatedHO-1 expression in THP-1 cells (Figure 6) suggesting a potentresponse to combat cellular stress.3.5. Vitamin D Restores BDH2 Expression in LPS-StimulatedMacrophages. In this report we show that tunicamycininduced ER stress and LPS-induced inflammation downregulate BDH2 expression in macrophages and alter intracellulariron homeostasis. Vitamin D possesses immune modulatoryactivity and exerts an anti-inflammatory effect [47–49].Zughaier et al. found that vitamin D plays an important rolein regulating the iron-hepcidin-ferroportin axis in monocytes by restoring hepcidin and ferroportin gene expression
8Journal of Immunology Research
Department of Microbiology and Immunology, Veterans Aa irs Medical Center (VAMC (-I)), Emory University School of Medicine and Children s Healthcare of Atlanta, Clairmont Road, Atlanta, GA , USA Emory-Children s Center for Cystic Fibrosis and Airways Disease Research, Division of Pulmonology, Allergy/Immunology,