Transcription
Mutanga et al. BMC Public Health(2019) EARCH ARTICLEOpen AccessLong-term survival outcomes of HIVinfected children receiving antiretroviraltherapy: an observational study fromZambia (2003–2015)Jane N. Mutanga1,2,6* , Simon Mutembo2,3,6, Amara E. Ezeamama4, Xiao Song2, Robert C. Fubisha1,Kunda Mutesu-Kapembwa1, Derrick Sialondwe1, Brenda Simuchembu1, Jelita Chinyonga3, Philip E. Thuma5and Christopher C. Whalen2,6AbstractBackground: In 2017, 64% of children living with HIV in Zambia accessed Antiretroviral Therapy (ART). Despiteexpanded ART coverage, there is paucity of information on effectiveness of pediatric ART in reducing mortality. Theaim of this research is to describe treatment outcomes, measure mortality rates and assess predictors of mortalityamong children receiving ART.Methods: Using a retrospective cohort study design, we abstracted routinely collected clinical data from medicalrecords of children from birth to 15 years old, who had received ART for at least 6 months at Livingstone CentralHospital in Southern Province Zambia, between January 2003 and June 2015. The primary outcome was death.Cause of death was ascertained from medical records and death certificates. Distribution of survival times accordingto baseline covariates were estimated using Kaplan Meier and Cox Proportional Hazards methods.Results: Overall, 1039 children were commenced on ART during the study period. The median age at treatmentinitiation was 3.6 years (IQR: 1.3–8.6) and 520 (50%) children were female. Of these, 71 (7%) died, 164 (16%) werelost to follow-up, 210 (20%) transferred and 594 (56%) were actively on treatment. After 4450 person years, mortalityrate was 1.6/100 (95% CI: 1.4–1.8). Mortality was highest during the first 3 months of treatment (11.7/100 (95% CI: 7.6–16.3). In multivariable proportional hazards regression, the adjusted hazards of death were highest amongchildren aged 1 year (aHR 3.1 (95% CI: 1.3–6.4), compared to those aged 6–15 years, WHO stage 4 (aHR 4.8(95% CI: 2.3–10), compared to WHO stage 1 and 2. In the sensitivity analysis to address bias due to loss to followup, mortality increased 5 times when we assumed that all the children who were lost to follow up died within 90days of their last visit.Conclusion: We observed low attrition due to mortality among children on ART. Loss to follow-up was high (16%).Mortality was highest during the first 3 months of treatment. Children aged less than one year and those withadvanced WHO disease stage had higher mortality. We recommend effective interventions to improve retention incare and early diagnosis of HIV in children.Keywords: HIV, Pediatrics, Therapeutics, Treatment outcome, Survival* Correspondence: janemutanga@gmail.com1Department of Pediatrics and Child Health, Livingstone Central Hospital,Akapelwa Street, Livingstone, Zambia2Department of Epidemiology and Biostatistics, College of Public Health,University of Georgia, Athens, Georgia, USAFull list of author information is available at the end of the article The Author(s). 2019 Open Access This article is distributed under the terms of the Creative Commons Attribution 4.0International License (http://creativecommons.org/licenses/by/4.0/), which permits unrestricted use, distribution, andreproduction in any medium, provided you give appropriate credit to the original author(s) and the source, provide a link tothe Creative Commons license, and indicate if changes were made. The Creative Commons Public Domain Dedication o/1.0/) applies to the data made available in this article, unless otherwise stated.
Mutanga et al. BMC Public Health(2019) 19:115BackgroundThe availability of Antiretroviral Therapy (ART) for children living with HIV and implementation of universaltreatment of all pregnant and breastfeeding women living with HIV (Option B ) is a game changer in the global fight against HIV [1]. In 2017, about 1.8 millionchildren were living with HIV globally and 90% of thesechildren lived in sub-Saharan Africa [2, 3]. Althoughprogress has been reported in the scale-up of access totreatment for children, only 52% of children living withHIV received lifesaving ART and only 51% ofHIV-exposed infants were tested for HIV by the age of2 months as recommended by the World HealthOrganization (WHO) guidelines [2]. These estimates fallshort of the UNAIDS 90–90-90 treatment targets, astrategy to end the global HIV epidemic. This strategyaims to achieve the following by 2020: 1) 90% of peopleliving with HIV will know their status, 2) 90% of all diagnosed people will be on ART, 3) 90% of people on ARTwill be virally suppressed [4]. Although some milestoneshave been achieved in the provision of ART, access toearly HIV diagnosis and ART among infants and children remains a challenge in high HIV burden settings[2, 5].Similarly, the pediatric HIV program in Zambia hasmade tremendous progress with over 64% of childrenliving with HIV accessing ART by the end of 2017 [6].With a population of 17 million people and an estimatedHIV prevalence of 12.9%, 72,000 were children livingwith HIV and 8900 were newly infected in 2017 [6, 7].This scenario creates a large pool of children living withHIV in need of treatment. An early study done in routine care settings in Zambia demonstrated that childrenwere diagnosed at older ages with advanced WHO stage3 or 4 disease. The same study reported that 57% ofdeaths occurred within the first 90 days of treatment initiation and loss to follow-up was high [8]. Early mortality was consistently associated with lower CD4 count,younger age, low weight for height and anemia at ARTinitiation [8–10]. Recent studies suggest that routinecare settings in resource limited settings are still confronted with critical gaps in early infant diagnosis andpediatric HIV treatment, resulting in children initiatingtreatment with advanced disease and at high risk ofdeath during the first 3–6 months of treatment [11, 12].In addition, there are concerns around interpretation oftreatment outcomes in routine care settings because ofthe high loss to follow-up and high numbers of transferswith no mortality ascertainment [11, 13].Although, pediatric HIV treatment programs in resource limited settings like Zambia have been treatinglarge numbers of HIV-exposed and infected children forover 15 years, long-term survival and associated factorsincluding barriers to long-term adherence and retentionPage 2 of 12in care are not adequately elucidated and therefore thewider impact of these interventions is not clearly understood [14–16]. The aim of this research is to describetreatment outcomes, measure mortality rates and assesspredictors of mortality among children receiving ART ina routine care setting over a 12-year period (2003–2015)at Livingstone Central Hospital in Southern Province,Zambia.MethodsUsing a retrospective cohort study design, we evaluatedtreatment outcomes among children living with HIVwho received ART between January 2003 and June 2015.Study setting and populationThe data were collected from the Pediatric Center of Excellence clinic (PCOE) at Livingstone Central Hospital(LCH) in Southern Province, Zambia. Livingstone Central Hospital offers preventive and treatment services tonearly 1.2 million people in southern and western partsof Zambia. Pediatric HIV treatment at LCH was startedin 2003 in line with national policy and in 2006 thePCOE clinic was established through a collaborativeagreement between the Ministry of Health in Zambiaand the Centers for Diseases Control and preventioncountry office (CDC) [15].The Ministry of Health in Zambia began implementation of the WHO guidelines of treating all people whotest positive for HIV in 2016. The pediatric HIV testingand treatment guidelines recommended collection ofdried blood spots (DBS) cards for DNA-PCR from allHIV-exposed infants at birth, 6 weeks and 6 months ofage followed by serologic testing at 9 months, 12months, 18 months and 3 months after cessation ofbreastfeeding [17]. Dried blood spots cards were collected from all children who were still breastfeeding andhad HIV positive serologic tests, for confirmatory testingwith HIV DNA-PCR. Routine provider initiated counseling and testing was offered to guardians of all hospitalized children. Prior to 2016, pediatric HIV treatmentguidelines recommended ART based on clinical and immunological criteria. First line ART regimens comprisedof three antiretroviral medicines including two Nucleoside reverse transcriptase inhibitors (NRTI’s): Azido thymidine, Stavudine, Abacavir, (Tenofovir for childrenabove 10 years old) and Lamivudine, plus oneNon-NucleosideReverse TranscriptaseInhibitor(NNRTI), either Nevirapine or Efavirenz for ART naïveinfants and children. Infants who took ART prophylaxisafter delivery were commenced on Protease inhibitors(PI) based regimens (Lopinavir boosted with Ritonavir)in addition to two NRTIs. Triple NRTI based regimenswere recommended for children below 3 months of agewho were co-infected with Tuberculosis at baseline.
Mutanga et al. BMC Public Health(2019) 19:115Patient data were abstracted from the medical recordsof children living with HIV who had received ART. Theinclusion criteria were: all children aged from birth to 15years at the time of ART initiation, children who hadtaken ART for 6 months or more, children who had received at least three ARVs. Children who received oneantiretroviral drug for PMTCT were excluded from thestudy because we considered ART to be a combination ofat least three antiretroviral drugs. We excluded childrenwho started ART on or after December 31st 2014 becausedata collection was closed on June 30th 2015 and we included only children who took ART for at least 6 months.Data collectionWe abstracted routinely collected data from patientmedical records into a Microsoft access database. Weabstracted the data starting with initial patient enrollment forms which included demographics such as dateof birth, gender, date of first HIV test, mode of deliveryand date when they started to take ART. We assignedunique study identification numbers to each patient record. Data abstraction was done independently by twodata entry clerks and their entries were verified at random intervals by a supervisor.Study outcomesThe main outcome was death. We ascertained deathfrom hospital medical records. We actively searched fordeath certificates and other documentation on the details of death in medical records. In some cases, detailsof death were verified by verbal reports from the child’sadult family members or care givers.The secondary outcomes were: 1) Lost to follow-up,and 2) Transferred to another facility. Lost to follow-upwas defined as no clinical contact for more than3 months after they missed their last scheduled appointment. Patients who missed appointments for more than90 days were visited by a clinic nurse and their statusestablished. All the children who were lost to follow-upor transferred were censored on the day of their last visitto the clinic. Children who survived to the end of thestudy were censored on June 30th, 2015. Adolescentswere censored on the date they transitioned into theadolescent clinic and were no longer seen in thepediatric clinic at 15 years of age.ExposureThe main exposure was initiation of ART. Since this wasa retrospective cohort study, the decision to initiate ARTwas made by the treating physician and the child’s caregivers and not influenced by the study investigators. Covariates that were abstracted included: ART start date,the initial drug regimen and baseline laboratory measurements which included hemoglobin, CD4 count orPage 3 of 12CD4 percentage. Additionally, WHO clinical stage andanthropometric measurements were abstracted.Statistical analysisBaseline demographics and clinical features were described by estimating medians and interquartile ranges forcontinuous variables and frequencies and proportions forcategorical variables. Observed survival was defined as theduration of time in years from the date of ART initiationto the date of death or censoring. We estimated the distribution of survival times for the baseline covariates affecting survival using the Kaplan-Meier (KM) method. Thecovariates were selected apriori from literature supportedby a directed acyclic model (Additional file 1). Log-ranktests were used to compare the survival curves. Cox Proportional Hazards models were used to estimate the hazard ratios for death and their 95% confidence intervals toquantify the associations. We evaluated the proportionalhazards assumption using log-log plots and plots ofSchoenfeld’s residuals and no violations of the assumptionwere found. To calculate the mortality rates, we estimatedthe actual person time that everyone contributed to thestudy during the first 6 months, 1 year, 2 years, 5 years and10 years and constructed confidence intervals.Multivariable Cox models were used to adjust for possible confounding. All p-values were two tailed. In the analysis, age was a categorical variable with 3 levels. The agecategorization was based on findings from previous studieswhich demonstrated that infants aged less than 12 monthshad a different survival experience based on disease progression [5, 18]. WHO stage was a categorical variable with4 levels in the initial analysis. In the Cox Proportional Hazards models, we combined WHO stage 1 and 2, thereforeWHO stage was a categorical variable with 3 levels.The status of children who were lost to follow-up in thisstudy was unknown. A meta-analysis of individual patientdata from HIV treatment programs in Sub-Sahara Africafound that 20% of adults lost to follow-up were actuallydeceased [19]. To evaluate the “worst case scenario” effectof bias due to loss to follow-up on mortality, we performedsensitivity analysis by assuming that all the children whowere lost to follow-up survived for 90 days after their lastvisit and then died. We estimated the mortality rates forthis scenario at 3 months, 6 months, 1, 5 and 10 years andcompared with the main study results.Data analysis was done using SAS version 9.4 (SAS Institute Inc., Cary, NC) and R statistical software version3.4 [20]. We used the Survival package to plot the KMcurves and Survminer package to visualize the KMcurves [21, 22].ResultsOne thousand and thirty-nine (1039) children aged lessthan 15 years commenced ART at LCH between January
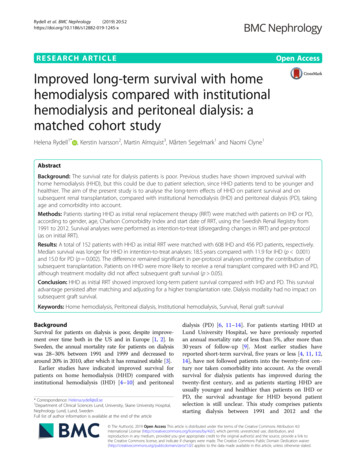
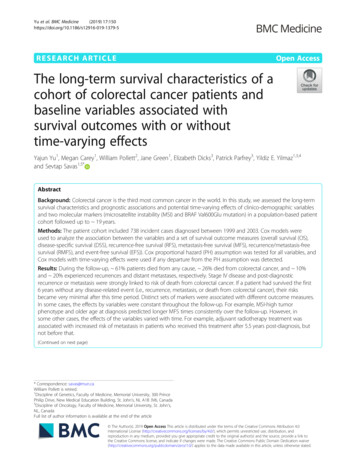
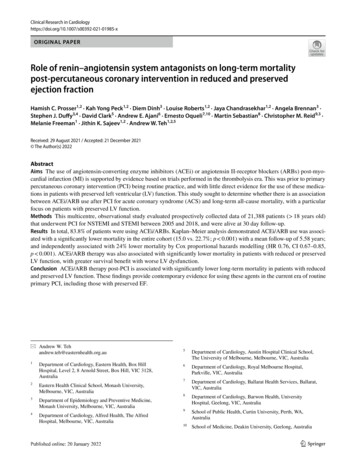
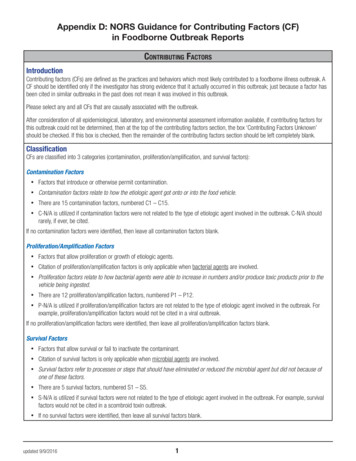
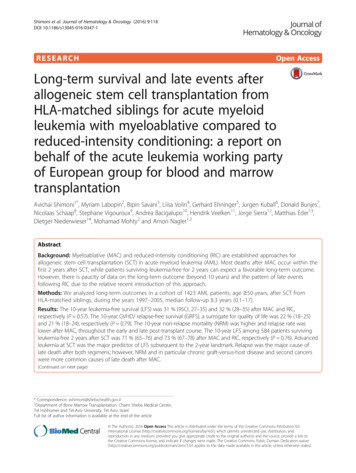
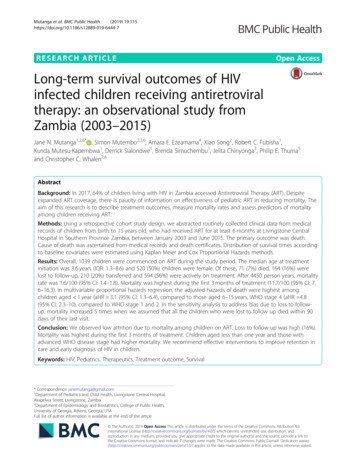
Mutanga et al. BMC Public Health(2019) 19:1152003 and June 2015. Overall, 71 (7%) children were confirmed to have died after commencing treatment and 594(56%) were alive and active in care at the time of thisstudy. A total of 164 (16%) were lost to follow-up and 210(20%) transferred to other health care facilities (Fig. 1).Page 4 of 12on two NRTIs and a Protease Inhibitor (Lopinavirboosted with Ritonavir) while 78 (8%) children tooktriple NRTIs at baseline, (Azido thymidine or Stavudine,Lamivudine and Abacavir) (Table 2).Mortality trendsBaseline characteristics of children started on ARTAt baseline, 520 (50%) children were female and 721(69%) were cared for by their biological mothers. A totalof 179 (17%) children started treatment during their firstyear of life. At least 304 (29%) children were diagnosedduring hospital admission and 30 (3%) were diagnosedafter delivery from the delivery wards (Table 1).The median age at baseline was 3.6 years (IQR: 1.3–8.6). The immunological criteria that was used to initiatetreatment for children older than 5 years was CD4 countand the baseline median CD4 count was 505 (IQR: 243–948) while CD4 percentage was used for children younger than 5 years. Children aged less than 1 year had median CD4 percentage of 19.4 (IQR: 12.4–25.6) andchildren aged between 1 and 5 years had median CD4percentage of 16.7 (IQR: 11.3–21.5). At least 1002 (97%)took Cotrimoxazole at baseline and 301 (30%) had adiagnosis of clinical Tuberculosis (TB) at ART initiation.Overall, 472 (46%) were WHO stage 3 and 177 (17%)were advanced WHO stage 4 (Table 2).The first line regimen for 907 (87%) children was twoNRTIs and one NNRTI, and 54 (5%) were commencedFig. 1 Treatment outcomes and retention in care among childrenon ART at LCH 2003–2015A total of 71 deaths were documented during the studyperiod. The highest proportion of deaths occurred between 2007 and 2011 (Additional file 2). The largestnumber of deaths were among young children aged lessthan 12 months (n 29; 41%) (Fig. 2). Of the 71 deceased children, 44% (n 31) were WHO stage 4, 41%(n 29) were WHO stage 3, 8% (n 6) were WHO stage2 and 7% (n 5) were WHO stage 1. We verified causesof death from 27 (38%) death certificates. Of the verifieddeaths 14% (n 10) were due to diarrhea, 11% (n 8) severe pneumonia and protein energy malnutrition respectively and 7% (n 5) were due to TB (Table 3).For an overall person-year of observation (PYO) of4450 PY the mortality rate was 1.6/100 PYO (95%CI:1.4–1.8). Mortality was highest within the first 3months of treatment initiation with estimated mortalityrate of 11.9/100 PYO (95% CI:7.6–16.3), whichaccounted for 41% (n 29) of the deaths (Table 4). The3-month survival probability was 0.97 (Fig. 3). After 10years of treatment, the observed mortality rate was 1.6/100 PYO (95% CI: (1.4–1.8).In a sensitivity analyses that assumed the “worst casescenario” that all children who were lost to follow-up died90 days after their last clinic visit, the mortality rate after3 months of treatment was 14.5/100 person years (95% CI:9.7–19.2). After 10 years of treatment, the mortality ratewas 5.4/100 person years (95% CI: 4.7–6.1) which is 5times higher than actual observed mortality rate (Table 5).Children who took triple NRTI regimens had theshortest survival time (86% at 1 year) compared to children who took 2NRTI 1NNRTI and protease inhibitorbased regimens (log rank test, p 0.0001, Fig. 4 d). Otherbaseline factors associated with shorter survival were:children who had anemia at ART initiation (Hemoglobin 8 g/dl) (p 0.032), children of mothers who did nottake antiretroviral drugs during pregnancy (p 0.012),severe wasting as estimated by WAZ score -3SD (p 0.051) and infants who were given ARVs for prophylaxis(p 0.056) (Additional file 3). Tuberculosis at baseline,calendar year of ART initiation and whether the infanttook antiretroviral drugs for prophylaxis at enrollmentwere not statistically significant in the univariable Coxproportional hazards model and we did not includethem in the multivariable model (Table 6).Infants who started ART within the first year of life experienced shorter survival time compared to those whostarted treatment between 1 to 5 years and between 6 to15 years of age (Fig. 4 a, log-rank test, p-value 0.0001).
Mutanga et al. BMC Public Health(2019) 19:115Page 5 of 12Table 1 Baseline Characteristics of infants and Children who Received ART by Age Group - Livingstone Central Hospital, Zambia(2003–2015)Characteristic 1 year1–5 years6–15 yearsTotalN 179 (17%)N 387 (37%)473 (46%)N 1039Female84 (16%)182 (35%)254 (49%)520Male95 (18%)205 (40%)219 (42%)5190.5 (0.3–0.8)2.0 (1.4–3.2)10.2 (7.4–13)3.6 (1.3–8.6)Gender n(%)Age(years) at ART initiation Median (IQR)Duration (years) on treatment Median(IQR)2.1 (0.5–5.2)4.2 (1.2–6.5)4.1 (1.9–6.7)3.8 (1.2–6.5)Duration of time (weeks) from diagnosis to ART initiation Median (IQR)7 (2–11)5 (2–15)7 (2–39)6 (2–19)Mother150 (21%)316 (44%)255 (35%)721Father5 (11%)8 (18%)30 (68%)44Grandparent6 (8%)24 (32%)46 (61%)76Sibling01 (6%)14 (88%)16other relative5 (4%)22 (17%)99 (79%)126missing13 (22%)16 (28%)29 (50%)56Out-patients departments22 (13%)44 (25%)110 (63%)176Inpatient Wards80 (26%)152 (50%)72 (24%)304Who is the child’s GuardianPoint of Entry into HIV careDelivery wards30 (100%)0030VCT clinic(FSU)11 (9%)42 (33%)72 (57%)127TB clinic3 (25%)3 (25%)6 (50%)12missing58 (15%)129 (33%)205 (52%)390None2 (10%)11 (58%)6 (52%)19Primary or secondary school113 (18%)226 (37%)272 (44%)612Some college or university11 (18%)16 (27%)32 (53%)60missing53 (15%)134 (38%)163 (47%)348102 (14%)243 (35%)358 (51%)70500191 (100%)191Educational level of caregiverDoes the family have a phoneYesHas HIV status been disclosed to the childYesThe survival probability for infants aged less than 1 yearwas 0.93 after 3 months of treatment compared to 0.96 forthose aged 1 to 5 years and 0.99 for those aged 6–15 years.In the multivariable Proportional Hazards regression, theadjusted hazards of death among children aged less than1 year were 3.1 (95% CI: 1.3–6.4), and children aged 1–5years aHR 1.1 (95% CI: 0.6–2.3) when compared to thereferent group 6–15 years (Table 6).Children with severe immune-suppression (WHOstage 4) at baseline had lower survival probability of 93,97% for the WHO stage 3 and 99% for WHO stage 1and 2, (Fig. 4 b, log-rank test, p-value 0.0001). In themultivariable Proportional Hazards regression, childrenwith advanced WHO stage 4 had the highest hazards ofmortality (aHR 4.8 (95% CI: 2.3–10) (p .0001), WHOstage 3 (aHR 1.8 (0.9–3.6) p 0.1188), compared to thereferent group WHO stage 1 and 2, (Table 6).DiscussionIn this study carried out in a routine pediatric HIV treatment setting, we found that after 12 years of treatment(2003–2015) attrition due to death was low (7%; n 71).Death was highest within the first 3 months of startingART (mortality rate: 11.7/100 PYO; 95% CI:7.6–16.3).The hazard of death was highest among children agedless than 12 months (aHR: 3.1: 95% CI: 1.3–6.4), compared to the referent group 6–15 years. Loss tofollow-up was high (16%; n 164).The mortality rate observed in this study was muchlower than that observed in other parts of Zambia [8,
Mutanga et al. BMC Public Health(2019) 19:115Page 6 of 12Table 2 Baseline laboratory and clinical features of infants and children who received ART at Livingstone Central Hospital, Zambia(2003–2015)Characteristics 1 year1–5 years6–15 yearsTotalN 179 (17%)N 387 (37%)N 473 (46%)N 1039CD4 count at enrollment Median (IQR)1028 (535–1498)777 (444–1135)278 (118–487)505 (243–948)CD4 percent at enrollment Median(IQR)19.4 (12.4–25.6)16.7 (11.3–21.5)14.0 (8.3–21.2)16.2 (10–23)Hemoglobin at enrollment (Median IQR))8.8 (7.8–9.7)9.3 (8.0–10.5)10.3 (9–11.5)9.6 (8.3–10.9)Yes169 (17%)378 (38%)451 (45%)1000No9 (23%)8 (21%)22 (56%)3930 (38%)46 (59%)2 (3%)782NRTIs 1NNRTI130 (14%)320 (35%)457 (50%)907LPV/r based19 (35%)21 (39%)14 (26%)542003–20053 (4%)17 (24%)51 (72%)71Taking Cotrimoxazole at enrollmentDrug regimen at ART initiation N(%)3 NRTI’sYear of ART start N(%)2006–200988 (17%)202 (39%)222 (43%)5122010–201262 (20%)117 (38%)126 (41%)3052013–201626 (17%)51 (34%)74 (49%)151Yes69 (45%)71 (46%)14 (9%)154No110 (12%)316 (36%)459 (52%)885Yes55 (43%)58 (47%)8 (10%)123No124 (14%)329 (36%)463 (51%)810Mom took ARVs for PMTCT during pregnancyChild took ARV prophylaxis after birth N(%)Nutritional status at enrollmentWeight for height score -3SD36 (20%)88 (48%)58 (32%)182weight for height score 3 SD143 (17%)299 (35%)415 (48%)857WHO stage 152 (24%)64 (29%)103 (47%)219WHO stage 220 (13%)39 (25%)99 (63%)158WHO stage 365 (14%)200 (43%)206 (44%)471WHO stage 441 (23%)78 (44%)58 (33%)177missing1671433 (10%)105 (33%)178 (56%)318Baseline clinical staging (WHO stage) N(%)Diseases at baseline N(%)TBpneumonia35 (21%)68 (41%)61 (27%)165Diarrhea45 (18%)117 (47%)84 (34%)247Premature4 (25%)8 (50%)4 (25%)16term107 (22%)201 (41%)175 (36%)485unknown68 (13%)178 (33%)294 (54%)544C/Section5 (28%)3 (17%)10 (56%)18SVD105 (21%)206 (42%)180 (37%)491unknown69 (13%)178 (34%)283 (53%)530Gestation age at birth N(%)Mode of delivery N(%)
Mutanga et al. BMC Public Health(2019) 19:115Page 7 of 12353029Deaths (N)2520171510655201420002210Age (years)Fig. 2 Age at time of Death Among 71 Deceased Children on ART: Livingstone Central Hospital, Zambia (2003–2015)23]. In a study conducted in an urban area in Zambia,the mortality rate was 6.6/100 PYO over 3018 PYO [8]and another study in a rural area in Zambia found a highmortality of 14.4% after 6 months of treatment [23].These 2 studies were characterized by high mortalitywithin the first 3 months (17.4/100 PYO) and the associated risk factors were similar to what we observed [8].Mortality rates in our study population were also similarto a study from a rural setting in Malawi where 12months mortality rate was 6.6/100 PYO [95% CI: 5.5–7.9] and overall mortality was 3.4/100 PYO [95% CI:2.9–4] after 5 years of follow-up [24]. Our observed mortalityrate is however higher than findings from developedcountries where 10-year mortality was as low as 0.3/100PYO in the Dutch cohort [25].The observation that hazards of death were highestwithin the first few months after ART initiation and thenTable 3 Cause of death as recorded on death certificateCause of deathTotal numberDiarrhea10Severe Pneumonia8Severe wasting - Protein Energy Malnutrition8Pulmonary Tuberculosis5TB Meningitis2Gastrointestinal Bleeding2Malaria2Meningitis/encephalitis2We found death certificates of 27 patients. The cause of death as recorded onthe death certificate is listed in the table aboveSome patients had more than one cause of death listed on thedeath certificatedeclines after the first 6 months of treatment is consistent with studies done in other parts of Zambia and insimilar settings [8, 26–28]. Other studies have attributedthe high early mortality to late presentation to care [29].Studies done in routine clinic settings in resourcelimited settings found that the cumulative incidenceof mortality during the first year of treatment amongolder children between 5 and 10 years of age was lessthan 2% to more than 45% among infants aged lessthan 12 months with severe disease [10]. Once children get past the initial 6 months of ART, their riskof mortality declines to very low rates especially whenadherence to treatment and follow-up is optimized[11, 27, 30].Our finding that the hazards of mortality were highestamong infants and children aged less than 12 months ofage is consistent with predictive models that have beendone in both developed and developing countries and infact motivated the universal ART policy by WHO to testand treat all HIV-exposed infants and children [31]. Resultsof a modelling study done in six countries in Sub-SaharaAfrica suggested that mortality is higher among perinatallyHIV-infected children than those infected through breastfeeding [32]. Perinatally HIV-infected infants have a higherrisk of mortality and disease progression [5]. Early diagnosisof HIV infection and early initiation of ART improves theoutcomes of infants and children [33]. Although early infant diagnosis of HIV is critical, there are still challenges inresource limited settings to diagnose children. Childrenwho are missed by the PMTCT programs are at highestrisk of mortality because they usually present to the hospitalafter an illness when they are already immunocompromisedwith high risk of mortality [34].
Mutanga et al. BMC Public Health(2019) 19:115Page 8 of 12Table 4 Mortality among children receiving ART at Livingstone Central Hospital, (2003–2015)Duration of cARTNumber of children leftDeathsFollow-up years3 months9272924311.9 (7.6–16.3)6 months868414698.7 (6.0–11.41)1 year813498945.5 (3.9–7.1)2 years7026016463.6 (2.7–4.5)5 years3856632932.0 (1.5–2.5)10 years257144501.6 (1.4–1.8)We assessed the causes of death in our study but onlyfound death certificates for 27 children and no postmortem or thorough investigations had been done to ascertain cause of death. However, causes of death recordedon the few death certificates were similar to the causesof childhood deaths in Zambia, which are diarrhea, severe pneumonia and protein energy malnutrition [35].This setting has a very high infant mortality rate (65/1000 in 2015) [36]. In the pre-ART era, AIDS relateddeaths led to an increase in infant mortality in high HIVburden countries. Antiretroviral therapy improved childsurvival and evidence is now showing that early initiation of ART leads to better clinical outcomes [33]. In astudy that pooled results of clinical trial data fromZimbabwe and Uganda, the mortality risk was attributedto pre-ART risks that persist until the antiretroviraldrugs reach their maximal effectiveness [27]. These earlyMortality Rate, deaths per 100 person-years (95% CI)deaths have been attributed to suboptimal managementof malnutrition, Tuberculosis and other related medicalconditions during the early treatment stage includingImmune Reconstitution Syndrome (IRIS) [11]. However,the role of IRIS in mortality during the early months oftreating HIV seropositive children with ART is poorlyunderstood [37]. Our study had insufficient evidence tosupport the role of IRIS as a risk factor of earlymortality.The major strength of our study is that it was done ina routine clinic setting among children commencingART in a high HIV burden setting. This provides areal-world effectiveness of pediatric HIV treatment outcomes and provides information on important predictorsof mortality. Our sample size was large and we hadenough outcomes to make reasonable conclusions.Fig. 3 KM Survival plot of time to death after ART initiation: Livingstone Central Hospital, Zambia (2003–2015)
Mutanga et al. BMC Public Health(2019) 19:115Page 9 of 12Table 5 Sensitivity analysis - effect of bias due to loss to follow-up – worst case scenarioDuration of cARTNumber of children leftDeathsFollow-up yearsMortality Rate, deaths per100 person-years (95% CI)3 months9563624814.5 (9.7–19.2)6 months9016847814.2 (10.8–17.6)1 year82210690811.6 (9.4–13.9)2 years71014516728.7 (7.2–10.8)5 years38720033266.0 (5.1–6.9)10 years2522942255.4 (4.7–6.1))We assumed that all the patients who were lost to follow-up survived for 90 days after their last clinical visit then diedA major limitation is that there was a high proportionof loss to follow-up (16%) and many transfers (20%).This made ascertainment of mortality very cha
Long-term survival outcomes of HIV infected children receiving antiretroviral therapy: an observational study from Zambia (2003–2015) Jane N. Mutanga1,2,6*, Simon Mutembo2,3,6, Amara E. Ezeamama4, Xiao Song2, Robert C. Fubisha1, Kunda Mutesu-Kapembwa1, Derrick Sialondwe1