Transcription
RAYONG OIL SPILL CLEANUP WORKERSEXPOSURE AND SYMPTOM ASSESSMENTbyThammasin Ingviya, MD, MHSA dissertation submitted to Johns Hopkins University in conformity with therequirements for the degree of Doctor of PhilosophyBaltimore, MarylandOctober, 2017 2017 Thammasin IngviyaAll Rights Reserved
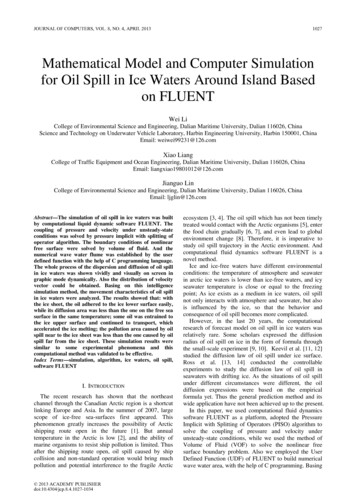
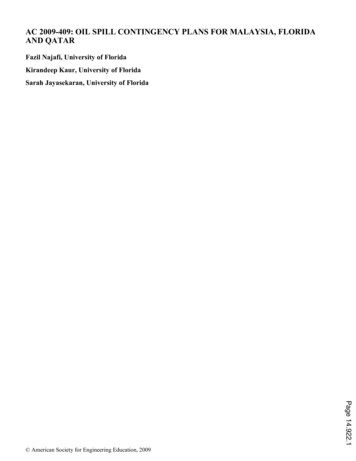
ABSTRACTIn July of 2013, a pipeline connecting an offshore oil platform to a tanker, operated by PTTGlobal Chemical (PTTGC), a corporation owned by the government of Thailand, leaked and causedcrude oil to spill into the Sea of Rayong off the coast of Thailand. The crude oil covered an areaof approximately 20 square kilometers and washed ashore on the island of Samet in an area called“Ao Prao” on 28 July, 2013. On-land cleanup lasted about a month and was performed by acombination of territorial defense volunteers, citizen volunteers, Thai military personnel andPTTGC employees. Cleanup procedures included oil containment and dispersal using absorbentpads, and removal and disposal of contaminated soil, sand and rocks. The goal of this dissertationis to determine if Rayong oil spill cleanup workers were exposed to elevated levels of PAHs andbenzene and if these exposures are associated with recorded acute symptoms.We measured the concentration of 1-hydroxypyrene-glucuronide (1-OHPG), a metaboliteof pyrene, in the 1,343 frozen stored urine samples available from the cleanup workers, andretrieved previously measured trans,trans-muconic acid (t,t-MA) data, a benzene metabolite. Thisallowed us to quantify the internal dose of polycyclic aromatic hydrocarbons (PAHs) and benzenein these workers and to examine factors related to their dose. During the early days of cleanup,urinary 1-OHPG of the workers was elevated, comparable to occupational exposures, and declinedto near background (general population) levels in workers by the end of the cleanup operation. Thiswas consistent with our hypothesis that the exposure levels of PAHs would be the highest in thefirst week of cleanup and decline thereafter. Detectable levels of t,t-MA also exhibited a decreasingtrend over the course of the cleanup period. Job descriptions with the highest levels of urinary 1OHPG after adjustment were oil dispersant applicators and contaminated sand/trash handlers.Prevalence of several post-shift symptoms, including irritation of throat and nose, increasedwith concentration of urinary 1-OHPG. Similarly, one group of symptoms determined by factoranalysis, designated as “irritative symptoms”, including irritation of the eye, throat and/or nose,ii
eye injection (redness) and excessive tearing (epiphora) was associated with increasedconcentration of urinary 1-OHPG.In conclusion, Rayong oil spill cleanup workers exhibited evidence of elevated levels ofPAH and benzene exposure during the early weeks of cleanup, compared to near background levels4 weeks after cleanup began. These workers also demonstrated an association between prevalenceof acute irritative symptoms and PAH exposure measured by urinary 1-OHPG. Long-term healthmonitoring of oil spill cleanup workers should be implemented, particularly among those workerssuspected of sustaining high exposure to crude oil.Thesis ReadersPaul T. Strickland, Ph.D.; Advisor; Department of Environmental Health and EngineeringEliseo Guallar, M.D.; Committee Chair; Department of EpidemiologyChristopher D. Heaney, Ph.D.; Department of Environmental Health and EngineeringMary A. Fox, Ph.D.; Department of Health Policy and Managementiii
PREFACEThis dissertation consists of five chapters. The first chapter is an introduction thatsummarizes the Rayong oil spill incident, the subsequent cleanup efforts, and the specific aims ofthis dissertation. Chapter 2 presents the rational for the dissertation based on literature reviews ofgeneral oil spill cleanup procedures and research, the Rayong oil spill details, the composition ofcrude oil, potential toxicants (PAHs and benzene) and confounding factors. Chapters 3 and 4 areorganized and presented in manuscript format. The first manuscript (Chapter 3) describes our studyto quantify internal dose of PAHs and benzene in the Rayong oil spill cleanup workers and toexamine factors related to their internal dose. In the second manuscript (Chapter 4), we examinedprevalence of post-shift acute symptoms among Rayong oil spill cleanup workers, and assessedtheir association with predictive factors, including internal dose biomarkers of PAH and benzeneexposure, day of cleanup worked, job description, PPE use, and age of workers. Lastly, Chapter 5summarizes our research conclusions according to the specific aims, public health implications,and suggestions for future research.iv
ACKNOWLEDGEMENTSThis dissertation is one of a greatest academic and research challenges I have faced untilnow. The study involves an oil spill incident that was one of the most important concerns of thestakeholders, the Thai Naval Medicine department, the Rayong local public health office, theRayong hospital and local citizens residing near the oil spill. This dissertation would never havebeen completed without the guidance and support from scientists at Johns Hopkins and in Thailand.First of all, I would like to express my deepest gratitude to my advisor, Dr. Paul TimothyStrickland for his thoughtful guidance and encouragement all these years since I started doing themaster’s degree in Environmental Health Science (MHS). Thank you for always being supportiveand giving invaluable advice to me. I am proud to be one of your PhD students and might be thelast one. I will continue my professional career based upon your guidance. I also would like topresent my warmest gratitude to Mr. Salahaddin Abubaker who taught me all the laboratorytechniques and treated me to lunch during my stressful times in the laboratory.I am also deeply indebted to my medical mentors in Thailand, Dr. Pitchaya Phaktongsukand Dr. Chanon Kongkamol, who introduced occupational medicine and epidemiology to me, gaveme the opportunity to be a medical faculty in the occupational health unit, and sincerely helped meto get financial and human support for this oil spill project, and the scholarship to study for the PhDat the Johns Hopkins Bloomberg School of Public Health. In addition, I would like to thank Dr.Pasuree Sangsupawanich who facilitated the approval from the Prince of Songkla University ethicscommittee and grants to support this dissertation.I would like to specially thank Ms. Chanthip Intawong for giving me full collaboration onthe project. She also gave me full and sincere support in providing and shipping the workers’ urinesamples, extracting the data, and timely answering my questions regarding the oil spill incident.I am also indebted to many people in Thailand. I sincerely thank Dr. Chantana Padungtodand Dr. Pronchai Sithisarakul for guidance and linking me to the Rayong oil spill network. I wouldv
pulike to thank Dr. Atipong Sujiratana and colleagues from Thai Naval Medicine department forproviding their insight and military personnel data.I would like to thank my thesis committee members, Dr. Ernst Spannhake, Dr. Peter Lees,Dr. Jacqueline Agnew, Dr. Kirsten Koehler, and Dr. Ana Navas-Acien for their insight on theproject. Also, I would like to thank the thesis readers and final oral exam committee members, Dr.Mary Fox, Dr. Christopher Heaney, Dr. Eliseo Guallar and Dr. Corinne Joshu.This dissertation and my PhD study would not be successful without the financial supportfrom Faculty of Medicine, Prince of Songkla University, and the Johns Hopkins Education andResearch Center (ERC) for Occupational Health and Safety pilot project grant (T42 OH008458).Finally, yet importantly, I would like to thank my parents for always supporting me topursue my professional career. There are many other people whose names are not here, however,this dissertation would not be complete without you.vi
TABLE OF CONTENTSABSTRACT . iiPREFACE. ivACKNOWLEDGEMENTS . vTABLE OF CONTENTS . viiLIST OF TABLES . ixLIST OF FIGURES . xiiiABBREVIATIONS . xvCHAPTER 1: INTRODUCTION . 1Specific Aims . 3CHAPTER 2: BACKGROUND . 4A. General Oil Spill Background and Research . 41. Size or Tiers of Oil Spills . 52. Oil Spill Effects . 73. Human Health Impacts . 94. Biomarkers of Crude Oil Exposure and Effect in Blood and Urine . 125. General Cleanup Procedures . 14B. Rayong Oil Spill Background . 181. Causes and Oil Spread . 182. Cleanup Procedures . 193. Previous Health Follow-up and Surveillance Plan . 214. Previous Studies from the Rayong Oil Spill. 24C. Crude Oil Composition, Potential Toxicants and Confounding Factors . 281. Polycyclic Aromatic Hydrocarbon (PAH) . 29vii
2. Benzene . 36CHAPTER 3: EXPOSURE ASSESSMENT OF RAYONG OIL SPILL CLEANUPWORKERS. 41Abstract . 41Introduction . 42Materials and Methods . 44Results. 54Discussion . 71CHAPTER 4: POST-SHIFT SYMPTOMS AMONG RAYONG OIL SPILL CLEANUPWORKERS . 77Abstract . 77Introduction . 79Materials and Methods . 81Results. 85Discussion . 106CHAPTER 5: CONCLUSIONS . 112Public Health Implication and Future Research . 118Summary . 121REFERENCES. 122APPENDICES . 143APPENDIX, CHAPTER 2 . 143Appendix 2.1: Laboratory Analysis of Urinary 1-OHPG. 143APPENDIX, CHAPTER 3.Tables. 144APPENDIX, CHAPTER 4.Tables. 152CURRICULUM VITAE . 165viii
LIST OF TABLESCHAPTER 2TABLE 2.1: List of 10 Largest Oil Spills by Volume (not related to war) and the Rayong OilSpill . 6TABLE 2.2: Oil Spill Incidents with Research Related to Human Health (by amount of spill) . 9TABLE 2.3: Demographic Factors of Cleanup Workers from Short Questionnaire . 24TABLE 2.4: Crude Oil Compositions. 28TABLE 2.5: Levels of PAH Exposure by Urinary 1-OHPG Concentration (pmol/ml) AmongSteel Plant Workers . 33CHAPTER 3TABLE 3.1: Multiple Samples from the Same Individuals Collected on Different Days ofCleanup. 47TABLE 3.2: Demographic Factors of Cleanup Workers . 47TABLE 3.3: Job Descriptions of Cleanup Workers . 48TABLE 3.4: Personal Protective Equipment Use of Workers . 49TABLE 3.5: Log-Linear Regression with GEE of Urinary 1-OHPG by Days of Cleanup . 58TABLE 3.6: Urinary 1-OHPG by Job Descriptions of Cleanup Workers (Descending Order byGeometric Mean of 1-OHPG) . 60TABLE 3.7: Log-Linear Regression with GEE of Urinary 1-OHPG by Job Descriptions . 62TABLE 3.8: Log-Linear Regression with GEE of Urinary 1-OHPG by PPE Use . 63TABLE 3.9: Logistic Regression with GEE of Detectable t,t-MA by Days of Cleanup (NonSmokers: Cotinine 50 ng/ml) . 68TABLE 3.10: Urinary t,t-MA Detectable Percentages by Job Description . 69ix
TABLE 3.11: Logistic Regression with GEE of Detectable t,t-MA by Job Description (SubgroupNonsmokers) . 70CHAPTER 4TABLE 4.1: Prevalence of 23 self-reported symptoms . 86TABLE 4.2: Prevalence of Symptoms by Days of Cleanup . 87TABLE 4.3: Prevalence of Post-Shift Symptoms Stratified by Age . 91TABLE 4.4: Prevalence of Post-Shift Symptoms by Job Description. 96TABLE 4.5: Unadjusted Odds Ratio of Post-Shift Symptoms by Job description . 97TABLE 4.6: Adjusted Odds Ratio of Post-Shift Symptoms by PPE use. 99TABLE 4.7: Groups of Symptoms Determined by Factor Analysis . 100TABLE 4.8: Adjusted Odds Ratio of Symptom Groups (per 1 pmol/ml increase in 1-OHPG) fromOrdinal Logistic Regression and Factor Analysis . 102TABLE 4.9: Adjusted Odds Ratio of Symptom Groups (by detectable vs non-detectable t,t-MA)from Ordinal Logistic Regression and Factor Analysis . 103TABLE 4.10: Adjusted Odds Ratio of Symptom Groups by Job Descriptions from SimpleLogistic Regression and Factor Analysis . 104TABLE 4.11: Adjusted Odds Ratio of Symptom Groups by PPE Use from Ordinal LogisticRegression and Factor Analysis . 105APPENDICES, CHAPTER 3 . 144APPENDIX TABLE 3.1: Urinary 1-OHPG in Oil Spill Workers by Day of Work, CotinineConcentration, and Demographic Factors . 144APPENDIX TABLE 3.2: Urinary 1-OHPG in Oil Spill Workers by Days of Cleanup Stratified bySmoking Status (Based on Cotinine Concentration of 50 ng/ml) . 145APPENDIX TABLE 3.3: Urinary 1-OHPG by Personal Protective Equipment (PPE) Use . 146x
APPENDIX TABLE 3.4: Urinary t,t-MA Detectable in Oil Spill Workers by Day of Work,Cotinine Concentration, and Demographic Factors . 147APPENDIX TABLE 3.5: Urinary t,t-MA Detectable in Oil Spill Workers by Day of WorkStratified by Smoking Status (Based on Cotinine Concentration of 50 ng/ml) . 148APPENDIX TABLE 3.6: Urinary t,t-MA Detectable in Oil Spill Workers by Job DescriptionStratified by Smoking Status (Based on Cotinine Concentration of 50 ng/ml) . 149APPENDIX TABLE 3.7: Urinary t,t-MA Detectable in Oil Spill Workers by Personal ProtectiveEquipment (PPE) Use. 150APPENDIX TABLE 3.8: Logistic Regression with GEE of Detectable t,t-MA by PersonalProtective Equipment (PPE) Use . 151APPENDICES, CHAPTER 4 . 152APPENDIX TABLE 4.1: Prevalence of Post-Shift Symptoms by Cotinine Levels . 152APPENDIX TABLE 4.2: Demographic Factors by Background Occupation. 153APPENDIX TABLE 4.3: Adjusted Odds Ratio of Post-Shift Symptoms (per 1 pmol/ml increasein 1-OHPG) . 154APPENDIX TABLE 4.4: Adjusted Odds Ratio of Post-Shift Symptoms, Further Adjusting forAge (per 1 pmol/ml increase in 1-OHPG) . 155APPENDIX TABLE 4.5: Prevalence of Post-Shift Symptoms by Detectable t,t-MA . 156APPENDIX TABLE 4.6: Adjusted Odds Ratio of Post-Shift Symptoms by Detectable t,t-MA. 157APPENDIX TABLE 4.7: Adjusted Odds Ratio of Post-Shift Symptoms by Detectable t,t-MA,Further Adjusting for Age of Workers . 158APPENDIX TABLE 4.8: Demographic Factors by Job Descriptions . 159APPENDIX TABLE 4.9: Unadjusted Odds Ratio of Post-Shift Symptoms by Job Descriptions. 160xi
APPENDIX TABLE 4.10: Adjusted Odds Ratio of Post-Shift Symptoms by Job Descriptions,Further Adjusting for Age of Workers . 161APPENDIX TABLE 4.11: Unadjusted Odds Ratio of Symptom Groups by Job Descriptions fromSimple Logistic Regression and Factor Analysis . 162APPENDIX TABLE 4.12: Distributions of Post-Shift Symptoms by Background Occupation. 163APPENDIX TABLE 4.13: Adjusted Odds Ratio of Post-Shift Symptoms by BackgroundOccupation . 164xii
LIST OF FIGURESCHAPTER 2FIGURE 2.1: Trend in Number of Oil Spill Studies related to Human Health . 10FIGURE 2.2: Containment Boom. 15FIGURE 2.3: Pumping Skimmers . 16FIGURE 2.4: Adsorbing Skimmers . 16FIGURE 2.5: Oil Spill Cleanup by Manual Removal . 17FIGURE 2.6: Satellite Photograph of Oil Spill Off the Coast of Rayong Province, Thailand, AfterContaminating Beaches at Ao Prao Bay (29 July, 2013) . 19FIGURE 2.7: On-Land Cleanup of Rayong Oil Spill, 30 July 2013 . 20FIGURE 2.8: Transferring of Oil Contaminated Debris by Landing Craft and HTMS Angthong(From Thai Naval Medicine) . 21FIGURE 2.9: Rayong Oil Spill Cleanup Sequence of Events (27 July 2013 – 26 August 2013). 22FIGURE 2.10: Venn Diagram Summarizing Worker Population with Urine Samples and BloodSamples . 23FIGURE 2.11: Percentage of Workers with Reported Symptoms by Organ Systems . 25FIGURE 2.12: Structures and Nomenclature of 16 PAHs and Their IARC Classifications . 30FIGURE 2.13: Metabolism of Pyrene and Formation of 1-OHPG . 32FIGURE 2.14: Synchronous Fluorescence Spectroscopy (SFS) of Immunopurified Urine Samplesfrom Subjects with or without Recent Exposure to PAHs . 34FIGURE 2.15: Metabolic Pathways for Benzene . 38xiii
CHAPTER 3FIGURE 3.1: Flow Chart Summarizing Urine Sample Selection and Analyses . 45FIGURE 3.2: Rayong Oil Spill Cleanup Study (27 July 2013 – 26 August 2013) . 46FIGURE 3.3: Scatter Plot Illustrating Differences in Urinary Creatinine Levels betweenStrickland’s (X-axis) and Rayong’s (Y-axis) Laboratory . 51FIGURE 3.4: Laboratory Results of Urinary 1-OHPG. 54FIGURE 3.5: Urinary 1-OHPG (Logscale) by Days of Cleanup. 55FIGURE 3.6: Strata of Urinary 1-OHPG by Days of Cleanup . 56FIGURE 3.7: Urinary 1-OHPG (Logscale) by Quartiles of Cotinine . 56FIGURE 3.8: Urinary 1-OHPG (Logscale) by Days of Cleanup in Smokers and Nonsmokers . 57FIGURE 3.9: Urinary 1-OHPG (Logscale) by Job (Descending Order by Median of 1-OHPG) 61FIGURE 3.10: Urinary t,t-MA Results from Rayong Hospital . 64FIGURE 3.11: Percentage Detectable t,t-MA by Days of Cleanup. 65FIGURE 3.12: Urinary t,t-MA Detectable Percentages by Cotinine Quartiles . 66FIGURE 3.13: Urinary t,t-MA Detectable Percentages by Days of Cleanup in Smokers andNonsmokers . 67CHAPTER 4FIGURE 4.1: Rayong Oil Spill Cleanup Study (27 July 2013 – 26 August 2013) . 82FIGURE 4.2: Prevalence of Post-Shift Symptoms by Cotinine Levels . 89FIGURE 4.3: Adjusted Odds Ratio of Post-Shift Symptoms . 93FIGURE 4.4: Adjusted Odds Ratio of Post-Shift Symptoms by Detectable t,t-MA . 94FIGURE 4.5: Factor Analysis Diagram showing the EFA results (Correlation coefficients) of 23Post-Shift Symptoms . 101xiv
dG8-Hydroxy-2'–DeoxyguanosineADHAlcohol DehydrogenaseALDHAldehyde DehydrogenaseALTAlanine AminotransferaseAMLAcute Myelogenous LeukemiaANLLAcute Nonlymphocytic LeukemiaBP Oil SpillDeepwater Horizon Oil SpillCBCComplete Blood CountCES-DCenter for Epidemiologic Studies DepressionCOXCyclooxygenaseCYPCytochrome P450DHDDDihydrodiol DehydrogenaseDNADeoxyribonucleic AcidEHEpoxide HydrolaseEFAExploratory Factor AnalysisERODEthoxyresorufin-O-de-ethylaseFEFForced Expiratory FlowFEV1Forced Expiratory Volume in the First SecondFVCForced Vital CapacityGADGeneralized Anxiety DisorderGCGas ChromatographyGEEGeneralized Estimating EquationGSHGlutathioneHPLCHigh-Performance Liquid Chromatographyxv
IARCInternational Agency for Research on CancerIQRInterquartile RangeLOXLipoxygenaseLTBLeukotriene eMRMinimal ResidualsNQO1NAD(P)H Quinone OxidoreductaseOSHAOccupational Safety and Health AdministrationPAHPolycyclic Aromatic HydrocarbonPBSPhosphate Buffered NaClPDSPosttraumatic Diagnostic ScalePEFPeak Expiratory FlowPGProstaglandinePM-10Particulate Matter 10 Micrometers or Less in DiameterPPEPersonal Protective EquipmentPWIPsychological Well-Being IndexSCL-36Symptom Checklist-36SCL-90-RSymptom Checklist-90-RevisionSGPTSerum Glutamic-Pyruvic TransaminaseSTAI-X-1State-Trait Anxiety Inventoryt,t-MAtrans,trans-Muconic AcidUMEUnusual Mortality EventsUSDUnited States Dollar (US Dollar)VOCVolatile Organic Compoundxvi
CHAPTER 1: INTRODUCTIONOn 27 July, 2013, the pipeline connecting an offshore oil platform to a tanker, operated byPTT Global Chemical (PTTGC), a corporation owned by the government of Thailand, leaked andcaused crude oil to spill into the sea of Rayong off the coast of Thailand. The crude oil covered anarea of approximately 20 square kilometers and washed ashore on the island of Samet in an areacalled “Ao Prao” on 29-31 July, 2013.1, 2 Although PTTGC estimated that the amount of oil spilledwas about 50 cubic meters or 336 barrels,2 other experts believe the true volume to be as high as190 cubic meters or 1,200 barrels.3Clean-up procedures began at Ao Prao on 29 July, 2013 and ended a month later on 30August, 2013.1 These procedures included containing, skimming, and dispersing the oil slick, usingabsorbent pads on land, and digging up and disposing of contaminated soil, sand and rocks. Theon-land cleanup was performed by a combination of territorial defense volunteers, citizenvolunteers, military soldiers and PTTGC workers.3Crude oil is a complex mixture of hydrocarbons, some of which may affect human health,including volatile organic compounds (VOCs), such as benzene and naphthalene, and polycyclicaromatic hydrocarbons (PAHs), such as pyrene and benzo[a]pyrene.4 The International Agencyfor Research on Cancer (IARC) has classified benzene and benzo[a]pyrene as group 1 carcinogens,5known to cause cancer in humans.The Rayong Provincial Public Health Office and Rayong Hospital designed a healthsurveillance plan for the workers, collecting urine samples post-shift to assess urinary tran,tranmuconic acid (t,t-MA), a metabolite of benzene. However, given the lack of smoking status6 dataand confounding effects of smoking on urinary t,t-MA concentration,7 we believe these exposureestimates should be re-examined and expanded to include estimates of PAH exposure and a tobaccobiomarker (cotinine).8In addition, acute symptoms including respiratory symptoms and irritation symptoms wereobserved and recorded in health survey questionnaires administered after worker’s shifts – even in1
workers with urinary t,t-MA levels below 500 ug/gCr (OSHA Standard).9 About 1,343 left-overurine samples from the Rayong Hospital’s analysis were stored at -30o Celsius as part of the originalsurveillance plan, however, government funding was suspended and there was no plan for furtheruse of these samples. Subsequently, the urine samples, packed in dry-ice were shipp
general oil spill cleanup procedures and research, the Rayong oil spill details, the composition of crude oil, potential toxicants (PAHs and benzene) and confounding factors. Chapters 3 and 4 are organized and presented in manuscript format. The first manuscript (Chapter 3) describes our study