Transcription
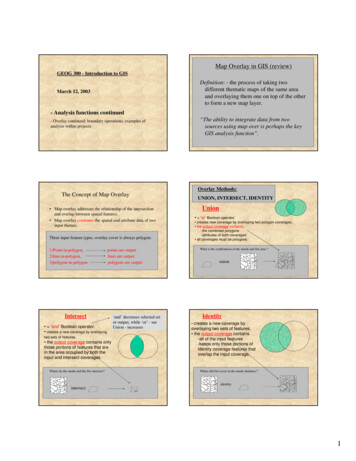
Map Overlay in GIS (review)GEOG 300 - Introduction to GISDefinition: - the process of taking twodifferent thematic maps of the same areaand overlaying them one on top of the otherto form a new map layer.March 12, 2003- Analysis functions continued- Overlay continued; boundary operations; examples ofanalysis within projects“The ability to integrate data from twosources using map over is perhaps the keyGIS analysis function”.Overlay Methods:The Concept of Map Overlay Map overlay addresses the relationship of the intersectionand overlap between spatial features. Map overlay combines the spatial and attribute data of twoinput themes.Three input feature types, overlay cover is always ygon-in-polygonpoints are outputlines are outputpolygons are outputIntersect ‘and’ Boolean operator. creates a new coverage by overlayingtwo sets of features. the output coverage contains onlythose portions of features that arein the area occupied by both theinput and intersect coverages.Where do the stands and the fire intersect?‘and’ decreases selected setor output, while ‘or’ - seeUnion - increasesUNION, INTERSECT, IDENTITYUnion “or” Boolean operator. creates new coverage by overlaying two polygon coverages. the output coverage contains;-the combined polygons-attributes of both coverages all coverages must be polygonsWhat is the combination of the stands and fire area ?unionIdentity createsa new coverage byoverlaying two sets of features. the output coverage contains-all of the input features-keeps only those portions ofidentity coverage features thatoverlap the input coverage.Where did fire occur in the stands database ?identityintersect1
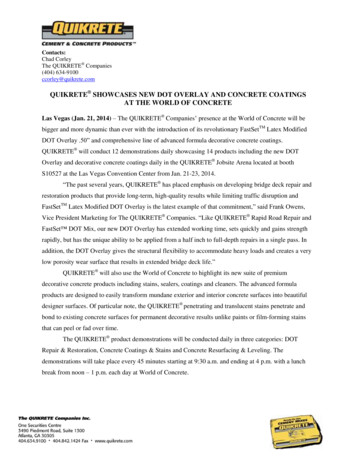
Different Ways of Looking at PolygonOverlay - illustrations1. Bolean Overlay (exclusionary variables and,or)- illustration of different ways topose question that will result in sameoutcome2. Mathematically based overlay - wheresome input factors may be weightedmore than othersINTERSECT is .UNION is .ORANDExample that follows: how one might use UNION orINTERSECT to identify land parcels that are suitable fordevelopment . Two ways of asking .1) Where are areas where development cannot occur (UNION)?2) Where are areas where development can occur (INTERSECT)?Bolean (Logical) Overlay Process - Potential for Urban DevelopmentConditionsAreas wheredevelopmentnot possible Two approaches:EndangeredSpecies1) endangeredsp. Habitat;Prime Agricultural2) primeagriculturalland;3) federal landeg nationalparkUnion(VS)IntersectNo PotentialIFEndangered SpporPrime Ag LandorFed LandGood PotentialIFNot Endangered SppandNot Prime Ag LandandNot Fed LandNo lLandAnother example also includes looking at weightedoverlay‘Problem statement’ -Identify areas where it is possible for housing developmentto occur.Criteria:1) areas of lower slope are better than areas with steeper slope2) must be outside of riparian zone by at least 1 mile3) areas of greater distance from incinerator are better thancloser areasCreation of input coverages to model reflects criteria:Creation of input coverages to model reflects criteria:SLOPE - criteria 1- areas oflower slope better than areasof higher slopeRIPARIAN AREAS - criteria 2 - housing must be outsideof riparian zones by 1 mileCreate slopecoverage,RECLASSIFYvalues to createslope classes .tinarcTRIM twtrriparianreselectbufferPOLYGONTin1withFor purposes of model Higher class values reflectmore desirable land:30Percent slopeClassSlopeValue1 15%3216 - 30% 13 30%0Reselect andreclassify values101For purposes of model -Higherclass values reflect moredesirable land:0ClassRiparian Value1No12Yes02
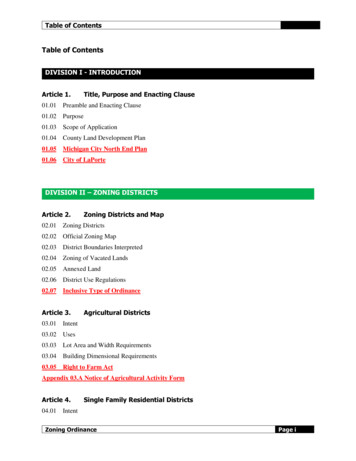
Creation of input coverages to model reflects criteria:UNION all resultant coverages (keeps all input features)Distance to incinerator - criteria 3 - areas greater distanceare favoured over areas lect andreclassify valuesUnion1union3For purposes of model -Higherclass values reflect moredesirable land:310ClassDistance Value1 1 miles021.1 - 213 230OR1093301IncineratorMATHEMATICAL OPERATION25741354 530030031union ADDITION10RiparianMULTIPLICATIONInterpreting the results 01Some references of interest (2):Jensen, John R., Sunil Narumalani, Oliver Weatherbee, and Keith S. MorrisJr. 1992. “Predictive Modeling of Cattail and Waterlily Distribution in aSouth Carolina Reservoir Using GIS.” Photogrammetric Engineering &Remote Sensing. Vol. 58 (11), pp. 1561- 68.Mladenoff, D.J., T.A. Sickley, R.G. Haight, and A.P. Wydeyen. 1995. “Aregional landscape analysis and prediction of favorable gray wolf habitat inthe Northern Great Lakes region.” Conservation Biology. Vol. 9(2), pp. 279- 294.Pereira, J.M.C. and R.M. Itami. 1991. “GIS-based habitat modeling usinglogistic multiple regression: A study of the Mt. Graham red squirrel.”Photogrammetric Engineering & Remote Sensing. Vol. 57 (11), pp. 14751486.Some references of interest (1):Agee, J.K., S.C.F. Stitt, M. Nyquist, and R. Root. 1989. “A geographicanalysis of historical grizzly bear sighting in the north cascades.”Photogrammetric Engineering & Remote Sensing. Vol. 55 (11), pp. 1637- 42.Bian, Ling and Eric West. 1997. “GIS Modeling of Elk Calving Habitatin a Prairie Environment with Statistics.” Photogrammetric Engineering& Remote Sensing. Vol. 63 (2), pp. 161 - 7.Breininger, D.R., M.J. Provancha, and R.B. Smith. 1991. “MappingFlorida scrub jay habitat for purposes of land-use management.”Photogrammetric Engineering & Remote Sensing. Vol. 57 (11), pp. 1467- 74.Clark, J.D., J.E. Dunn, and K.G. Smith. 1993. “A multivariate model offemale black b0ear habitat use for a geographic information system.”Journal of Wildlife Management. Vol. 57 (3), pp. 519 - 57.Problems in Map Overlay Remember Themes to be overlaid must be spatiallyregistered before the overlay process (quality control inpre-process). Digitizing errors can cause slivers. Propagation of errors: errors will accumulate during themap overlay process (ie something is coded incorrectly inattribute table) Processing creates many polygons Consider othercommands, CLIP, ERASE, SPLIT, MERGE, DISSOLVE,etc., as essential part of post-processing . ‘Boundaryoperations’3
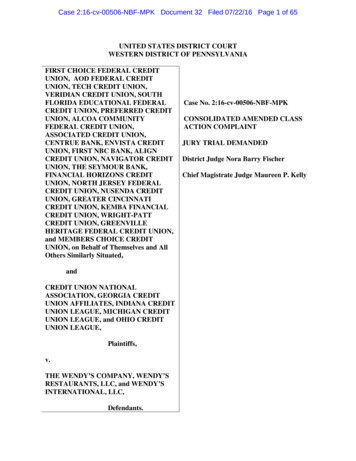
EliminateFirst, Slivers (review) Slivers may occur as a result of imperfect digitization ofspatial features (review); can also be created during Overlay -- unions, etc. In some cases, slivers can be eliminated by selecting onlythose features that have a large size; minimum mapping unit. Use ELIMINATE command at the arc level Merges selected polygons with neighboring polygonsthat have the largest shared border between them, orthat have the largest area. Uses same kind of syntax as the Arc:reselect command,with a prompt for a logical expression. Output is newcoverage Most often used to remove ‘sliver’ polygons, but can beused to combine polygons, by ‘absorbing’one type byanother ‘type’ .eg. ARC: ELIMINATE CARVEGE VEGE2: resel veg type ‘Mesophyll Vine Forest’The 5 vine forest polygons (dark blue wide stripes) have been merged withthose neighbouring polygons with the greatest shared boundary - perhapsthis vegetation type, for purposes of analysis, was better combined withneighbouring vegetation types.Boundary Operations - Coverage Manipulation Dissolve merges adjacent polygons, lines or regionswhich have the same value for a specified item.- In the case of a polygon coverage, it removes arcsbetween polygons containing equal values for thedissolve item. In the case of arcs, nodes betweenarcs are removed. DISSOLVE is used to create a simplified coverage fromone which is more complex. While the input coveragemay contain information concerning many featureattributes, the output coverage contains information onlyabout the dissolve item.Boundary Operations - Coverage ManipulationMap Coverage Manipulation Dissolve– Removes boundaries between polygons thathave the same value of a selected attribute.CLIP extracts a subregion of a coverage that intersects with a secondcoverage, called a clip coverage the features of the input coverage, but not the clip coverage, are retained therefore the feature attribute table for the output coverage contains thesame items as the input coverage attribute table. topology is rebuilt for the output coverage input features can be polygons, lines or points. Clip cover must be a polygon coverage. the output coverage has the same feature type as the input coverage.4
Clip - 2Map Coverage Manipulationclip theme(Upper Salmon River Watershed) ClipUnit of interest isone watershedstepsCreate clip coverage (must bepolygon) in arcedit by digitzingpolygon around watershed (followheight of land ?)– Includes only thosefeatures of the inputtheme that are withinthe spatial extent ofthe clip theme.input theme(Idaho counties)result(watershed divided into counties)ERASE is very similar to Clip, except that the input coveragefeatures that overlap with the erase coverage polygons areerased rather than preserved.Desired output fordata management,analysis and displayCLIP - arc command whichrequires using ‘clip’ coverage(boundary of interest) andcoverage where features stored to output new featurecoverage containing only subsetof interestMap Coverage Manipulation Erase coverage- removes part of the inside of a coverage Again, the input coverage features can be polygons, lines, orpoints; but erase coverage features must be polygons. Output coverage features are of the same class as the inputcoverage features.The boundary of an existingcoverage is used to erasefeatures from anothercoverage and create a newcoverage. Erase coverage -2- this may be used as part of buffer analysis stepsCriteria requires that housing is outside of streams, but within a setdistance of sewer lines (black background chosen to show difference).SewerlinestreamsContinued .Use erasecov to delineate areas that are outside ofstreams, but within specified distance of sewer lines .You may createbuffer polygonsaround streamsand sewer linesas first step .Output contains only areameeting both stipulationsfrom above5
Map Coverage Manipulation Merge– Creates a new theme by piecing together two or morethemes;– however, the boundaries between the themes remainintact.Single themeSeparate themesSnake River Plain AquiferIdaho counties6
theme that are within the spatial extent of the clip theme. clip theme (Upper Salmon River Watershed) input theme (Idaho counties) result (watershed divided into counties) Clip - 2 Unit of interest is one watershed Desired output for data management, analysis and display steps Create clip coverage (must be polygon) in arcedit by digitzing