Transcription
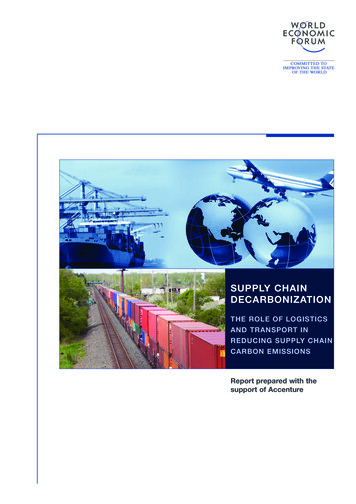
SUPPLY CHAINDECARBONIZATIONTHE ROLE OF LOGISTICSAND TRANSPORT INREDUCING SUPPLY CHAINCARBON EMISSIONSReport prepared with thesupport of Accenture
Supply Chain Decarbonization was produced inJanuary 2009 by the World Economic Forum,within the framework of the Logistics andTransport Partnership Programme.World Economic ForumGenevaCopyright 2009The significant contribution of Accenture isgratefully acknowledged.EDITORSSean DohertyAssociate DirectorHead of Logistics & Transport Industry GroupWorld Economic ForumSeb HoyleManagerSustainable Supply ChainAccentureEdgar UribeLead, Corporate Environment ActivitiesKuehne & NagelPROJECT ADVISORDavid Simchi-LeviCo-Director, Supply Chain Innovation ForumMassachusetts Institute of TechnologyNarendra MulaniPartnerGlobal Head of Supply Chain ManagementAccentureYossi SheffiProfessor of Engineering SystemsMassachusetts Institute of TechnologyCONSULTATIVE GROUPChristopher LoganHead of Strategy (Global)AgilitySamuel SidiqiDirector of Strategy (Europe)AgilitySupply Chain DecarbonizationRod FranklinVice President, Product DevelopmentKuehne & NagelRaji HattarChief Projects OfficerAramex InternationalAdrian DickinsonScientific AdviserDHL Neutral ServicesMartin AndersonGlobal Director of Safety & EnvironmentDP WorldCharles HaineManager, Global Environment, GSEDP WorldWinfried HaeserDirector, Environmental Reporting and PolicyDPWNLynsey MacIverHead of EnvironmentPanalpinaToon TessierChief Advisor Environmental PolicyPort of AntwerpJohan RoosDirector, EnvironmentStena ABRob RijkEnvironmental ManagerTNTRuben van DoornManager, CEOs OfficeTNTDavid GuernseySenior Sustainability Program ManagerUPSMark van der HorstDirector EU AffairsUPSAny errors in this review are the responsibility of the authors. The views expressed are not necessarilythose of the consultative group, the World Economic Forum or its partner companies.2
Patrick BrowneSustainability Program ManagerUPSAntonia GawelGHG ProtocolWBCSDJohn MoavenzadehSenior Director, Head of Sustainable MobilityWorld Economic ForumRandall KrantzAssociate Director, Environment InitiativesWorld Economic ForumSupply Chain DecarbonizationAndrea BrownGHG ProtocolWBCSD3
Executive SummarySignificant movement is expected towardsreduced supply chain carbon intensity. This willcreate both opportunities and risks for logisticsand transport firms, with changes in supply anddemand driven by:Regulation of carbon emissionsHigher and more volatile fuel pricesEvolving consumer and client demandThe sector can play an influential role indecarbonization, both in its own operations andthrough broader supply chain optimisation. Thisprovides direct benefits through reduced costs,managed risks and business BuildingsOcean Air FreightFreightRoadFreight1,5001,000500Total Mobility Emissions: 2,500 Mega Tonnes CO2eGHG Emissions (mega-tonnes CO2e per year)Supply Chain DecarbonizationHuman activity generates annual greenhouse gasemissions of around 50,000 mega-tonnes CO2e.We estimate that 2,800 mega-tonnes – or 5.5% ofthe total – are contributed by the logistics andtransport sector.0Logistics and Transport ActivityKey to supply-chain-wide decarbonization is anunderstanding of CO2 emissions across thesystem. Corporate-level reporting, guided by thewidely-used Greenhouse Gas Protocol, is aspreading reality. Product level foot-printing is animportant step towards supply chain carbonrationalisation. It has been given a boost by theagreement of the first standards.Supply Chain DecarbonizationOpportunitiesAround 60% of this potential carbon abatementoriginates from the sector‟s own emissions.Others come from the broader supply chain andcan be achieved through changed logistics andtransport configurations:PotentialAbatementMt CO2eAssessedIndex ofFeasibilityClean Vehicle TechnologiesDespeeding the Supply ChainEnabling Low CarbonSourcing: AgricultureOptimised NetworksEnergy Efficient BuildingsPackaging Design InitiativesEnabling Low CarbonSourcing: ghHigh152MediumTraining and Communication117MediumModal y Chain DecarbonizationOpportunitiesReverse Logistics / RecyclingNearshoringIncreased Home DeliveryReducing CongestionRecommendationsLogistics and Transport ProvidersAdopt new technologies industry-wideImprove training and communicationindustry-wideSwitch modes where possibleDevelop recycling offeringsDevelop home delivery offeringsPromote carbon offsetting of shipmentsShippers and BuyersUnderstand and reduce carbon impact ofmanufacturing through alternative sourcingPlan to allow slower and better optimisedtransportReduce packaging materialsWork on product carbon labelling,standards, auditing tools, and useIncrease shared loadingPolicy MakersReflect cost of carbon in energy tariffsSupport carbon measurement and labellingstandardsBuild open carbon trading systemsInvest in infrastructure and flowmanagementFacilitate recycling along the supply chainEncourage retrofitting of buildings to betterenvironmental levelsCommercially viable decarbonizationopportunities which could be enabled by thelogistics and transport industry are of the order of1,400 mega-tonnes CO2e in the medium term.4
ContentsExecutive Summary. 4The Need for a Review . 5Understanding Supply Chain Decarbonization 5Context of Decarbonization . 6Regulation of Carbon Emissions . 6The Need for a ReviewTo date, logistics and transport companies havemostly taken a tactical and internal view of supplychain decarbonization. This has resulted inimportant, but nevertheless small scale,responses to climate change. Point solutionshave included increased use of battery poweredtrucks, automated scheduling applications andgreen building technologies.Response to Higher and More Volatile FuelPrices . 6Evolving Consumer and Client Demand . 6Logistics Sector Response . 6Objectives and Approach . 7Objectives . 7The need to look more strategically at the end-toend supply chain, encompassing all aspects ofthe product life cycle from raw material todisposal, is now being evidenced. Across sectors,firms and policy makers have spoken of therequirement to consider the total product lifecycleimpact of carbon, before optimising acrossboundaries.Approach . 7Findings . 8Logistics and Transport Sector CarbonFootprint . 8Near-term economic uncertainty has changed theimmediate outlook for the logistics and transportsector. Nonetheless, even in this operatingenvironment, the underlying business imperativesfor supply chain decarbonization remain valid.Total Supply Chain Carbon Footprint . 9Pressures for a Shift to Decarbonization . 10Supply Chain Decarbonization Framework . 12Understanding Supply ChainDecarbonizationMain Opportunities for Decarbonization . 12Summary of the Main Opportunities forDecarbonization . 14Overview of the Scorecards . 15Supply Chain DecarbonizationRecommendations . 29Logistics and Transportation Providers . 29Shippers and Buyers . 29Policy Makers . 30This report is constructed from the viewpoint ofthe world‟s largest logistics and transport firms,capturing the commitment of the sector to be atthe heart of supply chain decarbonization efforts.We provide both a contextual and an initialquantitative assessment of the supply chaindecarbonization challenge. It looks at likelyopportunities for abatement, purposefully pushingthe boundaries of current knowledge seeking toclarify controversial topics.Conclusions . 31Annexes . 32Annex 1: Definition of Key Terms. 32Annex 3: Further Reading . 40Communicating the findings through a series ofaccessible scorecards, we take a first steptowards assessing the scale and feasibility ofpotential emission abatement options across thesupply chain.Annex 4: List of Industry Partners . 40Contact Information . 41Overall, we aim to move the global dialogueforward and to help carriers and buyers alike to:Take practical and cost-effective stepstowards decarbonization strategiesAnticipate external drivers for change – whichmay have significant effects on the long-termdemand for freight5
Context of DecarbonizationOf humanity‟s 50,000 mega-tonnes of annualCO2e greenhouse gas emissions, around 2,800mega-tonnes can be assigned to logistics andtransport activities.Though there is significant uncertainty in thefigures, it seems possible that significantemissions reductions could be achieved in themedium term1 by implementing changethroughout the end-to-end supply chain. Thiscould be primarily achieved through wideradoption of available technologies, leveragingnew commercial relationships and developingnew business strategies.The conditions required to enable these changesare being created. We see three developmentsproviding the necessary business environment forimplementation.Those three fundamental drivers of change are:Regulation of Carbon EmissionsResponse to Higher and More VolatileFuel PricesEvolving Consumer and Client DemandSupply Chain DecarbonizationRegulation of Carbon EmissionsSupply chain carbon emissions will increasinglybe regulated through a variety of legal standardsas numerous policy developments are underway.By December 2009, the 192 member countries ofthe United Nations Framework Convention onClimate Change have agreed to launch amechanism to achieve “deep cuts” in emissions2.Independent targets in developed nations call forsignificant cuts in emissions – the EuropeanUnion‟s Energy Policy calls for a 20% reduction ingreenhouse gas emissions by 20203 whileCalifornia‟s AB 32 „Global Warming Solutions Act‟seeks state-wide emissions reductions of 25% by20203. The UK Climate Change Act mandates an80% cut in national carbon emissions by 20503.There is increasing convergence in the debatetowards a universal price for carbon.Response to Higher and MoreVolatile Fuel Prices123Refer to calculations on page 14CEO Climate Policy Report to G8 Leaders, WEF, 2008With respect to 1990 levelA further clear driver of decarbonization is the linkbetween carbon emissions and energy cost. Forthe most part within supply chains, there is asimple win-win on cost and carbon, with initiativesto decrease fossil fuel to reduce costs.Less financial risk can also be the result: reducedfossil fuel consumption decreases exposure tovolatility in the cost base in an operatingenvironment which has – and will continue to –see significant energy price volatility.Evolving Consumer and ClientDemandEvolving customer demand for products, inresponse to changing expectations onsustainability, feeds through the supply chain intwo ways:Direct consumer response in the form ofchanging retail purchasing patternsIndirect effect as retailers and distributorschange sourcing decisions to respond to- and pre-empt - consumer requirementsLogistics Sector ResponseThe sector has started to make meaningfulchanges in its own right, targeting substantialreductions in carbon intensity within its demandenvelope.Major levers of change have been seen as beingoperational efficiency and new technology; greenvehicles such as battery powered vans andhybrid or alternative fuel trucks are increasinglyconsidered, while aerodynamic technologies,such as those supported by the US EPASmartWay programme, are commonly seenacross fleets of all types.In parallel, most large logistics and transport firmspublish annual corporate social responsibilityreports, detailing their path towards moresustainable operations. Several of these includedetailed carbon footprint information, calculated inline with the Greenhouse Gas Protocol - themostly widely used accounting tool for emissions.To maximise the carbon abatement potential fromtheir investments, logistics and transport firms areseeking to engage with both policy makers andshippers to make cohesive changes across theentire supply chain. An end-to-end view of thesupply chain is a vital step towards achieving thechanged behaviours which can bring aboutefficient change.6
Objectives and ApproachObjectivesThis report examines opportunities for carbonemissions reduction across supply chains.We provide a quantitative and segmented outlineof the size of carbon emissions across productlife cycles.We articulate potential trends in future demandfor global supply chain services, in response toexternal drivers of change.We outline and indicatively quantify the mainopportunities for decarbonization within end-toend supply chains.Finally, we identify specific actions logistics andtransport executives can take to most effectivelydecarbonise supply chains: within their businessoperations, in collaboration with shippers andthrough engagement with policy makers.Supply Chain DecarbonizationApproachIn the development of the report, we have workedclosely with the corporate social responsibility(CSR) and strategy leads of major logistics andtransport firms. We have also been assisted byrepresentatives from NGOs, particularly theCarbon Trust and World Business Council forSustainable Development – for which we are verygrateful.The materials presented in this report aretherefore built on two forms of data and analysis.Firstly, we have used data from official sources,particularly OECD, IPCC and governmentstatistics organisations to understand and beginto size specific decarbonization opportunities.Secondly, we have put those opportunities intocontext, outlining which may be viable, throughqualitative research and interviews withcolleagues from industry and NGOs.From an initial outline of around 75 potentialtopics, we have slimmed this down to 13opportunities which are of most relevance to thesupply chain sector. These have been validatedwith our key stakeholders and advisors. Thenature of the topic means that a very substantialdegree of uncertainty and estimation remains,although we have sought to validate ourassumptions and estimates at each stage.There is a clear need to move beyond corporateand geographic barriers in addressing supplychain carbon emissions. Tactical approaches(using specific technologies to meet the needs ofa particular situation) and even sectoralapproaches (whereby initiatives are implementedwithin the boundaries of the logistics andtransport sector) do not meet the requirement todecarbonise end-to-end supply chains as awhole.In fact, tactical approaches can serve to shiftcarbon emissions between different parts of thesupply chain, rather than boosting overallefficiency.We have taken a strategic approach to the endto-end supply chain, looking at opportunities toaddress carbon emissions across the productlifecycle. The opportunities we outline areintended to be transformational and, in somecases, are unashamedly ambitious.Nevertheless, we have sought to make theoutcomes commercially relevant to supply chainorganisations and achievable under currentcircumstances. We have not, for example,assumed the adoption of any technologies whichare not already commercially available.7
FindingsOur high level findings are structured as follows:freight is considerably more carbon intensive thanroad. Overall, the most carbon efficient modesare rail and ocean freight. Carbon intensity ofboth modes is quoted by UK Defra as beingaround one sixth of that of road freight – or onehundredth of that of airfreight4.Logistics and Transport Sector CarbonFootprintTotal Supply Chain Carbon FootprintPressures for a Shift to DecarbonizationSupply Chain DecarbonizationTransportation ModeAir - Short HaulLogistics and Transport SectorCarbon FootprintFigure 2: Emission Efficiency per Transport ModeEurostat road freight data suggests that acrossthe EU and Norway “crude and manufacturedminerals, building materials” make up 17% of alltonne-km moved, with “foodstuff and animalfodder” being a further 16%5.In the USA, looking across all modes, coal makesup 17.6% of all ton-miles moved, with cerealgrains accounting for a further 8.2% of volumes6.Taken together, these calculations allow us toidentify the key characteristics of carbonemissions in the freight sector:Road freight is the principle contributor tofreight transport emissions globallyAir freight is an highly carbon intensivemodeOcean and rail freight are the mostcarbon efficient modesMinerals and food products are majorsources of transport emissionsLogisticsBuildingsRail FreightOcean Air FreightFreightTotal Mobility Emissions: 2,500 Mega Tonnes CO2e2,000RoadFreight1,5001,000500RailSea - Short Haul0.0 0.2 0.4 0.6 0.8 1.0 1.2 1.4Emissions Factors in CO2e kg / tonne-kmOverall, we estimate that the logistics andtransport sector has a carbon footprint of around2,800 mega-tonnes. In absolute terms, roadfreight is the greatest part, at around 57% of thetotal, with ocean freight some way behind at17%.GHG Emissions (mega-tonnes CO2e per year)Supply Chain DecarbonizationUsing OECD emissions data, combined withGHG Protocol emissions factors and other datapoints, we have estimated the size of the logisticsand transport sector‟s carbon footprint. Usingsource data for transport emissions, we excludedpassenger transport emissions and then soughtto build in emissions from warehouses andsortation facilities.2,500Road - AllRoad - Long HaulSea - Long HaulKey findings:The logistics and Transport Sector has acarbon footprint of around 2,800 megatonnes CO2eRoad freight is a major element of thisfootprintMinerals and food transportation are thelargest contributors by product category3,000Air - Long HaulRoad - Light CapacityThe current trend is for freight transport carbonemissions to grow over coming years. In theOECD countries, freight transport tonne-km grewby an average of 3% per year from 1990 to 2004 7.The continuing shift to more globalised supplychains, combined with the underlying economicgrowth is likely to continue – an assumptionwhich is confirmed by the available country-leveldata after 20048.0Logistics and Transport ActivityFigure 1: Emissions Share per Logistics ActivityOf course, this does not imply that road transportis the least efficient mode however. Assessed interms of emissions intensity per tonne-km, air45678Defra emissions factors, April 2008Road Freight Transport by Type of Goods, 2006, Eurostathttp://www.bts.gov/programs/freight transportation/,extracted 9/11/08WEF analysis, using OECD dataOECD Environment Data, 2006,20078
In India, diesel fuel consumption in the transportsector grew by 1.5% per year from 1990 to 2006 9.In China, the number of tonne-km of freightmoved by road increased by a massive 14% peryear over the same period10.Total Supply Chain CarbonFootprintKey finding:Logistics and transport emissions are 5 to15% of product lifecycle emissionsThere are a number of approaches which look atcarbon emissions across the entire supply chain.Methodologies are not yet sufficiently advancedto draw emissions profiles for the entire industry,but we can draw some initial insights.ProcurementProductionan initial look at the lifecycle emissions of theirproducts, particularly as major retailersincreasingly stipulate carbon reduction targets intheir suppliers‟ contracts.Economic Input Output Life Cycle Assessment(EIO-LCA) approaches provide an approximateidea of the carbon footprint of more products, withknown accuracy limitations. We have used theCarnegie Mellon University Green DesignInstitute model13 to look at logistics and transportwithin the lifecycle emissions of products.One limitation of the EIO-LCA model is that theuse and disposal phases of the product lifecycleare out of scope. Logistics and transport iscommonly found to be a 5-15% of the emissionsof each product – around 9% for telephonemanufacturing and 10% for sugar manufacturingin the following examples.Transport andDistributionMobile Phone ManufacturingGreenhouse Warming Potential per Activity9%6%4%Power generation and supply4%4%Recycling3%33%DisposalConsumptionWaste management andremediation servicesTruck transportation2%Semiconductors and relateddevice manufacturingIron and steel mills2%Industrial gas manufacturing2%Air transportationRetailTelephone apparatusmanufacturingWholesale trade31%Paper and paperboard millsOther sectorsSugar ManufacturingGreenhouse Warming Potential per ActivitySupply Chain DecarbonizationWaste15%Figure 3: End-to-End Supply Chain ProcessUsing the product-level carbon emissionscalculation methodologies developed by theCarbon Trust, firms have been able to build ameaningful picture of the total product lifecycleemissions of individual products.9%21%5%12%Sugar manufacturing2%2%1%1%1%Sugarcane and sugar beetfarmingPower generation andsupplyTruck transportationNitrogenous fertilizermanufacturingOil and gas extractionWaste management andremediation servicesPipeline transportationPetroleum refineriesAn early application of this approach led to thecarbon labels on bags of Walkers Crisps11. Laterprojects have looked at other consumer products,including T-shirts, light bulbs, orange juice andpotatoes12. The number of detailed studiescompleted at product level remains small. Theyare, however, likely to prompt more firms to take9101112WEF analysis, using Indian Ministry of Petroleum and GasdataWEF analysis, using National Bureau of Statistics ofChina datahttp://www.pepsico.co.uk/carbonlabel, extracted 9/11/08http://www.carbon-label.com/product.html, extracted9/11/0831%Natural gas distributionOther sectorsFigure 4: Share of Emission per Product TypeClearly it is important that the logistics andtransport sector works internally to slow and thenreverse the rate of growth in its emissions. Thereis, however, an equally valuable role for the13Carnegie Mellon University Green Design Institute. (2008)Economic Input-Output Life Cycle Assessment (EIOLCA), US 1997 Industry Benchmark model [Internet],Available from : http://www.eiolca.net Accessed 12October, 2008.9
sector to play in enabling emissions reductions inother parts of the product lifecycle.Pressures for a Shift toDecarbonizationKey findings:The main commercial determinants of supplychain decarbonization will be:Carbon regulationFuel price volatilityConsumer carbon awarenessDecarbonization pressures from policy makerswill not go away during a recession, with thecontinued development of carbon tradingschemes being evidenced. A significant amountof the cost of energy is already tax take for manyparts of the supply chain. Further fiscaldisincentives to emit carbon – such as limit-basedapproaches and tariff-based schemes – couldintroduce markets to address environmentalexternalities from supply chain activities.Reducing fossil fuel consumption in supply chainsis the single most important lever to cut carbonemissions. It also substantially reduces operatingexpenses in a sector where energy purchasescan range from 5 to 35% of the total cost base14.In the decade from 1991 to 2001, energy marketssaw a period of low and stable prices. In the tenyears to October 2001, the average price of abarrel of crude was US 21. Furthermore, therange from maximum to minimum price was onlyUS 27 over the whole period15.Implementing decarbonization also reducesbusiness exposure to energy cost volatility,helping to de-risk the cost base. The era of lowand stable energy costs ended in 2001, perhapslinked to growing scarcity and uncertainty ofsupply. Through 2008, businesses experiencedthe effects of fuel price volatility and exposure. Inthe two years from October 2006 to October2008, oil prices averaged US 86 / barrel. Thelowest spot price of a barrel in that period was US15 50; the highest was US 144 in July 2008 .Supply Chain DecarbonizationEU ETS will be extended to the aviation sector in2012 and there are some discussions aboutextension to ocean freight. There is currently littleor no discussion about direct extension into theroad transportation sector. This is due to preexisting fuel taxes. However; feed-through effectsfrom changes in manufacturing strategy in energyintensive industries could be expected.A carbon price applied at the current market ratesfor EU ETS credits would add a further 5% to16% to today‟s prices of crude-based fuels.Carbon PriceDistributionVATProductDutyCarbon PriceDistributionTaxesRefiningCrude 6040200Diesel FuelUKCarbon PriceCurrent PriceDiesel FuelUSJet FuelSpot Price (WTI Crude, Cushing) in US / BBLDaily Evolution in Oil Prices (1986 to Date)The major precedent has been the introduction ofEU ETS to heavily polluting industries in the EU.While the first phase of EU ETS was hit by oversupply, it is expected that this will be addressedin future phases.140120Oil PriceOil Price adjusted for inflation100806040200Figure 6: Fuel Price EvolutionMany businesses in the supply chain, bothlogistics operators and more widely, wereseriously impacted when oil prices spiralled up ashigh as US 144 / barrel in July 2008. Yet others,for example those who hedged at the time ofpeak prices and were unable to unwind theirpositions, lost out as prices fell back.Additional pressure to reduce emissions comesfrom de facto standards which are not directlylegislated. These are driven in large part byNGOs, think tanks and public policyorganisations. Attention here is increasinglyfocussed on the supply chain:14Figure 5: Effect of Potential Carbon Price Additionto Fuel at EU-ETS Market Rates16015Accenture analysisAccenture analysis, using US Energy InformationAdministration data on Cushing, OK spot prices10
The Carbon Disclosure Project launcheda supply chain programme in 2007.Requests for information were sent toover 2,000 firms16The Greenhouse Gas Protocol created ade facto standard for emissions reporting.Specific supply chain guidance comesfrom the Logistics and Transportsupplement of the Global ReportingInitiative17Recent initiatives have moved towards thecalculation of the carbon footprint of a productthrough its entire lifecycle. Standards here aregenerally still in development, but the CarbonTrust was instrumental in the October 2008launch of the PAS 2050 methodology18, while asimilar scheme has been launched in Japan19. Itseems likely that initial frameworks such as thesewill form the basis of later ISO standards.Nevertheless, consumers have becomeincreasingly carbon-aware: research by theCarbon Trust23 found that 64% of consumers inthe UK are more likely to use a businessmarketing itself as low-carbon. 67% of consumersin the UK were likely to buy a low-carbon product,and similar trends are seen across much of theEU. In the USA, the data is less compelling, withretailers focussing on price-driven marketing,although the cost-carbon linkage remainsrelevant24.Looking again at analysis from the CarnegieMellon University‟s Green Design Institute model,it is evident that the carbon footprint of productsvaries significantly in dollar value terms. For basicindustrial commodities, such as iron and steel,emissions are three to four tonnes of CO2e perUS 1,000 of value. For consumer electronicslike laptops and phones, the figure isconsiderably less than half a tonne.Metric Tonnes of GHG Emissionsin CO2e per 1,000 of TradeOn the demand side, consumers still want tobecome „greener‟, with carbon on top of theirminds. 85% of consumers in a recent worldwidesurvey were either „extremely‟ or „somewhat‟concerned by climate change, and 81% thought itwould directly impact their lives 20. And, as SirTerry Leahy, CEO of Tesco plc, commented, thecurrent economic situation means that “we needto ensure that green products are not luxuryitems, but can be bought by those on a tightbudget”21, further fuelling pressures to cut bothcost and carbon.Supply Chain Decarbonization16171819202122Carbon Disclosure Project, Supply Chain Brochure ork/SectorSupplements/LogisticsAndTransportation/ Dec 2008Carbon Trust website, extracted 10/11/08AFP, “Japan to label goods' carbon footprints: official”,Aug 19, 2008Accenture End Consumer Survey on Climate Change,2007Sir Terry Leahy, speech to British Council of ShoppingCentres annual conference, 11 Nov 2008Review of Food Miles Carbon and African Horticulture:Environmental and Developmental Issues, COLEACPEmissions from Transportation3.02.01.00.0In the short term, consumers are hampered intheir direct response by the limited availability ofinformation; few products are carbon labelled andthere is not yet a global labelling standard.Consumers instead respond to proxy indicators ofcarbon emissions, with a degree of inaccuracy.One obvious example has been the dialogueabout air miles22 for supermarket groceries.Consumer awareness campaigns have not, bycontrast, focussed on the emissions impact ofmanufacturing location, though this is likely tohave a larger impact on product lifecycle22emissions .4.0Figure 7: Lifecycle Emissions in Dollar-ValueTerms with Transport HighlightedIt is possible that changing consumer awarenessaround carbon emissions will impact on demandfor products in different ways, particularly ifcarbon calculation and labelling schemes bringfootprint information to the fore. The effects ofchanging consumer demands, combined with asupporting response from the large globalretaile
for supply chain decarbonization remain valid. Understanding Supply Chain Decarbonization This report is constructed from the viewpoint of the world‟s largest logistics and transport firms, the heart of supply chain decarbonization efforts. provide both a contextual and an initial decarbonization challenge. It looks at likely , purposefully .
