Transcription
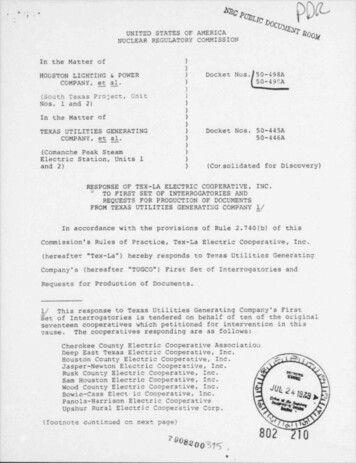
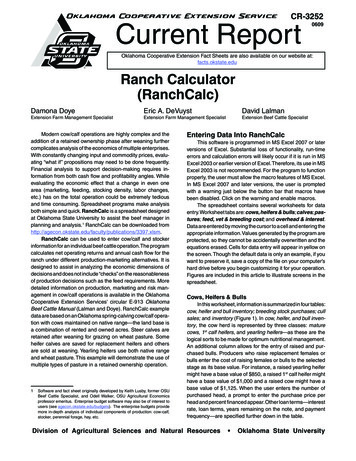
Oklahoma Cooperative Extension ServiceCR-3252Current Report0609Oklahoma Cooperative Extension Fact Sheets are also available on our website at:facts.okstate.eduRanch Calculator(RanchCalc)Damona DoyeExtension Farm Management SpecialistEric A. DeVuystModern cow/calf operations are highly complex and theaddition of a retained ownership phase after weaning furthercomplicates analysis of the economics of multiple enterprises.With constantly changing input and commodity prices, evaluating “what if” propositions may need to be done frequently.Financial analysis to support decision-making requires information from both cash flow and profitability angles. Whileevaluating the economic effect that a change in even onearea (marketing, feeding, stocking density, labor changes,etc.) has on the total operation could be extremely tediousand time consuming. Spreadsheet programs make analysisboth simple and quick. RanchCalc is a spreadsheet designedat Oklahoma State University to assist the beef manager inplanning and analysis.1 RanchCalc can be downloaded /3397.xlsm.RanchCalc can be used to enter cow/calf and stockerinformation for an individual beef cattle operation.The programcalculates net operating returns and annual cash flow for theranch under different production-marketing alternatives. It isdesigned to assist in analyzing the economic dimensions ofdecisions and does not include “checks” on the reasonablenessof production decisions such as the feed requirements. Moredetailed information on production, marketing and risk management in cow/calf operations is available in the OklahomaCooperative Extension Services' circular E-913 OklahomaBeef Cattle Manual (Lalman and Doye). RanchCalc exampledata are based on an Oklahoma spring-calving cow/calf operation with cows maintained on native range—the land base isa combination of rented and owned acres. Steer calves areretained after weaning for grazing on wheat pasture. Someheifer calves are saved for replacement heifers and othersare sold at weaning. Yearling heifers use both native rangeand wheat pasture. This example will demonstrate the use ofmultiple types of pasture in a retained ownership operation.1David LalmanExtension Farm Management SpecialistSoftware and fact sheet originally developed by Keith Lusby, former OSUBeef Cattle Specialist, and Odell Walker, OSU Agricultural Economicsprofessor emeritus. Enterprise budget software may also be of interest tousers (see agecon.okstate.edu/budgets). The enterprise budgets providemore in-depth analysis of individual components of production: cow-calf,stocker, perennial forage, hay, etc.Extension Beef Cattle SpecialistEntering Data Into RanchCalcThis software is programmed in MS Excel 2007 or laterversions of Excel. Substantial loss of functionality, run-timeerrors and calculation errors will likely occur if it is run in MSExcel 2003 or earlier version of Excel. Therefore, its use in MSExcel 2003 is not recommended. For the program to functionproperly, the user must allow the macro features of MS Excel.In MS Excel 2007 and later versions, the user is promptedwith a warning just below the button bar that macros havebeen disabled. Click on the warning and enable macros.The spreadsheet contains several worksheets for dataentry. Worksheet tabs are: cows, heifers & bulls; calves; pastures; feed, vet & breeding cost; and overhead & interest.Data are entered by moving the cursor to a cell and entering theappropriate information. Values generated by the program areprotected, so they cannot be accidentally overwritten and theequations erased. Cells for data entry will appear in yellow onthe screen. Though the default data is only an example, if youwant to preserve it, save a copy of the file on your computer’shard drive before you begin customizing it for your operation.Figures are included in this article to illustrate screens in thespreadsheet.Cows, Heifers & BullsIn this worksheet, information is summarized in four tables:cow, heifer and bull inventory; breeding stock purchases; cullsales; and inventory (Figure 1). In cow, heifer, and bull inventory, the cow herd is represented by three classes: maturecows, 1st calf heifers, and yearling heifers—as these are thelogical sorts to be made for optimum nutritional management.An additional column allows for the entry of raised and purchased bulls. Producers who raise replacement females orbulls enter the cost of raising females or bulls to the selectedstage as its base value. For instance, a raised yearling heifermight have a base value of 850, a raised 1st calf heifer mighthave a base value of 1,000 and a raised cow might have abase value of 1,125. When the user enters the number ofpurchased head, a prompt to enter the purchase price perhead and percent financed appear. Other loan terms—interestrate, loan terms, years remaining on the note, and paymentfrequency—are specified further down in the table.Division of Agricultural Sciences and Natural Resources Oklahoma State University
Figure 1. Cows, Heifers & Bulls Worksheet.Death loss is the percent of deaths expected for thatclass of livestock. Enter the weaning percentage expectedfor mature cows and 1st calf heifers separately. The numberof calves weaned is calculated using the weaning percentwith the number of cows and heifers in the herd (cow andheifer death losses are assumed to occur before calving).On average, a calf crop is expected to be one-half femalesand one-half males. The user specifies the number of steersweaned, and heifers weaned is the calculated remainder. Theuser enters the number of heifers retained for the breedingherd as this impacts the calf sales figures and ultimately thecash flow summary figures. A pop-up form requires the userto divide the heifers produced into three groups: heifers soldat weaning, heifers retained as stockers and heifers retainedas replacements.Initial principal is calculated based on the purchase priceand percent financed entered at the top of the table. The loanterms—interest rate, loan term, years remaining on loan, payment frequency—are used to calculate total annual payments;total principal, current year; and total interest, current year.These numbers then flow automatically to the appropriatesections on the results worksheet.In the breeding stock purchases table, the number of headand purchase prices for mature cows, 1st calf heifers, yearlingheifers and bulls are entered for the year being planned oranalyzed.In the cull sales table, the number of head sold, averageweight per head in pounds, average cost basis/base valueand sale price ( /cwt) are specified for three classes of cattle:cull cows and 1st calf heifers, cull yearling heifers and cull bulls.2CR-3252.2For more information, see AGEC-323, Valuation of RaisedBreeding Livestock, aluation-of-raised-breeding-livestock/
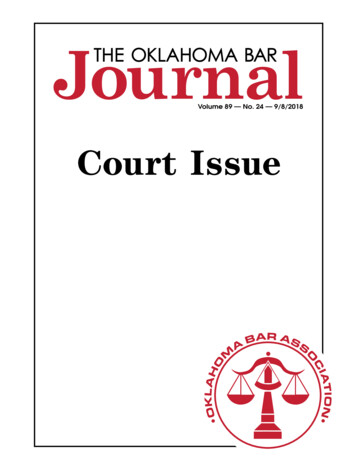
The average cost basis/base value is purchase price minusaccumulated depreciation for purchased breeding stock; forraised breeding stock, it is the base value of the animal (thecost of raising the animal to that stage, e.g. mature cow).2Average cost basis is important because it impacts the netincome calculation and profitability figures (net income issales price less the average cost basis or base value). Forcash flow calculations, the dollar value of sales per head, aswell as the total for each class of cattle is calculated.The inventory table summarizes changes in number ofhead in the breeding herd by class of cattle for the analysisperiod—listing the beginning inventory, purchased & retained,sales, death loss, net transfers, ending inventory and thechange in number of head for the time period. Death loss isthe beginning inventory multiplied by the percentage deathloss. Net transfers shows the number of females that matureto the next stage. For example, yearling heifer transfers is thesum of the heifers retained from mature cows and first calfheifers minus the beginning inventory of yearling heifers thatage to become 1st calf heifers. The final line in the table allowsthe user to track the ranch’s bull inventory.CalvesIt is anticipated that producers may retain their own calvesas stockers, purchase stockers, or have a combination of retained and purchased stockers.The calves worksheet includestwo tables: stocker inventory and calf and stocker sales (Figure2). If stockers are kept, the number of head, percent financed,initial weight, initial price (purchase price for stockers, marketprice at weaning for retained stockers) is entered along withestimated average daily gain (ADG), death loss, and daysowned. Producers retaining their own calves estimate averageFigure 2. Calves Worksheet.CR-3252.3
Figure 3. Pastures Worksheet.CR-3252.4
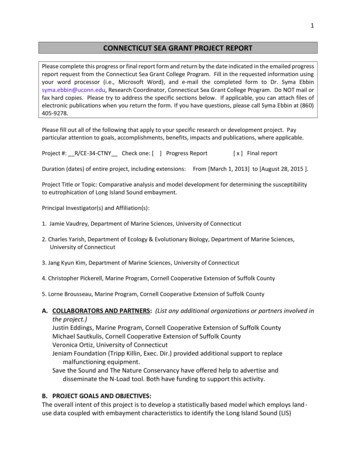
weight and price per hundredweight for calves at weaningand sell them to their stocker enterprise to permit economicanalysis of this production activity. This can be thought of asan internal transfer between ranch enterprises. The sale priceis required for the cow/calf enterprise and the purchase priceis required for the stocker enterprise.Two types of purchased stockers are allowed. The twotypes of stockers can be used to represent two qualities, twogenders, two weights or two prices for stockers. Entering azero in the initial inventory line will eliminate a stocker typein the analysis, permitting quick evaluation of strategies withand without one or more types. For example, entering a zerofor stocker 1 or stocker 2 (these labels can be changed) willremove the type from all later cash flow and profitability calculations. Using the specified percent financed and interestrate, loan values are calculated assuming the loan will berepaid when calves are sold.Calf and stocker sales are calculated once the weightis specified for calves sold at weaning and the sale pricesare specified for all classes of calves. The number of stockersteers and heifers sold and their sale weights are calculatedusing the number of stockers, expected death loss, daily gainand length of ownership. Heifer calves retained as breedingreplacements are not included in sales values but are includedin income calculations.PasturesThe pastures worksheet includes six tables: ownedpasture information, rented pasture information, two pastureallocation tables (optional), pasture cash expense and pasturerent and overhead allocation (Figure 3). In addition to Native,Bermuda and Wheat pasture, users can specify two additionaltypes of owned and/or rented pasture land. For owned pasture land, enter the label (for example, Old World Bluestemor Fescue) in the top row of owned pasture information, followed by the number of acres, percent financed, purchaseprice and taxes per acre. The amount financed per acre andoriginal loan principal will be calculated. Payments per year onthe land loan are calculated using the interest rate, paymentfrequency, loan term and years remaining on loan specifiedby the user.In rented pasture information, enter the number of acresand the annual rent per acre or be sure that acres 0 for alltypes of pasture where no land is rented.In pasture allocation–head grazed on each pasture type,enter stocking rate information for all classes of cattle andpasture used. Cattle can use a mixture of the five pastures.The number of cattle of each class should be entered for eachpasture type. Be sure all cattle are allocated to a pasture bystudying the head remaining to allocate row at the bottomof this table. Note that if a specific group of cattle is rotatedthrough several types of pastures the head remaining to allocate row may show a negative number. For example, if 100retained stockers graze out wheat pasture and later are puton summer native pasture, you would enter 100 head in boththe Native and Wheat row. Land requirements for the bullsare assumed to be included in the land provided for the cowherd.In pasture allocation–acres per head, the total of all rentedand owned land by pasture type is shown at the left side ofthe table. In the body of the table, stocking rates (acres perhead) are specified for the different types of cattle on alternative forages. If the excess/deficit acres at the right side ofthis table are high, cattle numbers, stocking rates or acreageFigure 4. Feed, Vet and Breeding Cost Worksheet.CR-3252.5
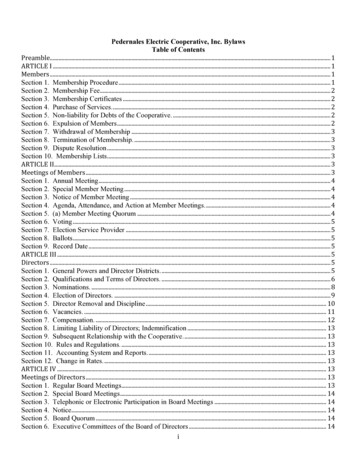
may need to be adjusted. Be sure to delete any stocking ratenumbers remaining from previous analysis for classes of animalor pasture that are no longer relevant.Applicable cash costs per acre for fertilizer and lime, tillage,seeding, weed control, and other are entered in the pasturecash expense table under each pasture type. Total cash costper acre and cost per farm are calculated.Feed, Vet and Breeding CostsTwo tables are included in this worksheet: hay and feedcosts per head and veterinary and miscellaneous expenses(Figure 4). In hay and feed costs per head, the user can enterup to eight feeds or hays. In the example, cubes and hay areincluded along with salt/minerals. The labels for types of feedcan be changed, as can the cost per unit, feeding rate in poundsper head per day and the total number of days fed. The totalcost of each feed type for each class of cattle is calculated.If hay is purchased, the delivered price should be entered; ifhay is raised, enter the estimated total cost of the home-grownhay. (Don’t double count expenses if hay is taken off pasturewhere pasture expenses are included in the earlier table.)Cash costs per head for pest control, vet costs, hiredhauling, marketing, ad valorem taxes and other expenses areentered in veterinary and miscellaneous expense. Note: costssuch as hauling and marketing are affected by retention plans.Total cash cost per head and for the operation are calculated.Other RevenueOther sources of revenue from the ranching operationmay be specified in this worksheet as shown in the table inFigure 5. Several examples are shown in the table. Sincea proportion cannot be allocated to the cow herd or stockerenterprise, the total revenue represents an amount devotedto the entire ranch.Overhead and InterestFour tables are included in this worksheet for data entry:machinery, equipment and facilities; labor and overhead allocation; operating note information; and other overhead costs(Figure 6). The terms of financing plus annual ownership andmaintenance costs for vehicles, equipment, facilities, fencesand buildings are entered in the first table. A total value formachinery and equipment plus a total value for working fa-Figure 5. Other Revenue Worksheet.cilities, fences, buildings can be specified. Annual paymentson outstanding loans are calculated using the interest ratesand loan terms specified. Depreciation costs are calculatedbased on the difference between purchase price and salvagevalue, divided by years of useful life. The opportunity cost ofcapital (the cost of having money invested in these assets asopposed to investing it elsewhere) is the interest rate timesaverage investment, where average investment is calculatedusing the average of purchase price and salvage value.The cost of hired labor and value of family and ownlabor along with any remaining miscellaneous expenses forthe entire ranch for the year are entered in the labor andoverhead allocation table. Costs could include legal fees,insurance, consulting, business-related travel, seminars,computer software, etc. Also, enter the percent of time thatmachinery and equipment and working facilities, fences,buildings are used by the cow herd. Note: the total percentmay be less than 100 percent if there are other enterprises(for instance, crops or other livestock) to which a portion ofthe expenses should be allocated.Operating note information is partitioned between thecow herd and stockers by entering the percent of operatingcapital borrowed for each class of cattle and the averagenumber of months the capital is borrowed. Interest rates foreach category of loan may be entered.The other overhead cost table facilitates calculation offixed costs for other capital assets, namely breeding livestockand land. Depreciation costs for purchased mature cows arecalculated using the difference between purchase price andsalvage value, divided by years of useful life. No depreciationis calculated for raised livestock as their ownership costs arereflected in operating costs and, for the same reason, depreciation is not calculated for younger livestock purchased.Opportunity cost on investment is the dollar amount offoregone returns from not investing elsewhere and is calculated by averaging investment over time and multiplyingit by an interest rate. The average investment over time isequal to the purchase price plus salvage value divided bytwo. Interest on average investment is entered as a percentand represents the rate of return the producer might havereceived if the funds had been invested elsewhere.ResultsResults are summarized in three tables: cow herd cashflow and profitability analysis, stocker cash flow and profitabilityanalysis and whole farm cashflow and profitability analysis(Figure 7). The cash flow column highlights cash sourcesand uses, including principal and interest payments on anyloans included in the analysis.In the profitability column, cash and non-cash incomeand expenses are included, while principal payments areexcluded. Noncash income includes the value of raised heifersretained for the breeding herd, plus the increase in value offemales retained as they mature to the cow stage. Noncashcosts include depreciation, death losses and the opportunitycost associated with funds invested in fixed assets includingbreeding livestock, machinery, equipment, vehicles, buildings,CR-3252.6
Figure 6. Overhead and Interest Worksheet.facilities and land. The total of cash and noncash expensesare subtracted from total receipts to estimate annual returnsto owned capital, management and risk. Note: interest onterm debt (borrowed money) is included in opportunity coston investment.SummarySpreadsheets offer tremendous flexibility for users, allowing quick analysis of complex management options. Ranch-Calc can be used to evaluate economic aspects of the cow/calf enterprise, stocker enterprise or a combination of both.The spreadsheet is designed to capture and summarize keyinformation impacting both cash flow and profitability. Once thebase case is defined, a number of alternative scenarios canbe easily assessed. Users may explore alternative productionassumptions, price assumptions, lending conditions, etc. andsee how results change for each ranch enterprise.CR-3252.7
Figure 7. Results Worksheet.Selected ReferencesLalman, D. and D. Doye “Oklahoma Beef Cattle Manual.” 7thedition. Oklahoma State University. September 2015.OSU Enterprise Budget software. agecon.okstate.edu/budgets.Oklahoma State University, in compliance with Title VI and VII of the Civil Rights Act of 1964, Executive Order 11246 as amended, and Title IX of the Education Amendments of 1972 (HigherEducation Act), the Americans with Disabilities Act of 1990, and other federal and state laws and regulations, does not discriminate on the basis of race, color, national origin, genetic information,sex, age, sexual orientation, gender identity, religion, disability, or status as a veteran, in any of its policies, practices or procedures. This provision includes, but is not limited to admissions,employment, financial aid, and educational services. The Director of Equal Opportunity, 408 Whitehurst, OSU, Stillwater, OK 74078-1035; Phone 405-744-5371; email: eeo@okstate.edu hasbeen designated to handle inquiries regarding non-discrimination policies: Director of Equal Opportunity. Any person (student, faculty, or staff) who believes that discriminatory practices havebeen engaged in based on gender may discuss his or her concerns and file informal or formal complaints of possible violations of Title IX with OSU’s Title IX Coordinator 405-744-9154.Issued in furtherance of Cooperative Extension work, acts of May 8 and June 30, 1914, in cooperation with the U.S. Department of Agriculture, Director of Oklahoma Cooperative ExtensionService, Oklahoma State University, Stillwater, Oklahoma. This publication is printed and issued by Oklahoma State University as authorized by the Vice President for Agricultural Programs andhas been prepared and distributed at a cost of 30 cents per copy. Revised 0817 GH.CR-3252.8
cow, heifer and bull inventory; breeding stock purchases; cull sales; and inventory (Figure 1). In cow, heifer, and bull inven - tory, the cow herd is represented by three classes: mature cows, 1st calf heifers, and yearling heifers—as these are the logical sorts to be made for optimum nutritional management.