Transcription
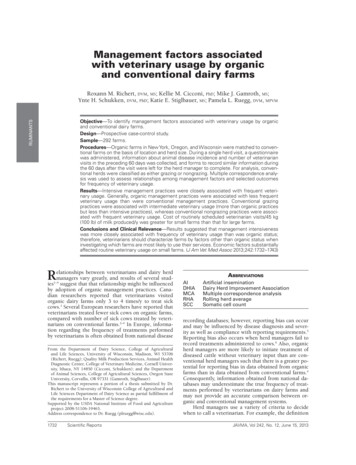
Management factors associatedwith veterinary usage by organicand conventional dairy farmsRoxann M. Richert, DVM, MS; Kellie M. Cicconi, PhD; Mike J. Gamroth, MS;Ynte H. Schukken, DVM, PhD; Katie E. Stiglbauer, MS; Pamela L. Ruegg, DVM, MPVMRUMINANTSObjective—To identify management factors associated with veterinary usage by organicand conventional dairy farms.Design—Prospective case-control study.Sample—292 farms.Procedures—Organic farms in New York, Oregon, and Wisconsin were matched to conventional farms on the basis of location and herd size. During a single herd visit, a questionnairewas administered, information about animal disease incidence and number of veterinarianvisits in the preceding 60 days was collected, and forms to record similar information duringthe 60 days after the visit were left for the herd manager to complete. For analysis, conventional herds were classified as either grazing or nongrazing. Multiple correspondence analysis was used to assess relationships among management factors and selected outcomesfor frequency of veterinary usage.Results—Intensive management practices were closely associated with frequent veterinary usage. Generally, organic management practices were associated with less frequentveterinary usage than were conventional management practices. Conventional grazingpractices were associated with intermediate veterinary usage (more than organic practicesbut less than intensive practices), whereas conventional nongrazing practices were associated with frequent veterinary usage. Cost of routinely scheduled veterinarian visits/45 kg(100 lb) of milk produced/y was greater for small farms than that for large farms.Conclusions and Clinical Relevance—Results suggested that management intensivenesswas more closely associated with frequency of veterinary usage than was organic status;therefore, veterinarians should characterize farms by factors other than organic status wheninvestigating which farms are most likely to use their services. Economic factors substantiallyaffected routine veterinary usage on small farms. (J Am Vet Med Assoc 2013;242:1732–1743)Relationships between veterinarians and dairy herdmanagers vary greatly, and results of several studies1–4 suggest that that relationship might be influencedby adoption of organic management practices. Canadian researchers reported that veterinarians visitedorganic dairy farms only 3 to 4 times/y to treat sickcows.1 Several European researchers have reported thatveterinarians treated fewer sick cows on organic farms,compared with number of sick cows treated by veterinarians on conventional farms.2–4 In Europe, information regarding the frequency of treatments performedby veterinarians is often obtained from national diseaseFrom the Department of Dairy Science, College of Agriculturaland Life Sciences, University of Wisconsin, Madison, WI 53706(Richert, Ruegg); Quality Milk Production Services, Animal HealthDiagnostic Center, College of Veterinary Medicine, Cornell University, Ithaca, NY 14850 (Cicconi, Schukken); and the Departmentof Animal Sciences, College of Agricultural Sciences, Oregon StateUniversity, Corvallis, OR 97331 (Gamroth, Stiglbauer).This manuscript represents a portion of a thesis submitted by Dr.Richert to the University of Wisconsin College of Agricultural andLife Sciences Department of Dairy Science as partial fulfillment ofthe requirements for a Master of Science degree.Supported by the USDA National Institute of Food and Agricultureproject 2008-51106-19463.Address correspondence to Dr. Ruegg (plruegg@wisc.edu).1732Scientific ReportsABBREVIATIONSAIDHIAMCARHASCCArtificial inseminationDairy Herd Improvement AssociationMultiple correspondence analysisRolling herd averageSomatic cell countrecording databases; however, reporting bias can occurand may be influenced by disease diagnosis and severity as well as compliance with reporting requirements.5Reporting bias also occurs when herd managers fail torecord treatments administered to cows.6 Also, organicherd managers are more likely to initiate treatment ofdiseased cattle without veterinary input than are conventional herd managers such that there is a greater potential for reporting bias in data obtained from organicfarms than in data obtained from conventional farms.4Consequently, information obtained from national databases may underestimate the true frequency of treatments performed by veterinarians on dairy farms andmay not provide an accurate comparison between organic and conventional management systems.Herd managers use a variety of criteria to decidewhen to call a veterinarian. For example, the definitionJAVMA, Vol 242, No. 12, June 15, 2013
Materials and MethodsFarm selection—Between April 2009 and April2011, dairy farms located in New York, Oregon, andWisconsin were recruited for the study. To be includedin the study, each farm had to have a minimum of 20cows and must have produced and sold milk commercially for at least the 2 years prior to study enrollment.To be classified as an organic farm, a farm must havebeen certified as organic for at least the 2 years prior tostudy enrollment. Letters that described the study weremailed to all organic dairy farms as well as randomlyselected conventional dairy farms that were located inthe same counties as the organic farms. Letters weremailed to nonresponding farms multiple times in an efJAVMA, Vol 242, No. 12, June 15, 2013fort to increase study participation. Conventional farmswere matched to each organic farm that was enrolled inthe study on the basis of herd size (total lactating anddry cows), which was classified into 1 of 4 categories: 100 cows, 100 to 199 cows, 200 to 299 cows, or 300 cows). Because of variations in farm demographicswithin each state, the ratio of organic farms to conventional farms varied by state (3:1 for New York, 1:1 forOregon, and 2:1 for Wisconsin).Questionnaire—The questionnaire17 used wasadapted from published survey instruments,16,18 withinput from veterinarians familiar with the organic dairyindustry. The questionnaire consisted of 208 questions regarding herd inventory and expansion (n 8),production and health (7), reproduction (14), housing (4), feed and water (18), milking procedures (21),cow routine and screening procedures (8), cow diseasedefinitions and treatment (42), mastitis definitions andtreatment (20), paratuberculosis (13), selected diseasescenarios (3), veterinarian involvement (8), routinemanagement of calves (14), calf disease definitions andtreatment (12), routine management of heifers (8), andheifer disease definition and treatment (8). For eachfarm, responses were recorded on the basis of the herdmanager’s recall and review of farm records. The definition for each disease that was evaluated via the questionnaire varied among farms and represented the herdmanager’s perception of that disease.The likelihood of a veterinarian being called to examine a cow was evaluated with a 5-point Likert scale(ie, not at all likely, slightly likely, somewhat likely,very likely, or extremely likely) for each of 3 scenarios:a newly identified anorexic cow, an anorexic cow thathad been treated for 2 days and its condition remainedthe same, and an anorexic cow that had been treatedfor 2 days and its condition had deteriorated. Despitefrequent communication among study personnel andcontemporaneous scheduling of farm visits, this question was inadvertently asked in different manners in the3 states. In New York and Oregon, herd managers wereasked to rank the likelihood of their calling a veterinarian on a scale from 1 to 5, whereas in Wisconsin, herdmanagers were asked to choose from the list of choicesprovided in the questionnaire. The answers to the 3likelihood scenarios were combined into a Likert summative scale to measure the underlying latent outcomevariable for likelihood of calling a veterinarian.19 Because of differences in administration of the questionnaire, the data for the combined latent outcome variable for farms in Wisconsin were analyzed separatelyand compared with that data for farms in New York andOregon.For most questions, the recall period was either 60days or 1 year, but for a few questions, the recall period could have been up to 3 years before the visit. Thesame questionnaire was used for both conventional andorganic farms. Study approval was obtained from theInstitutional Review Board and Animal Care and UseCommittee of Oregon State University.Data collection—Within each state, herd managers were interviewed by the same investigator. All studyinvestigators met and were trained on administraScientific Reports1733RUMINANTSof mastitis may be a key determinant for initiation ofclinical mastitis treatment.7–9 Prior to calling a veterinarian, many herd managers also consider the individual characteristics (eg, parity and stage of lactation) ofthe affected cow, herd factors (eg, predominant breedor presence of another sick animal on the farm),10 andtheir previous experience with alternatives to traditional treatment (eg, drying off the affected quarter orsegregating mastitic milk from the bulk tank).8 Lack ofstandardization of criteria for having a veterinarian examine and treat a sick animal may result in variations inthe frequency of treatments administered by veterinarians among national databases.11 The United States doesnot have a unified database of treatments performedon dairy farms, and the US National Organic Programstrictly limits the medications allowed for use on certified organic farms. Thus, veterinarians practice under adifferent set of guidelines on organic farms than they doon conventional farms.12Results of multiple studies13–16 suggest that veterinarians are less involved in animal health care on organic farms than they are on conventional farms. In1 study,13 only 112 of 288 (39%) organic farms usedroutine veterinary services, compared with 836 of1,194 (70%) conventional farms that used routine veterinary services.13 In Denmark, organic herd managersreported that veterinarians were more involved in thetreatment of individual sick cattle rather than in theadvisement of disease prevention programs.14,15 In theUnited States, organic herd managers are more likely torely on other producers for advice regarding individualcow treatments, whereas conventional herd managers are more likely to rely on veterinarians for adviceregarding individual cow treatments.16 The frequencyof treatments administered by veterinarians representsonly 1 aspect of the relationship between veterinariansand dairy herd managers. The role of a veterinarian on adairy farm may also include the performance of routinepractices (ie, pregnancy diagnosis), creation of standard operating protocols for the treatment of variousdiseases, input into the assessment and establishmentof herd performance goals, and training of farm personnel. Information regarding the role of veterinarians onUS dairy farms is lacking. The objectives of the studyreported here were to characterize the role of veterinarians on organic and similarly sized conventional dairyfarms and to identify farm characteristics that were associated with the frequency of veterinary usage.
RUMINANTStion of the questionnaire before the herd visits began.Throughout the data collection period, investigatorsheld monthly conference calls to discuss questions andhelp ensure standardization of data collection amongfarms in the 3 states.For most farms, the person directly responsiblefor animal care was interviewed. Information regarding frequencies of farm visits by a veterinarian, disease,and treatments was collected for both retrospective andprospective periods. Retrospective data were collectedfor the 60 days immediately prior to the farm visit onthe basis of manager recall and review of farm records.Prospective data were collected for the 60-day periodimmediately after the farm visit via completion of standardized forms by the herd manager. Herd managerswere instructed to recall or record information aboutall sick cattle, regardless of administration of treatment.Statistical analysis—Each farm was classified asorganic, conventional grazing, or conventional nongrazing. For the present study, the definition of a grazing farm was the same as that established by the USNational Organic Program20; thus, conventional grazing farms were farms that were not certified organic andon which 30% of dry matter intake by lactating cowsduring the growing season was obtained from pasture.Other farm variables evaluated included state wherethe farm was located (New York, Oregon, or Wisconsin), number of years the herd manager had been involved in dairy farming ( 15 years, 15 to 32 years,or 32 years), herd size (20 to 99 cows, 100 to 199cows, or 200 cows), predominant breed of cows inherd (Holstein, Jersey, or other), proportion of cowsin their third or later lactation (0% to 34%, 34% to50%, or 50%), RHA ( 5,674 kg/cow/y [ 12,483 lb/cow/y], 5,674 to 8,960 kg/cow/y [ 12,483 to 19,712lb/cow/y], or 8,960 kg/cow/y), bulk tank SCC ( 130,000 cells/mL, 130,000 to 280,000 cells/mL, or 280,000 cells/mL), amount of grain fed (none, 3.6kg/cow/d [ 7.9 lb/cow/d], 3.6 to 8.2 kg/cow/d [ 7.9 to 18.0 lb/cow/d], or 8.2 kg/cow/d), whetherpregnancy checks were performed (yes or no), use ofa nutritionist (yes or no), use of DHIA testing (yesor no), use of vaccines or homeopathic nosodes (ie,vaccines; yes or no), cows bred by AI exclusively (yesor no), use of written herd records (yes or no), andwhether new cattle were added to the herd during theobservation period (yes or no). The unit of analysiswas farm. Descriptive statistics were generated to verify accuracy of data, detect missing data, and observefrequency distributions. Because the outcomes for allthe variables were categorized, comparisons amongthe 3 farm classifications were performed via χ2 analyses except when the expected value in at least 1 cellwas 5 and a Fisher exact test was performed. Allanalyses were performed with statistical software,a andvalues of P 0.05 were considered significant.Completion of the prospective data forms by theherd manager was considered a potential source of selection bias and was evaluated via multiple methods. AWilcoxon rank sum test was used to determine whetherherd size or RHA was associated with completion of theprospective data form by the herd manager. A χ2 analysis was used to determine whether the state where the1734Scientific Reportsfarm was located or farm classification was associatedwith completion of the prospective data form. Finally,a Cochran-Mantel-Haenszel analysis was used to determine whether completion of the prospective data formwas associated with farm classification after an adjustment was made for variation in farm recruitment bystate.Multiple correspondence analysis was performedto assess relationships between categorical outcomeand explanatory variables.21 Continuous variables werecategorized; typically, the cutoffs used to define thecategories were none (when appropriate) and the 25thand 75th percentiles. When possible, outcome variableswere categorized into 3 levels to more clearly demonstrate associations.22 The outcome variable for eachMCA was projected as a supplementary variable ontothe MCA axes.21,22For each farm in New York and Wisconsin, thenumber of all veterinary visits during the 60 days before (ie, retrospective data collection period) and after (ie, prospective data collection period) the farmvisit by the study investigators was adjusted for herdsize to create a standardized outcome variable (ie,the number of veterinary visits/100 cows/30 d) andthen categorized (none, few [ 0 to 0.85 veterinaryvisits/100 cows/30 d], some [ 0.85 to 2.3 veterinaryvisits/100 cows/30 d], or many [ 2.3 veterinary visits/100 cows/30 d]). The number of routinely scheduled veterinary visits was similarly standardized (ie, thenumber of routinely scheduled veterinary visits/100cows/y) and categorized (none, few [ 0 to 0.75 routinely scheduled veterinary visits/100 cows/y], some[ 0.75 to 19 routinely scheduled veterinary visits/100cows/y], or many [ 19 routinely scheduled veterinaryvisits/100 cows/y]). χ2 analyses were used to determinethe respective associations between the number of veterinary visits (all and routinely scheduled visits) andeach farm variable evaluated. For each χ2 analysis, thecategories for the number of veterinary visits formedthe columns and the categories for each farm variableformed the rows. All farm variables that were unconditionally associated with the number of veterinary visitswere included in an MCA.The respective associations between farm classification and type of veterinary visit (routine, scheduledin advance, or not scheduled in advance) and type ofwork performed during the veterinary visit (reproductive, examination and treatment of sick cows, routine[vaccination or dehorning], consulting, or emergency)were evaluated with χ2 analyses. For the subset routinelyscheduled veterinary visits, the association between farmclassification and type of work performed during the veterinary visit was evaluated with χ2 analysis. χ2 analysiswas also used to evaluate the association between herdsize and the number of routinely scheduled veterinaryvisits. The extent of agreement between the number ofroutinely scheduled veterinary visits reported by the herdmanager during the interview with study investigatorsand the number of routinely scheduled veterinary resultsobtained via records review for the retrospective and prospective data collection periods was assessed with a κstatistic.22 The cost of a routinely scheduled veterinaryvisit/45 kg (100 lb) milk produced/y was calculated foreach farm on the basis of the following assumptions:JAVMA, Vol 242, No. 12, June 15, 2013
ResultsStudy farms—Approximately 30% of the eligibleorganic dairy farms in New York and Wisconsin and60% of the eligible organic dairy farms in Oregon wereenrolled in the study. The enrollment criteria used resulted in a study population of farms that approximatedthe general population of dairy farms in the 3 participating states.23 Descriptive data for the 292 dairy farmsthat were enrolled in the study were summarized (Table1). The majority (209/292 [72%]) of study farms had 100 cows, whereas the remaining farms were equallysplit between the medium (100 to 199 cows) and large( 200 cows) herd size categories. The proportion ofconventional nongrazing farms that were classified asmedium- and large-sized herds was greater, comparedwith the proportion of organic or conventional grazingherds that were classified as medium- and large-sizedherds. Organic and conventional grazing farms had agreater proportion of cows in their third or later lactation than did conventional nongrazing farms. For thefarms for which RHA data were available, the majority(174/189 [92%]) of organic farms were classified in thelow and medium RHA categories, whereas the majority(44/64 [69%]) of conventional nongrazing farms wereclassified in the high RHA category. Of the 192 organicfarms, 24 (13%) did not feed any grain to their cowsand 60 (31%) fed only low amounts ( 3.6 kg/cow/d) ofgrain to their cows, whereas the majority (40/64 [63%])of conventional nongrazing farms fed high amounts( 8.2 kg/cow/d) of grain to their cows. Farm classification (organic, conventional grazing, or conventionalnongrazing) was significantly associated with havingcows examined for pregnancy (P 0.001), use of a nutritionist (P 0.001), use of DHIA testing (P 0.021),use of vaccines (P 0.001), predominant breed of cowsJAVMA, Vol 242, No. 12, June 15, 2013in herd (P 0.001), and number of sick cows examinedby a veterinarian during the study observation period(P 0.001).Completion of data collection—Completion of theprospective data forms by the herd manager was not associated with herd size or RHA. After adjusting for state,farm classification was also not associated with completion of the prospective data forms by the herd manager.Information regarding veterinary visits during the retrospective data collection period was obtained for 87 farmsin New York and 112 farms in Wisconsin, of which 28(32%) farms in New York and 83 (74%) farms in Wisconsin also provided information regarding veterinaryvisits during the prospective data collection period;thus, complete information regarding veterinary visitswas available for 111 farms. Information regarding sickcows during the retrospective data collection period wasobtained for 95, 40, and 147 farms in New York, Oregon, and Wisconsin, respectively, of which 29 (31%),31 (78%), and 118 (80%) farms in New York, Oregon,and Wisconsin, respectively, also provided informationregarding sick cows during the prospective data collection period. Thus, complete information regarding sickcows was available for 178 farms.All veterinary visits—For the 199 study farms fromwhich data were obtained, 50 (25%) reported no veterinary visits during the observation period (Table 2). Forthe remaining 149 farms, 682 veterinary visits were recorded during the retrospective and prospective data collection periods (Table 3). Of those 682 visits, 321 (47%)were routinely scheduled, 119 (17%) were scheduled inadvance, and 242 (35%) were not scheduled in advance.For all veterinary visits, reproductive work (398/682[58%]) was most frequently performed followed by examination and treatment of sick cows (286/682 [42%]),whereas emergency work (68/682 [10%]) and consulting (15/682 [2%]) were performed infrequently. Routine work (ie, vaccination or dehorning) was the onlycategory of veterinary work that was significantly (P 0.001) associated with farm classification and was morefrequently performed on conventional grazing farmsthan on organic or conventional nongrazing farms.The frequency of veterinary visits ranged from 0.11to 7.1 veterinary visits/100 cows/30 d. Farm classification was significantly (P 0.001) associated with thefrequency of veterinary visits. Approximately equalproportions of organic farms were classified as havingno (48/135 [36%]) or some (ie, 0.85 to 2.3 veterinary visits/100 cows/30 d; 47/135 [35%]) veterinaryvisits. Most conventional grazing farms (11/19) wereclassified as having some veterinary visits, whereasmost conventional nongrazing farms were classifiedas having some (17/45 [38%]) or many (ie, 2.3 veterinary visits/100 cows/30 d; 20/45 [44%]) veterinaryvisits. Other farm variables unconditionally associatedwith frequency of veterinary visits included state, RHA,bulk tank SCC, amount of grain fed to cows, havingcows examined for pregnancy, use of a nutritionist, useof DHIA testing, use of vaccines, predominant breed ofcows in the herd, and method used to breed cows.Results of MCA revealed that the frequency ofveterinary visits was associated with multiple factorsScientific Reports1735RUMINANTScall fee per veterinary visit, 40; hourly veterinary fee, 160/h; only pregnancy examinations were performedduring each visit; each pregnancy examination took 1minute to perform; and each cow calved and was examined for pregnancy once/y.The respective associations between the likelihoodthat a herd manager would call a veterinarian to examine a sick cow and the various farm variables were evaluated with χ2 analyses. For Wisconsin farms, all farmvariables that were unconditionally associated with thelikelihood that a herd manager would call a veterinarian to examine a sick cow were included in an MCA.χ2 analyses were performed to evaluate the respective associations between veterinary examination of atleast 1 sick cow during the retrospective and prospectivedata collection periods and the various farm variables aswell as the association between farm classification and theother types of work performed by veterinarians duringfarm visits (ie, training of farm personnel, developmentof treatment protocols, or necropsies). For each selecteddisease (clinical mastitis, foot problems, ketosis, metritis,hypocalcemia, pneumonia, or other disease), the association between farm classification and the probability thatan affected cow would be examined by a veterinarian wasevaluated by the use of generalized estimating equationswith farm included as a random effect in the model to account for clustering of disease-affected cows within farm.
Table 1—Frequency distribution (No. [%]) of organic (n 192), conventional grazing (36), and conventional nongrazing (64) dairy farms inNew York (97), Oregon (48), and Wisconsin (147) that were enrolled in a prospective case-control study to identify management factorsassociated with the frequency of veterinary usage for various explanatory variables.Farm classificationRUMINANTSVariableState locatedNew YorkOregonWisconsinTime involved in dairy farmingFew ( 15 y)Medium (15–32 y)Many ( 32 y)Herd sizeSmall (20–99 cows)Medium (100–199 cows)Large ( 200 cows)Predominant breedHolsteinJerseyOther breed or crossbredProportion of cows in third or later lactationFew (0%–34%)Medium ( 34%–50%)Many ( 50%)RHA*Low ( 5,674 kg/cow/y)Medium ( 5,674–8,960 kg/cow/y)High ( 8,960 kg/cow/y)Bulk tank SCCLow ( 130,000 cells/mL)Medium ( 130,000–280,000 cells/mL)High ( 280,000 cells/mL)Amount of grain fedNoneLow ( 3.6 kg/cow/d)Medium ( 3.6–8.2 kg/cow/d)High ( 8.2 kg/cow/d)Have pregnancy checks performedUse a nutritionistUse DHIA testingUse vaccines†Cows bred by AI exclusivelyUse written herd health records‡New cattle added to ngAll farms72 (38)24 (13)96 (50)11 (31)13 (36)12 (33)14 (22)11 (17)39 (61)97 (33)48 (16)147 (50)55 (29)93 (48)44 (23)9 (25)19 (53)8 (22)11 (17)30 (47)23 (36)75 (26)142 (49)75 (26)146 (76)25 (13)21 (11)27 (75)4 (11)5 (14)36 (56)13 (20)15 (23)209 (72)42 (14)41 (14)103 (54)21 (11)68 (35)26 (72)6 (17)4 (11)55 (86)3 (5)6 (9)184 (63)30 (10)78 (27)45 (23)85 (44)62 (32)12 (33)16 (44)8 (22)24 (38)34 (53)6 (9)81 (28)135 (46)76 (26)64 (34)111 (59)14 (7)4 (11)18 (50)14 (39)2 (3)18 (28)44 (69)70 (24)147 (51)72 (25)42 (22)95 (49)55 (29)13 (36)14 (39)9 (25)15 (23)33 (52)16 (25)70 (24)142 (49)80 (27)24 (13)60 (31)88 (46)20 (10)115 (60)88 (46)102 (53)139 (72)93 (48)183 (95)72 (38)0 (0)2 (6)13 (36)21 (58)28 (78)32 (89)25 (69)36 (100)25 (69)33 (92)20 (56)0 (0)6 (9)18 (28)40 (63)60 (94)62 (97)45 (70)63 (98)50 (78)60 (94)27 (42)24 (8)68 (23)119 (41)81 (28)203 (70)182 (62)172 (59)238 (82)168 (58)276 (95)119 (41)P value0.0020.200 0.001 0.001 0.001 0.0010.443 0.001 0.001 0.0010.021 0.001 0.0010.6470.125Organic farms were matched to each conventional farm on the basis of herd size and location, and the ratio of organic farms to conventionalfarms varied by state (3:1 for New York, 1:1 for Oregon, and 2:1 for Wisconsin) because of variations in farm demographics among the 3 states. Forvariables with 1 category, rounding may result in percentages that do not sum to 100 within a farm classification.*Data available for only 189, 36, and 64 organic, conventional grazing, and conventional nongrazing farms, respectively. †Vaccines includedcommercially prepared vaccines, autogenous vaccines, and homeopathic nosodes. ‡Herd health records included information related to reproduction such as breeding or calving records.(Figure 1). The category many veterinary visits wasclosely associated with conventional grazing. The category some veterinary visits was closely associatedwith a cluster of variables that included Holstein asthe predominant breed of cows in the herd, a low bulktank SCC, use of vaccines, having cows examined forpregnancy, use of a nutritionist, exclusive use of AIfor breeding purposes, and farms located in Wisconsin and New York. The category few veterinary visitswas loosely associated with a cluster of variables thatincluded feeding a medium amount of grain to cows,having a medium RHA, and Jersey as the predominantbreed of cows in the herd. The category no veterinaryvisits was closely associated with a cluster of variablesthat included no use of vaccines, no use of a nutritionist, not having cows examined for pregnancy, feeding alow amount of grain to cows, use of bulls for breedingpurposes, and crossbred as the predominant breed ofcows in the herd.1736Scientific ReportsRoutinely scheduled veterinary visits—For the199 study farms from which data were obtained, 80(40%) recorded 321 routinely scheduled veterinary visits during the retrospective and prospective data collection periods (Table 3). During routinely scheduled veterinary visits, reproductive work (307/321 [96%]) wasmost frequently performed followed by routine work(ie, vaccination or dehorning; 119/321 [37%]), examination and treatment of sick cows (53/321 [17%]), andconsulting (11/321 [3%]); emergency work was notperformed during any routinely scheduled veterinaryvisit. Reproductive work (P 0.001) and routine work(P 0.001) were significantly associated with farm classification. Reproductive work was more commonly performed during routine veterinary visits on conventionalnongrazing farms than during routinely scheduled veterinary visits on organic or conventional grazing farms.Routine work was more commonly performed duringroutinely scheduled veterinary visits on conventionalJAVMA, Vol 242, No. 12, June 15, 2013
grazing farms than during routine veterinary visits onorganic or conventional nongrazing farms.Of the 292 study farms, 154 (53%) reported havingno routinely scheduled veterinary visits (Table 2). Thefrequency of routinely scheduled veterinary visits rangedfrom 0.51 to 67 visits/100 cows/y and was significantlyassociated with herd size (P 0.001) and farm classification (P 0.001). Of the 209 small-sized herds (ie, 20 to99 cows), 130 (62%), 6 (3%), 41 (20%), and 32 (15%)had no, few, some, and many routinely scheduled veterinary visits, respectively. Of the 42 medium-sized herds(ie, 100 to 199 cows), 14 (33%), 8 (19%), 18 (43%), and2 (5%) had no, few, some, and many routinely scheduled veterinary visits, respe
with veterinary usage by organic and conventional dairy farms . Pamela L. Ruegg, DVM, MPVM Objective—To identify management factors associated with veterinary usage by organic and conventional dairy farms. Design—Prospective case-control study. Sample . tions regarding herd inventory and expansion (n 8), production and health (7 .