Transcription
Original ArticleSKA1/2/3 serves as a biomarker for poor prognosis in human lungadenocarcinomaCheng Chen1,2, Qiang Guo2, Yongxiang Song2, Gang Xu2, Lunxu Liu11Department of Thoracic Surgery, West China Hospital, Sichuan University, Chengdu 610041, China; 2Department of Thoracic Surgery, AffiliatedHospital of Zunyi Medical University, Zunyi 563000, ChinaContributions: (I) Conception and design: C Chen, G Xu, L Liu; (II) Administrative support: G Xu, L Liu; (III) Provision of study materials orpatients: Y Song, G Xu ; (IV) Collection and assembly of data: C Chen, Q Guo, Y Song; (V) Data analysis and interpretation: C Chen, G Xu, L Liu; (VI)Manuscript writing: All authors; (VII) Final approval of manuscript: All authors.Correspondence to: Dr. Lunxu Liu, Department of Thoracic Surgery, West China Hospital, Sichuan University, No. 37, Guoxue Alley, Chengdu610041, China. Email: lunxu liu@aliyun.com.Background: Spindle and kinetochore associated complex subunit 1/2/3 (SKA1/2/3), which stabilizedspindle microtubules attaching to kinetochore (KT) in the middle stage of mitosis, were dysregulated,and closely related to prognosis in several malignant tumors. Nevertheless, the potential clinical value ofSKA1/2/3, especially in terms of prognosis and development of NSCLC, had not been fully elucidated.Methods: ONCOMINE, GEPIA, UALCAN, TCGA, STRING and other databases were used to analyzethe expression of SKA1/2/3 in patients with lung adenocarcinoma (LUAD) and its clinical value, and toexplore the possible regulatory mechanism of SKA in the occurrence and development of LUAD.Results: In patients with LUAD, SKA1/2/3 mRNA expression level was significantly up-regulated, and AUCwas 0.9558, 0.7034 and 0.9775, respectively. Increased SKA 1/2/3 expression was associated with smoking,tissue typing, and poor prognosis in LUAD patients. Gene ontology (GO) and Kyoto Encyclopedia of Genesand Genome (KEGG) showed that SKA1/2/3 was mainly enriched in DNA replication, cell cycle, homologousrecombination, p53 signaling pathway, etc. Hub genes in protein-protein interactions are CDK1, BUB1,CCNA2, CDC20, CCNB2, CCNB1, BUB1B, AURKB, TOP2A and MAD2L1. Hub gene expression in LUADis increased, and its increased expression is related to poor prognosis of LUAD patients. Finally, the expression ofSKA1/2/3 and its correlation with clinicopathological features were verified in 30 clinical LUAD samples.Conclusions: SKA1/2/3 may serve as a potential prognostic biomarker and target for LUAD. Inaddition, SKA 1/2/3 may affect the prognosis of LUAD through DNA replication, cell cycle, homologousrecombination and p53 signaling pathway.Keywords: Spindle and kinetochore associated complex subunit (SKA); lung adenocarcinoma; prognosis;enrichment analysis; biomarkerSubmitted Nov 18, 2019. Accepted for publication Jan 02, 2020.doi: 10.21037/tlcr.2020.01.20View this article at: tionLung cancer was the most common malignancy with thehighest mortality rate in the world (1,2). However, nonsmall cell lung cancer (NSCLC), accounting for about85% of lung cancer, was a common pathological type ofprimary lung cancer, including large cell carcinoma, lungadenocarcinoma (LUAD) and lung squamous cell carcinoma Translational lung cancer research. All rights reserved.(LUSC) (2-4). Among these types, LUAD accounted forabout 40% of the incidence of lung cancer (4). In recentyears, new targeted therapies had improved the survival rateof patients with LUAD. However, the prognosis of LUADpatients was still unsatisfactory, and the 5-year survivalrate was still less than 25% (5). Therefore, it was urgent toidentify more potential molecular targets in the diagnosisTransl Lung Cancer Res 2020;9(2):218-231 http://dx.doi.org/10.21037/tlcr.2020.01.20
Translational Lung Cancer Research, Vol 9, No 2 April 2020219and treatment of LUAD to improve patient prognosis.Spindle and kinetochore associated complex subunit(SKA) was composed of three members, namely SKA1/2/3,which stabilized spindle microtubules attaching tokinetochore (KT) in the middle stage of mitosis, thusensuring the accomplishment of mitosis process (6-9).Studies had found that SKA1/2/3 were dysregulated andclosely related to prognosis in liver cancer, breast cancer,cervical cancer and other malignant tumors (10-12).In hepatocellular carcinoma (HCC) tissues, SKA1 wassignificantly upregulated, and correlated with alphafetoprotein (AFP), tumor size and TNM stage. Livercancer patients with high SKA1 expression had a worseprognosis than those with low SKA1 expression (8). Theexpression of SKA2 in breast cancer was also elevated, andthe prognosis of breast cancer patients with high SKA2 waspoor. Interference with SKA2 inhibited the proliferation,migration and invasion of breast cancer cells (9). SKA3level was increased in cervical cancer, and patients withhigh SKA3 have a poor prognosis. Overexpression ofSKA3 promoted proliferation and migration of cervicalcancer cells and accelerated tumor growth (10). Therefore,SKA1/2/3 may serve as a potential biomarker to predicttumor prognosis. Current studies had found that SKA1in NSCLC was upregulated, and related to tumor type,clinical stage and lymph node metastasis, and high SKA1promoted proliferation, metastasis and cisplatin resistanceof NSCLC cells (11). Nevertheless, the potential clinicalvalue of SKA1/2/3, especially in terms of prognosis anddevelopment of NSCLC, had not been fully elucidated.The development of microarray and RNA sequencingtechnology made RNA research an essential part ofbiomedical research. Thus, in this study, on the basisof various databases, we analyzed the expression ofSK A m e m b e r s, a n d exp l o red i ts c o rrel a ti on withclinicopathological features and prognosis, and its potentialregulatory mechanism in LUAD patients.MethodsClinical samplesTumor and adjacent non-tumorous tissues of 30 patientswith LUAD, who underwent surgical treatment in theDepartment of Thoracic Surgery, Affiliated Hospital ofZunyi Medical University from May 2018 to April 2019,were collected. This study was approved by the EthicsCommittee of the Affiliated Hospital of Zunyi MedicalUniversity. All 30 patients with LUAD signed written Translational lung cancer research. All rights reserved.informed consent and did not receive other specialtreatment before surgery.Analysis of OncomineOncomine (www.oncomine) gene expression microarraydatabase was an accessible online microarray database thathelped us understand genome-wide expression relatedresearch. Oncomine was used to analyze RNA levels ofSKA1/2/3 in LUAD. Screening criteria: P 0.0001; Multiplechange 1.5; The data type was mRNA; Analysis type:LUAD vs. normal tissue.Analysis of UALCAN and GEPIAUALCAN (ualcan.path.uab.edu) and GEPIA were opendatabases for in-depth analysis of gene expression dataof TCGA, and were applied to analyze the expressionof SKA1/2/3 and its Hub gene in LUAD and normalsamples, the correlation between SKA1/2/3 and theclinicopathological characteristics of LUAD (cancer stage,tumor grade, race, weight or stage, etc.) and its potentialprognostic value.Analysis of CbioPortalCBioPortal database (www.cbioportal.org) integrated datafrom multiple databases including the cancer genomeatlas (TCGA) and the International Cancer GenomeGonsortium (ICGC), providing cancer genome data,comprehensive analysis of genome data and clinical data.MRNA levels of SKA member (RNA Seq V2 RSEM) wasanalyzed by cBioPortal database.Biological functional analysisGene expression data of LUAD in HTSeq-FPKM weredownloaded from TCGA official website for analysis, andgene expression data of 535 patients were analyzed. The coexpressed genes of SKA1/2/3 were screened with Pearsoncorrelation coefficients ( r 0.4 and P 0.001). Geneontology (GO) and Kyoto Encyclopedia of Genes andGenome (KEGG) analysis were performed on co-expressedgenes with the package R “clusterProfiler” to explorepossible biological functions and signaling pathways affectedby SKA1/2/3 (13). GO analysis included biological process(BP), cell composition (CC) and molecular function (MF)(P 0.05 was statistically significant). TCGA gene data setwas analyzed by GSEA (14). A protein-protein interactionTransl Lung Cancer Res 2020;9(2):218-231 http://dx.doi.org/10.21037/tlcr.2020.01.20
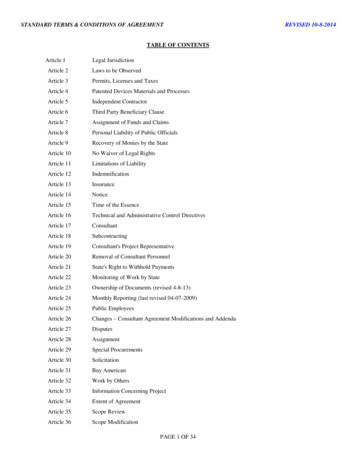
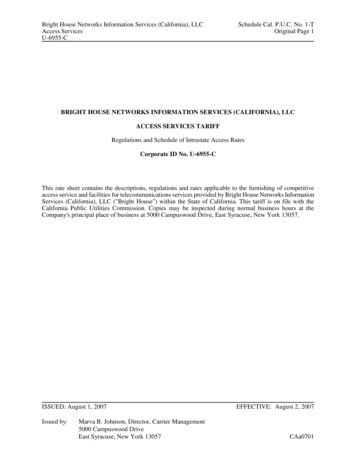
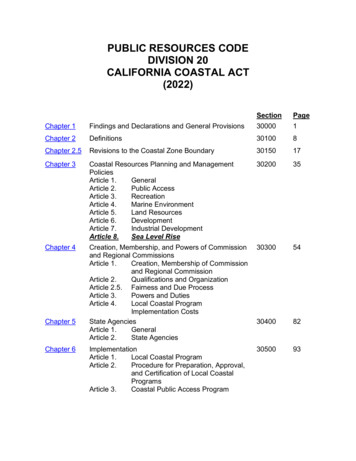
Chen et al. SKA1/2/3 was a prognosis biomarker220(PPI) network of SKA co-expressed genes were constructedusing a STRING (string-db.org) database, and combinedscore of 0.7 was considered statistically significant (15).The obtained PPI network was imported into Cytoscape3.6.1 software, and the first 10 genes were defined as hubgenes using CytoHubba plug-in as the hub gene screeningstandard (16), and relevant analysis was conducted.Quantitative real-time polymerase chain reaction (qRTPCR)Total RNA of tissues were collected according to theinstructions of Trizol kit (Invitrogen), and cDNAwas synthesized with the reverse transcription kit(Takara). The expression of SKA1, SKA2 and SKA3w a s d e t e c t e d b y q RT- P C R . G A P D H w a s u s e d a sinternal control. Primer sequences: SKA1 forward,5'-CCTGAACCCGTA AAGAAGCCT-3'; SKA1 reverse,5'-TCATGTACGAAGGAACACCATTG-3'; SKA2forward, GCCGCATTTGTGCTACTGTG; SKA2reverse, CTCTGCCGCAGTTTT CTCTT; SKA3forward, TGAGCGGTACATCGTATCCCA; SKA3reverse, GGGG TTACAATTACGGGCTCT; GAPDHforward, 5'-AACGGATTTGGTCGTATTG-3'; GAPDHreverse, 5'-GGAAGATGGTGATGGATT-3'.database, SKA1 was also overexpressed in LUAD, with foldchange of 2.633 and P value of 6.55E-5. In the Hou dataset, mRNA levels of SKA2 and SKA3 were significantlyincreased in patients with LUAD, with fold change of1.756 and 1.601, and P values of 3.61E-9 and 6.12E-12,respectively (Table 1). In addition, by means of UALCAN,CbioPortal and TCGA database, it’s found that the changerates of SKA1/2/3 mRNA in LUAD was 4%, 10% and 5%,respectively (Figure 2A), and SKA1/2/3 mRNA level waselevated in LUAD (Figure 2B), and the AUC was 0.9558,0.7034 and 0.9775, respectively (P 0.05) (Figure 3).High SKA1/2/3 was closely related to smoking, tissuesubtypes and prognosis of LUAD patientsIn the UALCAN database, high SKA1/2/3 was correlatedwith clinicopathological features and prognosis of LUADpatients. High SKA1 was related to age, gender, smoking,lymph node metastasis and tissue subtypes. High SKA2 wassignificantly associated with smoking and tissue subtypes.High SKA3 was significantly linked to smoking, clinicalstage, lymph node metastasis and tissue subtypes (P 0.05,Table 2). In addition, LUAD patients with high SKA1/2/3expressions had a worse prognosis than those with lowexpression (P 0.01, Figure 4).Statistical analysisCo-expressed genes of SKA1/2/3SPSS 20.0 software was used for statistical analysis,and GraphPad Prism 5 software was used for graphing.Normally distributed measurement data are expressedas mean standard deviation (x s), t-test was performedfor the intergroup comparison; The paired sample t testwas used to compare the values of the same individual atdifferent time points. Rank sum test was used to comparethe measurement data groups that did not conform tonormal distribution. P 0.05 was statistically significant.In TCGA transcriptome database, there were 875positively correlated genes and 343 negatively correlatedgenes of SKA1, 390 positively correlated genes and35 negatively correlated genes for SKA2, and 821positive and 420 negative genes for SKA3 8b212a426d6e7e5678d30c87b4/tlcr.2020.01.20-1.pdf). The top 10 coexpressed genes with positive and negative correlationof SKA1/2/3 were shown in the form of heat map(Figure 5A,B,C). In addition, Venn diagram indicated thatthere were 346 intersections of SKA1/2/3 co-expressinggenes (Figure 5D and esultsThe expression of SKA1/2/3 in LUAD was elevatedOncomine database was used to compare the mRNAlevels of SKA1/2/3 between LUAD and normal tissues.It showed that mRNA levels of SKA1, SKA2 and SKA3were up-regulated in breast, rectal, gastric and lung cancerpatients (Figure 1). Further analysis showed that SKA1 wasoverexpressed in LUAD patients in Garber database, withfold change of 2.379 and P value of 8.50E-9. In the Su Translational lung cancer research. All rights reserved.GO and KEGG analysisTo further understand the potential role of SKA1/2/3in LUAD, GO and KEGG analyses was performed onSKA1/2/3 co-expressed genes. Results revealed thatSKA1/2/3 co-expressed genes were mainly involved inTransl Lung Cancer Res 2020;9(2):218-231 http://dx.doi.org/10.21037/tlcr.2020.01.20
Translational Lung Cancer Research, Vol 9, No 2 April 2020221Cancervs.NormalSKA1Analysis Type by CancerBladder CancerCancervs.NormalSKA2Cancervs.NormalSKA31Brain and CNS CancerBreast Cancer9Cervical Cancer115119163131Colorectal Cancer91Esophageal CancerGastric Cancer2 2 11Head and Neck CancerKidney Cancer13Leukemia1 21Liver Cancer1Lung Cancer6 3 3Lymphoma13MelanomaMyelomaOther Cancer2Ovarian Cancer4111Pancreatic CancerProstate CancerSarcoma134Significant Unique AnalysesTotal Unique Analyses151010527433417752911871%Figure 1 The expression of SKA1/2/3 in Oncomine database in various tumors. Note: red represents up-regulation of the target gene, whileblue represents down-regulation of the target gene. Threshold parameter: P value is 1E-4, multiple change is 1.5. SKA1/2/3, spindle andkinetochore associated complex subunit 1/2/3.Table 1 The expression of SKA1/2/3 in LUAD in Oncomine databaseNameTypes of LUAD vs. normalFold changet-testP valueReferenceSKA1Lung adenocarcinoma vs. normal2.3797.5218.50E-9GarberLung adenocarcinoma vs. normal2.6334.1336.55e-5SuSKA2Lung adenocarcinoma vs. normal1.7566.7373.61E-9HouSKA3Lung adenocarcinoma vs. normal1.6018.1566.12E-12HouSKA, spindle and kinetochore-associated; LUAD, lung adenocarcinoma. Translational lung cancer research. All rights reserved.Transl Lung Cancer Res 2020;9(2):218-231 http://dx.doi.org/10.21037/tlcr.2020.01.20
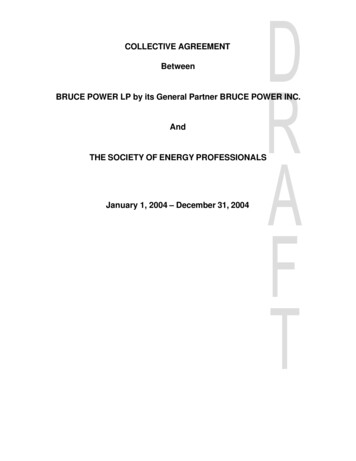
Chen et al. SKA1/2/3 was a prognosis biomarker222ASKA1 4%SKA2 10%SKA3 5%SKA1SKA3SKA2Genetic AlterationmRNA High No alterationsB12.5107.552.50 2.5Normal (n 59)Expression of SKA2 in LUADbased on Sample types60***Transcript per millionTranscript per million3 3Expression of SKA1 in LUADbased on Sample types50403020100Primary tumor (n 515)Normal (n 59)Expression of SKA3 in LUADbased on Sample types12.5***Transcript per millionExpression HeatmapPrimary tumor (n 515)***107.552.50 2.5Normal (n 59)Primary tumor (n 515)Figure 2 Expression of SKA1/2/3 in LUAD patients. (A) Expression of SKA1/2/3 in cBioPortal database in LUAD; (B) expression of SKA1/2/3in Ualcan database. ***, P 0.001. SKA1/2/3, spindle and kinetochore associated complex subunit 1/2/3; LUAD, lung 0P 0.001AUC 0.9558SKA1Reference line200C100020406080100%-Specificity%1006040P 0.001AUC 0.7034SKA2Reference %1006040P 0.001AUC 0.9775SKA3Reference line200020406080100%-Specificity%100Figure 3 The diagnostic value of SKA1/2/3 in LUAD patients. (A) SKA1; (B) SKA2; (C) SKA3. SKA1/2/3, spindle and kinetochoreassociated complex subunit 1/2/3; LUAD, lung adenocarcinoma.Table 2 The relationships between SKA1/2/3 expression and clinicopathological features in LUAD patients in the UALCAN databaseClinicopathologic featuresSKA1 (P value)SKA2 (P value)SKA3 (P value)3.63E-02NSNS1.96E-03NSNSAge41–60 vs. 61–80 yrsGenderMale vs. femaleTable 2 (continued) Translational lung cancer research. All rights reserved.Transl Lung Cancer Res 2020;9(2):218-231 http://dx.doi.org/10.21037/tlcr.2020.01.20
Translational Lung Cancer Research, Vol 9, No 2 April 2020223Table 2 (continued)Clinicopathologic featuresSKA1 (P value)SKA2 (P value)SKA3 (P value)Stage1 vs. stage2NSNS3.29E-02Stage1 vs. stage3NSNS2.10E-02Smoker vs. reformed smoker19.38E-086.12E-037.06E-07Smoker vs. reformed smoker21.56E-02NSNSReformed smoker1 vs. Reformed smoker27.562E-053.58E-032.00E-05NOS vs. mixed5.78E-044.12E-021.51E-02NOS vs. LBC-nonmucinous3.05E-04NSNSNOS. vs. LBC-mucinous1.62E-12NS 1E-12NOS vs. mucinous carcinoma5.81E-047.10E-07NSNOS vs. papillaryNS3.77E-04NSMixed vs. LBC-nonmucinousNSNS2.30E-022.19E-07NS1.21E-10Mixed vs. mucinous carcinomaNS2.04E-05NSClearCell vs. LBC-nonmucinousCancer stageSmokingTissue subtypeMixed vs. LBC-mucinous4.09E-02NSNSClearCell vs. LBC-mucinousNS7.48E-03NSClearCell vs. mucinous carcinomaNS4.28E-054.81E-02ClearCell vs. .64E-02NS6.00E-03NS4.78E-03NSSolid pattern predominant vs. LBC-mucinous2.560E-03NS4.90E-03Solid pattern predominant vs. mucinous carcinoma4.58E-04NS2.24E-02Solid pattern predominant vs. mucinous6.20E-03NS1.74E-02Solid pattern predominant vs. micropapillary6.70E-03NSNSAcinar vs. LBC-mucinous2.32E-03NS2.14E-03LBC-nonmucinous vs. solid pattern predominantLBC-nonmucinous vs. acinarLBC-nonmucinous vs. LBC-mucinousLBC-nonmucinous vs. mucinous carcinomaAcinar vs. mucinous carcinomaNS1.56E-03NSLBC-mucinous vs. mucinous carcinoma4.17E-02NSNSLBC-mucinous vs. papillary3.32E-03NS6.84E-032.45E-05NSNSLymphatic metastasisN0 vs. N3SKA, spindle and kinetochore-associated; LUAD, lung adenocarcinoma; Nos, lung adenocarcinoma-not otherwise specified; Mixed,lung adenocarcinoma mixed subtype; Clear cell, lung clear cell adenocarcinoma; LBC-nonmucinous, lung bronchioloalveolar carcinomanon mucinous; Solid pattern predominant, lung solid pattern predominant adenocarcinoma; Acinar, lung acinar adenocarcinoma;LBC-mucinous, lung bronchioloalveolar carcinoma; Mucinous, mucinous (colloid) carcinoma; Papillary, lung papillary adenocarcinoma;Mucinous, lung mucinous adenocarcinoma; Micropapillary, lung micropapillary adenocarcinoma. Translational lung cancer research. All rights reserved.Transl Lung Cancer Res 2020;9(2):218-231 http://dx.doi.org/10.21037/tlcr.2020.01.20
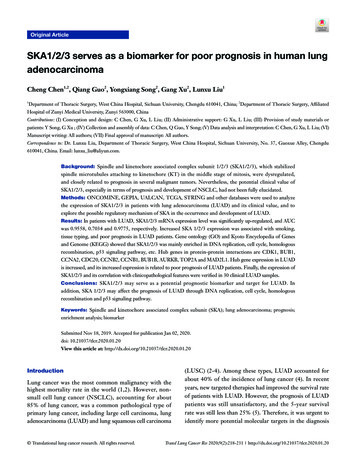
Chen et al. SKA1/2/3 was a prognosis biomarker2240.6Low SKA2 TPMHigh SKA2 TPMLogrank P 0.0088HR(high) 1.5P(HR) 0.0091n(high) 239n(low) 2390.80.40.2COverall survival1.00.60.40.20.050100150Months200250Low SKA3 TPMHigh SKA3 TPMLogrank P 2.1e-05HR(high) 1.9P(HR) 2.9e-05n(high) 239n(low) 2390.60.40.20.00Overall survival1.00.8Percent survivalLow SKA1 TPMHigh SKA1 TPMLogrank P 0.00043HR(high) 1.7P(HR) 0.00051n(high) 239n(low) 2390.8Percent survivalBOverall survival1.0Percent 0250Figure 4 The relationship of SKA1 (A), SKA2 (B), SKA3 (C) with OS in LUAD patients in GEPIA database. SKA, spindle and CBUB1BCDCA8CCNA2KIF23CENPAC1 6orf89C1orf116CRY2ADGRF5SEL 1MCM6BRIP1SUMO2KPNA2TOP2ARBL AECALCOCO1NOSTRINKCNQ1861Type42postivenegative010 2SELENBP110 07346161SKA3CorGene765SKA1CorGeneFigure 5 The top 10 genes with positive and negative co-expression of SKA1 (A), SKA2 (B), SKA3 (C) in TCGA database according to Heatmap and Venn map. (D) Intersection co-expression genes of SKA1/2/3. Note: r 0.4 and P 0.001. SKA, spindle and kinetochore-associated. Translational lung cancer research. All rights reserved.Transl Lung Cancer Res 2020;9(2):218-231 http://dx.doi.org/10.21037/tlcr.2020.01.20
Translational Lung Cancer Research, Vol 9, No 2 April ATPase activityATPase activity, coupled75DNA-dependent ATPase activity100DNA secondary structure bindingsingle- stranded DNA-dependent ATPase activity0.050.025 0.050 0.075GeneRatioDDNA replicationnuclear divisionp.adjust1e-0750ATPase activitycatalytic activity, acting on DNADNA-dependent ATPase activitydamaged DNA bindingsingle-stranded DNA-dependent ATPase activityC40CCCountCount20chromosomal regioncondensed chromosomechromosome, centromeric regionkinetochorecondensed chromosome, centromeric regionCCchromosomal regionspindlecondensed chromosomechromosome, centromeric regionkinetochoreorganelle fissionnuclear divisionchromosome segregationDNA replicationmitotic nuclear divisionBPBPDNA replicationnuclear divisionchromosome segregationmitotic nuclear divisionDNA-dependent DNA replication0.10 0.15GeneRatio3e-070.20organelle fissionnuclear divisionmitotic nuclear divisionDNA-dependent DNA e segregation20mitotic nuclear division40chromosomal regioncondensed chromosomechromosome, centromeric regionkinetochorecondensed chromosome, centromeric region60608.0e-08chromatin bindingATPase activityATPase actity, coupledDNA-dependent ATPase activitysingle-stranded DNA-dependent ATPase just4.0e-0840ATPase activitycatalytic activity, acting on DNADNA-dependent ATPase activitydamaged DNA bindingdamaged DNA bindingCountDNA replicationCCCCchromosomal regionspindlecondensed chromosomechromosome, centromeric regionkinetochorep.adjustBPBPchromosome segregation1.6e-070.10 0.15 0.20GeneRatioFigure 6 GO analysis of SKA1 (A), SKA2 (B), SKA3 (C) co-expression genes, and intersection co-expression genes among with SKA1/2/3 (D).GO, Gene ontology.organelle division, DNA replication and mitosis (Figure 6and e6dd8ccb644a9d5db89d11d50/tlcr.2020.01.20-3.pdf). KEGGpathway analysis displayed that SKA1/2/3 co-expressed geneswere enriched in regulating cell cycle, DNA replication andp53 signaling pathway (Figure 7 and Tables S1-S4). Theseresults suggested that SKA1/2/3 worked by participating incell cycle, DNA replication and p53 signaling pathway inLUAD.Analysis of Hub genes through PPI networkPPI network analysis showed the representative 10 Hubgenes were CDK1, BUB1, CCNA2, BUB1B, CCNB2,CDC20, CCNB1, AURKB, TOP2A and MAD2L1(Table 3). GEPIA analysis demonstrated that CDK1, BUB1,CCNA2, CDC20, CCNB2, CCNB1, BUB1B, AURKB, Translational lung cancer research. All rights reserved.TOP2A and MAD2L1 were increased in LUAD (P 0.05)(Figure 8), and related to the overall survival (OS) of LUADpatients (Figure S1). Additionally, CDK1, BUB1, CCNB1,CCNB2, BUB1B and AURKB were significantly relatedto the disease-free progression (DFS) of LUAD patients(Figure S2).Verification of SKA1/2/3 mRNA expression in LUADtissue samplesThe mRNA of SKA1/2/3 in 30 human LUAD and noncancerous tissues were detected by qRT-PCR, andthe correlation between their expressions with clinicalpathological features were analyzed (Table 4). Amongthem, SKA1 expression was increased in 22 of the 30LUAD tissues (P 0.05). The mRNA levels of SKA2 andSKA3 were increased in 18 LUAD tissues, but there wereTransl Lung Cancer Res 2020;9(2):218-231 http://dx.doi.org/10.21037/tlcr.2020.01.20
Chen et al. SKA1/2/3 was a prognosis biomarker226Ap.adjustCell cycleSpliceosomeDNA replication1e-07Oocyte meiosis15400.083035p.adjust2e-07Oocyte meiosis404e-0750DNA replication0.20Cell cycle30RNA transport0.10 0.15GeneRatioD20DNA replicationp.adjustFanconi anemia pathway250.05CountCell cycle20Mismatch repair50CCount10Homologous recombination300.04 0.06GeneRatio3e-07Fanconi anemia pathway20Mismatch repair2e-07DNA replicationCountHomologous recombinationp.adjustCell cycle5.0e-071.0e-061.5e-062.0e-062.5e-06RNA transport0.02B6e-07CountFanconi anemia pathway151e-062e-06 Progesterone- mediated oocyte maturation3e-064e-06Homologous recombination5e-06Homologous recombinationMismatch repair0.020.04 0.06 0.08Gene Ratio202530350.100.150.20Gene RatioFigure 7 KEGG pathway enrichment analysis of SKA1 (A), SKA2 (B), SKA3 (C) co-expression genes, and intersection co-expression genesamong with SKA1/2/3 (D). SKA, spindle and kinetochore associated complex subunit. KEGG, Kyoto Encyclopedia of Genes and Genome.Table 3 The correlations between the representative 10 Hub genes with SKA1/2/3 in LUAD patientsGene symbolGene descriptionDegreeSKA1 (r)SKA2 (r)SKA3 (r)CDK1Cyclin-dependent kinases 11780.8190.5850.852BUB1Budding uninhibited by benzimidazoles 11550.8560.5730.873CCNA2Cyclin A21530.8630.5380.895BUB1BBUB1 mitotic checkpoint serine/threonine kinase B1470.8670.4860.865CCNB2Cyclin B21470.8610.5510.875CDC20Cell division cycle 201470.8450.5140.846CCNB1Cyclin B11470.8320.5080.838AURKBAurora kinase B1420.8280.4870.835TOP2AUbiquitin conjugating enzyme E2C1410.8090.6280.809MAD2L1MAD2 mitotic arrest deficient-like 11380.820.520.842SKA, spindle and kinetochore-associated; LUAD, lung adenocarcinoma; r, correlation coefficient. Translational lung cancer research. All rights reserved.Transl Lung Cancer Res 2020;9(2):218-231 http://dx.doi.org/10.21037/tlcr.2020.01.20
Translational Lung Cancer Research, Vol 9, No 2 April AD(num(T) 483; num(N) 59)CDK1FLUAD(num(T) 483; num(N) 59)BUB1GLUAD(num(T) 483; num(N) 59)CCAN2HLUAD(num(T) 483; num(N) 59)BUB1BIJ888764534544433332212LUAD(num(T) 483; num(N) 59)CDC20552266657767LUAD(num(T) 483; num(N) 59)CCNB210LUAD(num(T) 483; num(N) 59)CCNB1LUAD(num(T) 483; num(N) 59)AURKBLUAD(num(T) 483; num(N) 59)T0P2ALUAD(num(T) 483; num(N) 59)MAD2L1Figure 8 Hub gene expression was increased in LUAD in GEPIA database. The expressions of CDK1 (A), BUB1 (B), CCAN2 (C), BUB1B(D), CCNB2 (E), CDC20 (F), CCNB1 (G), AURKB (H), TOP2A (I), and MAD2L1 (J) were shown. LUAD, lung adenocarcinoma.no statistical significance. The mRNA levels of SKA1was significantly correlated with the gender and smokinghistory, that of SKA2 was significantly related to theage, and that of SKA3 was significantly associated withsmoking history and lymph node metastasis in LUADpatients.DiscussionSeveral studies had shown that SKA1/2/3 were not onlyinvolved in mitosis, but also in apoptosis and tumordevelopment. Abnormal expression or activation ofSKA1/2/3 was a common phenomenon in malignancies, andit’s demonstrated that SKA was significantly associated withmalignancy. SKA1 was upregulated in salivary adenoid cysticcarcinoma (SACC), and SKA1 overexpression was positively Translational lung cancer research. All rights reserved.correlated with advanced SACC and its histologicalmorphology, tumor recurrence, nerve invasion andsurvival time (16). Knockdown of SKA1 inhibited SACCprogress (17). SKA1 expression was elevated in NSCLC,and high SKA1 expression contributed to the tumorprogression and increasing of malignancy. Increasedexpression of SKA1 also promoted proliferation andmetastasis of NSCLC cells. In addition, SKA1 leaded tocisplatin resistance in NSCLC cells and inhibited tumor cellapoptosis through ERK1/2 and AKT-mediated signalingpathways (18).SKA was an essential component of motor-bindingmicrotubules. Abnormal expression of SKA caused defects inspindle detection points, and it played a critical role in cellcycle regulation and tumor occurrence and development.SKA1 expression was elevated in salivary adenoid cysticTransl Lung Cancer Res 2020;9(2):218-231 http://dx.doi.org/10.21037/tlcr.2020.01.20
Chen et al. SKA1/2/3 was a prognosis biomarker228Table 4 The relationships between SKA1/2/3 with clinicopathological parameters in LUAD patientsClinicopathologicalparametersNSKA1 expression (2 ΔCq)Mean SDTissueP valueSKA2 expression (2 ΔCq)Mean SD0.023P valueSKA3 expression (2 ΔCq)Mean SD0.6800.488Normal301.22 0.213.52 0.633.94 0.76Tumor302.03 0.393.74 0.614.65 1.12Gender0.0240.1980.678Male90.99 0.332.53 0.573.92 2.80Female212.47 0.524.26 0.824.96 1.11Age (years)0.2520.0460.495 55112.63 0.705.64 1.275.68 1.87 55191.68 0.472.63 0.484.06 1.41Smoking0.0020.3400.004No222.51 0.504.09 0.795.93 1.43Yes80.99 0.332.76 0.591.14 0.39Tumor size (cm)0.1950.3640.757 5112.83 0.864.48 1.274.38 1.40 5191.56 0.353.31 0.632.03 0.39TNM0.9240.9730.783I142.07 0.613.76 0.954.31 0.53II–III161.99 0.533.72 0.814.95 1.65Lymphatic metastasis0.1930.4220.033No222.34 0.503.44 0.745.61 1.46Yes81.16 0.484.56 1.022.01 0.66T stage0.926P value0.8910.366T1–T2232.05 0.463.69 0.733.82 0.99T3–T471.96 0.793.89 1.127.37 3.53SKA, spindle and kinetochore-associated; LUAD, lung adenocarcinoma.carcinoma (SACC), and SKA1 overexpression was positivelycorrelated with advanced SACC and its histologicalmorphology, tumor recurrence, nerve invasion andsurvival time (17). Knockdown of SKA1 inhibited SACCprogress (19). And SKA1 level was increased in NSCLC,and high SKA1 expression contributed to tumorprogression. Increased expression of SKA1 promotedproliferation and metastasis of NSCLC cells. Furthermore,SKA1 leaded to cisplatin resistance in NSCLC cells andinhibited tumor cell apoptosis through ERK1/2 and AKT- Translational lung cancer research. All rights reserved.mediated signaling pathways (18).SKA2 was involved in mitosis and was crucial to theregulation of mitosis. In recent years, it’s found that SKA2was up-regulated in a variety of human malignant tumors.SKA2 expression was elevated in breast cancer, and wasassociated with tumor stage and lymph node metastasis.SKA2 inhibited tumor cell migration and invasion in breastcancer cells, and the markers of epithelial mesenchymaltransformation (EMT) such as fibronectin, N-cadherin, andvimentin (19), and the prognosis of breast cancer patientsTransl Lung Cancer Res 2020;9(2):218-231 http://dx.doi.org/10.21037/tlcr.2020.01.20
Translational Lung Cancer Research, Vol 9, No 2 April 2020229with high SKA2 expression was poor (12). In addition, upregulation of SKA2 reversed the inhibitory effect of miR520a-3p on proliferation, migration and invasion of gastriccancer cells and participated in the progression of gastriccancer (20).SKA3, a key member of SKA, lies in the outer layerof complex’s centromere and plays an important role inmitosis (10,21-23). It was found that SKA3 expressionwas increased in colorectal cancer (CRC), and high SKA3expression was associated with ch
UALCAN (ualcan.path.uab.edu) and GEPIA were open databases for in-depth analysis of gene expression data of TCGA, and were applied to analyze the expression of SKA1/2/3 and its Hub gene in LUAD and normal samples , the correlation between SKA1/2/3 and the clinicopathological characteristics of LUAD (cancer stage,