Transcription
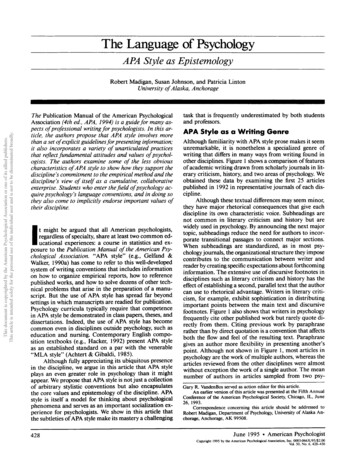
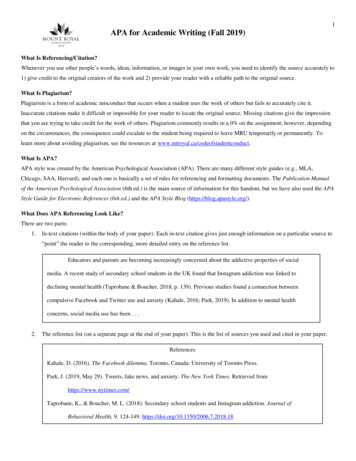
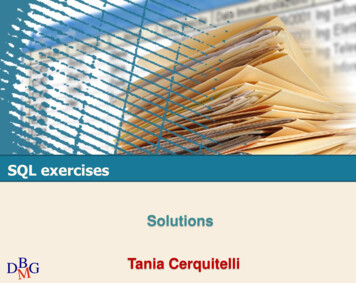
TONY E. JUNGHDFS 503L SPRING 2007How to Make an APA-Style Correlation Table Using SPSSFirst, open the data file called “Anxiety 1” by doing: File Æ Open Æ Data (To find the Anxiety 1 data file, follow the instructions I gave you last week.)Run a Bivariate Correlation by going to Analyze Æ Correlate Æ Bivariate CorrelationsSubjectAnxietyTensionScoreTrialPearson CorrelationSig. (2-tailed)NPearson CorrelationSig. (2-tailed)NPearson CorrelationSig. (2-tailed)NPearson CorrelationSig. (2-tailed)NPearson CorrelationSig. (2-tailed)NSubject Anxiety Tension Score1.869**.435** 0048.0001.00048-.884**.000481.48**. Correlation is significant at the 0.01 level (2-tailed).Move your mouse pointer over the table and then Right-Click your mouse button.Go to “SPSS Pivot Table Object” and select “Open”.This new window is called the “SPSS Pivot Table” Editor window.Click on Format Æ TableLooks 1
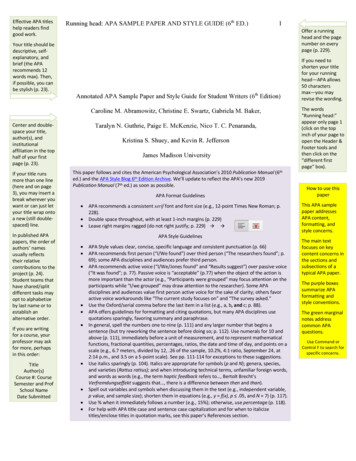
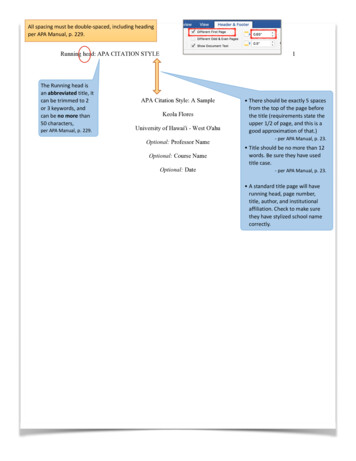
TONY E. JUNGHDFS 503L SPRING 2007In the next window, scroll down and select “Academic”, then OK.You should now see the changes made in the SPSS Pivot Table editor:2
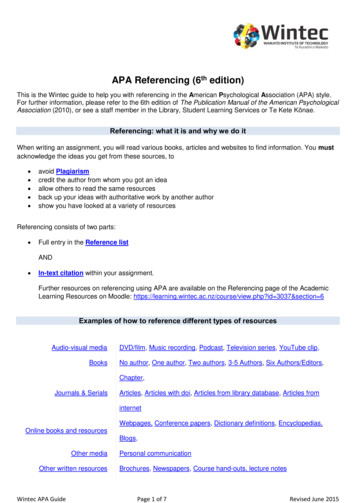
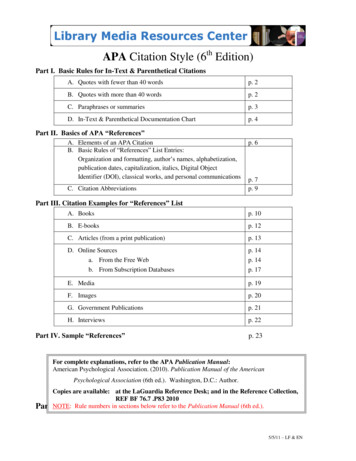
TONY E. JUNGHDFS 503L SPRING 2007Although this looks closer to APA-style, it’s not quite there yet. Let’s make more changes.Click on Format Æ Table Properties You should now see:Change “Maximum width” of labels to “120”. Then, click on the “Cell Formats” tab.3
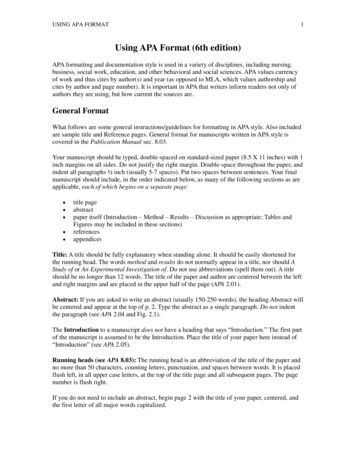
TONY E. JUNGHDFS 503L SPRING 2007Now change everything to Times New Roman and 12-Point font and flushed-left. Go to thenext “Area” and do the same thing. Keep doing this until you have changed all “areas”:After making the changes, click on the “Borders” tab:4
TONY E. JUNGHDFS 503L SPRING 2007In this window, change borderline size:You need to change the following borders to the smallest line. [It’s the one right after (None)]:“Top inner frame”“Bottom inner frame”“Data area top”Click (None) for “Horizontal dimension border”Click OK.You should now see the Pivot Table editor again:5
TONY E. JUNGHDFS 503L SPRING 2007Now, let’s permanently save this design as a template Go to Format Æ TableLooks Click on “Save As” and save it to your personal folder. Name it whatever, e.g. “APA Table”.After saving it, click on OK .6
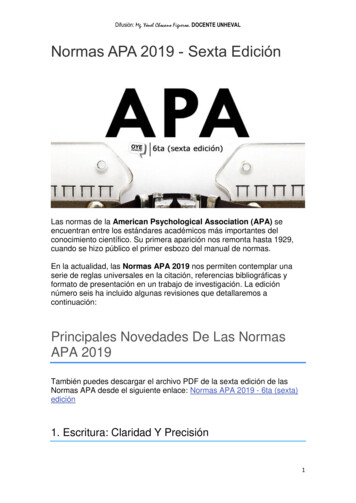
TONY E. JUNGHDFS 503L SPRING 2007Now, let’s make this new APA design the SPSS default output.Go to: Edit Æ Options Then click on the Pivot Tables tab:Click on Browse and find the file you saved the template as and open it.Click OK. Now, your default output will be your new APA-style table. Try running theBivariate Correlation again.7
TONY E. JUNGHDFS 503L SPRING 2007Exporting Table to Microsoft WordBefore we put the table into a Word document, let’s clean it up a bit. Remember, APA-style issupposed to be simple and clean:Click here toshrink themarginsHere’s the final edit:Go ahead and click on the “X” to close the SPSS Pivot Table window.8
TONY E. JUNGHDFS 503L SPRING 2007Now, you should be back at the Output view. Right-click mouse and Copy the new chart.Open Microsoft Word.Click on Edit Æ Paste.It may first look quite ugly like this:Adjust the lines, adjust the column sizes.Remove the parentheses () around the asterisk *.Now you might see something like this:9
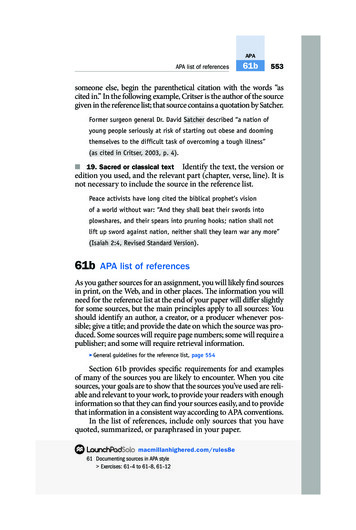
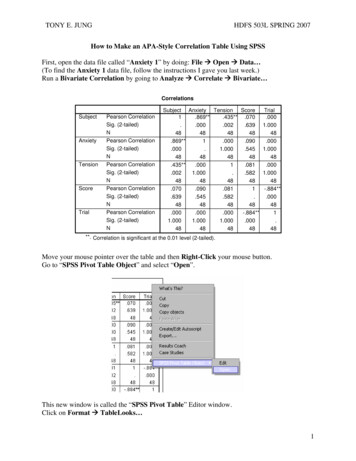
TONY E. JUNGHDFS 503L SPRING 2007Now, erase the upper-right side correlations and replace the 1’s with underline ( ).Now you should see this:Now, just highlight everything with your mouse and click Flush-Left, then capitalize first letterof each variable, and then give it a title, like “Table 1” and “Correlations Among StudyVariables”. Italicize the title and the “p” for the correlation. Then double-space the table:Final Product:Table 1.Correlations Among Study VariablesSubject Anxiety Tension Score TrialAs a general rule,always roundnumbers to 2decimal places.Please seeadditionalhandout:“ReportingNumbers in e.07.09.08Trial.00.00.00-.88****p .01.10
Now, let's make this new APA design the SPSS default output. Go to: Edit Æ Options Then click on the Pivot Tables tab: Click on Browse and find the file you saved the template as and open it. Click OK. Now, your default output will be your new APA-style table. Try running the Bivariate Correlation again.