Transcription
Business AdministrationLecture No. 14: Quality and Its Control (2)1.Concept of Quality Control2.Inspection and "Building Quality Into Product"3.Design of Inspection Process4.Concept and Practice of TQCTakahiro FujimotoDepartment of Economics, University of TokyoThe figures, photos and moving images with ‡marks attached belong to their copyright holders. Reusingor reproducing them is prohibited unless permission is obtained directly from such copyright holders.
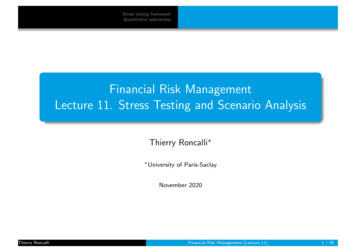
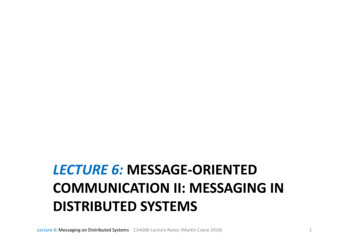
Higher a cognizedquality, the higher aprofitability is.Recognized Qualityand Profitability(PIMS data)Hypothesis:high quality high share high price low relative cost high profitabilityReference:PIMS PrincipleHigher a recognizedquality, the higher aprofitability is.Higher a relative share, thehigher a profitability is.
1. Concept of Quality ControlHistory of quality controlStatistical Quality Control (SQC)--- established along with a mass production structurein USA in 20th century1924: Control chart by Schewhart with Bell Research Center1940 - 1950: Development of SQC in USAPost War: quality control seminars (CCS) by GHQ(Japan visits and coaching by Deming and Juran)1960s: TQC in Japan, technique's ramification and refinement inUS companies
Quality Control is :・ Total quality control ・・・ ”TQ・C”・ Design quality control ・・・ product development per se・ Conformance quality control・・・ being "quality control" normally at job siteconformance quality control at total-company levelbeing called TQC (T・QC)or, "CWQC" (Company-Wide Quality Control)
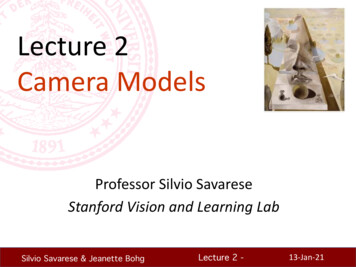
Control ・・・ PDCA Cycle (Plan-Do-Check-Action)41ActionPlan32CheckDo
2. Inspection and "Building Quality Into Product“Step by step, trace back to the source point of"design information flow" to prevent defects.(1) no inspection(2) shipping inspection(3) receiving inspection/in-process inspection(4) feedback of defect information, and improvement(5) one-by-one production(6) self inspection(7) prevention of defect(8) product design resistant to noises
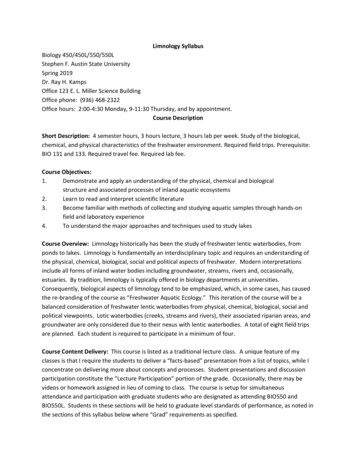
information flowInspection and Quality Building1 No Inspectionproduct (Mono) flow・work(processed product)‡Takahiro Fujimoto 'Introduction to Production Management' Nihon Keizai Shimbun, Inc. 2001 (Ⅰp267 figure.7.9)
Inspection and Quality Building2 Shipping Inspectioninformation flowproduct (Mono) flow・work(processed product)‡Takahiro Fujimoto 'Introduction to Production Management' Nihon Keizai Shimbun, Inc. 2001 (Ⅰp267 figure.7.9)
Inspection and Quality Building3 Receiving Inspection/InProcess Inspectioninformation flowproduct (Mono) flow・work(processed product)‡Takahiro Fujimoto 'Introduction to Production Management' Nihon Keizai Shimbun, Inc. 2001 (Ⅰp267 figure.7.9)
Inspection and Quality Building4 Feedback and QualityImprovementinformation flowproduct (Mono) flow・work(processed product)‡Takahiro Fujimoto 'Introduction to Production Management' Nihon Keizai Shimbun, Inc. 2001 (Ⅰp268 figure.7.9)
Inspection and Quality Building5 One-By-One Productioninformation flowproduct (Mono) flow・work(processed product)‡Takahiro Fujimoto 'Introduction to Production Management' Nihon Keizai Shimbun, Inc. 2001 (Ⅰp268 figure.7.9)
Inspection and Quality Building6 Self Inspectioninformation flowproduct (Mono) flow・work(processed product)‡Takahiro Fujimoto 'Introduction to Production Management' Nihon Keizai Shimbun, Inc. 2001 (Ⅰp268 figure.7.9)
Inspection and Quality Building7Defect Preventioninformation flowproduct (Mono) flow・work(processed product)‡Takahiro Fujimoto 'Introduction to Production Management' Nihon Keizai Shimbun, Inc. 2001 (Ⅰp269 figure.7.9)
Inspection and Quality Building8 Noise-Resistant Designinformation flowproduct (Mono) flow・work(processed product)‡Takahiro Fujimoto 'Introduction to Production Management' Nihon Keizai Shimbun, Inc. 2001 (Ⅰp269 figure.7.9)
3. Design of Inspection ProcessInspection to judge each item by good or failure,by comparing results of testing in some way,against a quality judgment criteriaor, to judge each lot by qualified or disqualifiedcomparing against a lot judgment criteria
Classification by Inspection Target(1) Receiving inspection --- purchased material, parts(2) In-process inspection --- in-process products(3) Shipping inspection --- finished product(a) Individual-unit inspection(b) Lot-unit inspection (inspection of samples only)
Classification by Measured Data for Inspection(1) Counting inspection---- discretely judge product by good or bad(2) Metric inspection---- measure product attribute as continuous quantitymeasure defect rate by its distribution and toleranceClassification by way of handling defectsscrap, recycle, re-work (amend), other
Classification by Frequency/Density of Inspection(1) Total inspection(2) Inspection of first and last samples of a lot(3) Random inspection (counting model)Extract n units from lot (N).When the number of defects exceeds a qualification judgment criteria,that entire lot is judged disqualified,and when the same number is below the same criteria,the whole lot is judged qualified.(4) Inspection by control chart (metric extraction inspection)Control chart to differentiate a trouble cause from an accidental causeFocus on improving the former
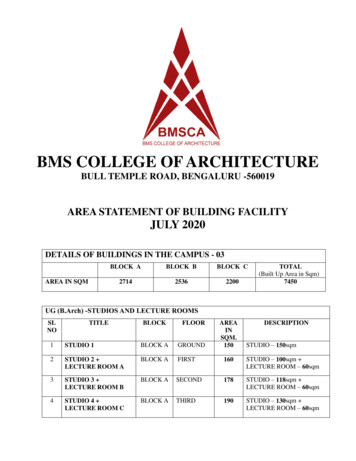
Method of Counting Extraction InspectionLot Nreal defect ratio pmeasuredgood productsampling nn - xreal good productN - pNrandom samplingmeasurementreal defect product pNmeasurementxYozo Mukawa 'Quality Control for Cotowaricou Student and Engineer' JUSE Press, Ltd. 1977 (p.86)measureddefectproduct x‡
Example of x-R Control Chart (filling quantity of powder: in unit of gram)‡Author making (reference: Yozo Mukawa 'Quality Control for Cotowaricou Student and Engineer')Reference: Takahiro Fujimoto 'Introduction to Production Mmanagement' Nihon Keizai Shimbun, Inc. 2001 (Ⅰp275)
Example of x-R Control Chartx-R control chartPC second machinerubber plate #500sample size 5averagerangelot number
x-R Control Chart --- Data Sheetsampling of 5 unitsaverage range
Inspection Design and Quality CostNo inspection--- zero inspection cost. cost corresponding to defects, only.Extraction inspection --- extraction inspection cost cost of defects accrued from a lot qualified in inspection cost of total inspection of a lot disqualified by inspectionTotal inspection--- cost of total inspection, only.zero cost corresponding to defects."defect rate unit inspection cost / unit defect cost“at break even① no inspectionC NpF② extraction inspectionC n I g (N - n) p F (1 - g) (N - n) I③ total inspectionC N・Ibreak even point for ② and ③: p I /F
Inspection Method and Quality Costinspection / defect costno inspectionextraction inspection(count selection model)total inspectionreal defect rateNote: Assuming rework cost at zero‡Takahiro Fujimoto 'Introduction to Production Management' Nihon Keizai Shimbun, Inc. 2001 (Ⅰp277 figure.7.11)
Design of Extraction Inspection --To review on a diagram the relationship between a real defect rate (p)and a lot's pass rate.(1) AQL (Acceptable Quality Level) :Reason on a maker's side insisting, "The lot is of low defect rate, andshouldn't be mistaken as disqualified." (5% as standard)(2) Producer's risk :No matter how high a reject rate of AQL-level lot is, it's better not togo beyond this level. (5% as standard)(3) LTPD (Lot Tolerance Percent Defective) :To pass a lot whose defect rate exceeds this criteria is not acceptablefrom a consumer stand point.(4) Consumer risk :Probability for a LTPD-level lot to be mistakenly qualified should bebelow this.
Design of Extraction InspectionProducer's risk and consumer's riskDesirable lot pass rate to producer合格率pass rate100%100%producer's riskpass rateconsumer's risk0p0 AQL0preal lot defect ratep0 p1 AQL LTPDSet c and n100%producer's riskpDesirable lot pass rate to consumerpass ratepass rate100%100%OC curveconsumer's risk0Pr(x c)p0 AQLp1 LTPDpextract n unitqualified when defect xis less than c unit0p1 LTPDpreal lot defective rate0Choose n and cto settle OC curve like thisp‡Takahiro Fujimoto 'Introduction to Production Management' Nihon Keizai Shimbun, Inc. 2001 (Ⅰp278 figure.7.12)
Operating Characteristic Curve (OC Curve)When real defect rate extracts n unit from universe p ,probability Pr (x) at which x unit of defect is mixed follows binomial distribution.When a rule is to pass a lot having number of defects below c unit,pass rate Pr (x c) can be expressed in cumulative probability of binomialdistribution.This pass rate curve (cumulative probability of binomial distribution) is "OC curve".When n and c are set, so is a shape of OC curve.Conversely, when AQL, LTPD, producer's risk, and consumer's risk are determined,OC curve to pass 2 points [(AQL, producer's risk) and (LTPD, consumer's risk)],and corresponding n and c are determined.
Sample Size (n) and Shape of OC Curvereject rate of lotpass rate of lotdefect rate of lot‡Hideo Kuwata 'Production Management Outline' THE NIKKAN KOGYO SHIMBUN,LTD. 1998
4. Concept and Practice of TQC(1) Traditional SQC --To emphasize optimization of inspection design(assuming certain level of defect rate)control chart, extraction inspection, test plan, etc.(2) Production thought like JIT/TQ --- Improvement of process capabilityTo emphasize "building quality into product", "in-process total inspection"(1) not to accrue a defect in the first place(2) no to accrue a defect outside of the station(3) to grasp defect outside of the station as early as possible(4) to find and improve a basic cause of the defect swiftly
TQC (Total Company Quality Control)TQC in Japan is CWQC (Company-Wide Quality Control)Conceptually started in USA (Feigenbaum and others) expanded in JapanIts characteristics ---・ Total company activity (all layers, all departments)・ Continuous improvement (problem solving)・ Small group activity (QC circle)・ Usage of statistical method at job site ("QC 7 tools", etc.)・ emphasis on education/training・ Cross-company popular organization(Union of Japanese Scientists and Engineers, Japan Management Association,Japanese Standards Association, Japan Productivity Center)
QC CircleKind of Small Group Activity"Small group to voluntarily run a quality control activity in thesame work office"Many groups being composed of approximately 10 persons.To meet a few times a month by selecting a leader.To execute continuous improvements, all participation, byusing QC method,Presentation activity, recognition system.
QC StoryPeriodical problem-solving steps (routine)themereason for taking up a particular themegrasping status quofactor analysismeasureconfirmation of effectivenessbrake (maintaining performance, relapse prevention)issues left to be addressed and way to proceed further (follow-up)Same for MAIC method of "Six Sigma" (measure-analyze-improve-control)
QC 7 Toolspareto chart, characteristic diagram (fishbone diagram), histogram,check sheet, control chart, scatter graph, by layerIts features -(1) simple and easy to understand(2) graphic (control by eye sight)(3) problem solving/improvement orientedTools for statistical analysis should not be a monopoly of experts. Use atthe job site.
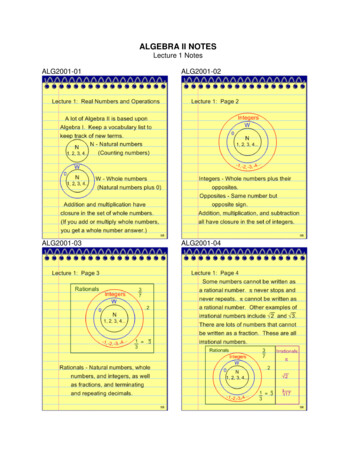
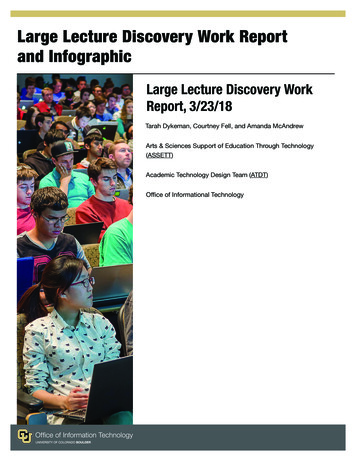
Numerical Example: Defect Accruals and Cumulative Rate (Pareto Chart)----- Over size in hole dimension is the largest problem.defect accruals / dayrate of cumulative defect accrual100%80%60%161412108642040%20%0%hole dimension hole shape hole position metal meltover-sizedirregulardisconnect rub-offdrillinghole dimensionimperfect under- sized‡Takahiro Fujimoto 'Introduction to Production Management' Nihon Keizai Shimbun, Inc. 2001 (Ⅰp287 table.7.1a figure7.14a)
Numerical Example: Distribution of Measured Value (Histogram)---- Exceeding Tolerance Over9upper limit of tolerance876degree5432109.79.89.9 10.0 10.1 10.2 10.3 10.4 10.5 10.6 10.7 10.8measured value(mm)‡Takahiro Fujimoto 'Introduction to Production Management' Nihon Keizai Shimbun, Inc. 2001 (Ⅰp288 figure.7.14c)
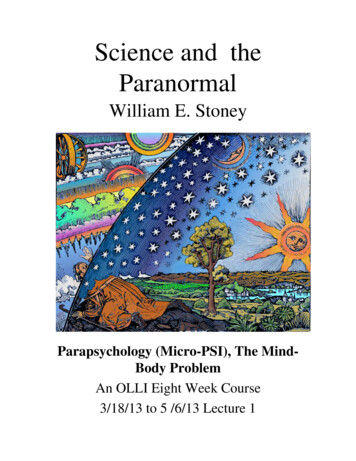
Numerical Example: x-R Control Chart ---- No Problem10.60管理図(平均値 X)n 5管理図(範囲 R)1.3 n 5UCL 10.581.210.5010.401.010.300.8X 10.2310.20UCL 1.270.6R 0.610.100.410.000.29.909.80LCL 9.880.012345 ��(n) 5観測回数10 回サンプルの平均 x の平均(x) 10.23 範囲(R)の平均(R) �差 0.6 2.326 0.26これに対応する x の上方管理限界 10.23 0.6 x 0.577 10.58これに対応する x の下方管理限界 10.23 - 0.6 x 0.577 9.88範囲(R)の上方管理限界 0.6 x 2.115 1.27係数(2.326, 0.577, 2.115)は、管理図用係数表の「n 5」の欄から引用した。‡Takahiro Fujimoto 'Introduction to Production Management' Nihon Keizai Shimbun, Inc. 2001 (Ⅰp289 figure.7.14d)
Numerical Example (by Layer): Distribution of Measured Value(Y company's steel sheet)--- Y company's product is OK.4degree2あupper limit of tolerance3109.79.89.9 10.0 10.1 10.2 10.3 10.4 10.5 10.6 10.7 10.8measured value(mm)‡Takahiro Fujimoto 'Introduction to Production Management' Nihon Keizai Shimbun, Inc. 2001 (Ⅰp290 figure.7.14e)
Numerical Example (by Layer): Distribution of Measured Value(Y company's steel sheet) --- X company's product is the problem.7upper limit of 4measured value(mm)10.510.610.710.8‡Takahiro Fujimoto 'Introduction to Production Management' Nihon Keizai Shimbun, Inc. 2001 (Ⅰp290 figure.7.14f)
Numerical Example: Factor Analysis on Lack of Precisionin Hole Diameter (Characteristic Diagram)machinework conditionfluctuation ofelectric currentmachine rattlefluctuation of ガス流量abrasion oftorch's tiplack of precisionin hole diameterrelative angel ofwork and torchrelative distance ofwork and torchdispersion ofmaterial qualitydispersion ofthick platework position fixmaterial‡Takahiro Fujimoto 'Introduction to Production Management' Nihon Keizai Shimbun, Inc. 2001 (Ⅰp291 figure.7.14g)
Numerical Example: Torch Distance and Bore Diameter Dimension (Scatter Graph)--- Certainly related10.610.5bore diameter 9.51.421.441.461.481.501.521.541.561.58torch distance(mm)‡Takahiro Fujimoto 'Introduction to Production Management' Nihon Keizai Shimbun, Inc. 2001 (Ⅰp291 figure.7.14h)
Policy ControlKind of Objective Controlcompany motto basic policy long-term policy annual policytotal company annual policy by top management(objective and measure) expansion by top-down onto each division/department/individual(policy expansion) discussion between superior and subordinaterotate PDCA cycle (TQC method)
expansion of quality policyPolicy Expansioncompanypolicydivision policyfunction policyquality policy ofsubsidiaryprocurement policyquality policy ofsuppliercost policyfactorypolicypolicy of otherfunctionspolicy of otherfunctionspolicy of other departmentspolicy of other departmentsquality controldepartment policyquality assurance division policyTakahiro Fujimoto'Introduction to Production Management‘Nihon Keizai Shimbun, Inc. 2001 (Ⅰp295 figure.7.15)quality policyNote: Boxes in gray indicate policies related to quality.Source: X Company‡
Role of Quality Assurance Division① Previously, a quality assurance division executed inspections. ② Now, a quality assurance division emphasizes functions ofplanning, operation, and organizer relative to total companyquality assurance activities.
Problems of TQCSelf-righteous activities to win Deming Prize(totalism, spirit doctrine)Losing substanceNegative effect of top-down method
From TQC to TQM (1996)Effect of TQM (Total Quality Management) started in USAIn reference to "Malcom Bordeaux ridge national quality prize”Emphasis on customer satisfaction/total qualityView of "quality of management"Directly related to management strategyEnriching problem-solving methods (Six Sigma' MAIC method)Broadened problem solving activities
"ISO 9000 Series (9001, 9002, 9003) ISO (International Organization for Standardization;an international standard established by a worldwidefederation of each national standard bodies in 1987Standards regarding to "quality system" which customers demand to supplier of aparticular product"Quality system" : documentation of steps for a series of activities, and recording ofthese activities' results, for suppliers to assure the quality of own company's products.Third-party screening/registration organizations implement screening/authorization onbehalf of customers.A system strongly reflecting Western thoughts of a contract society.To Japanese companies of TQC model, this has not provided much effectiveness inenhancing their direct competitiveness.Some appraise an effectiveness of basic motions' confirmation.However, it is perhaps unlikely that this system will play a major role in advancingquality.
2.Inspection and "Building Quality Into Product" Step by step, trace back to the source pointof "design information flow" to prevent defects. (1) no inspection (2) shipping inspection (3)receiving inspection/in-process inspection (4)feedback of defect information, and improvement (5)one-by-one production (6)self inspection (7)prevention of defect