Transcription
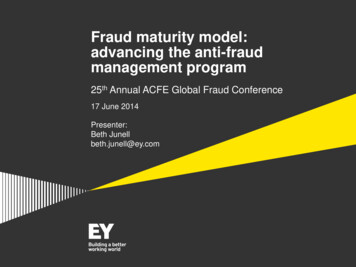
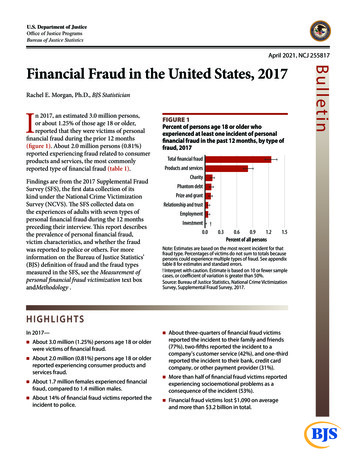
U.S. Department of JusticeOffice of Justice ProgramsBureau of Justice StatisticsApril 2021, NCJ 255817Rachel E. Morgan, Ph.D., BJS StatisticianIn 2017, an estimated 3.0 million persons,or about 1.25% of those age 18 or older,reported that they were victims of personalfnancial fraud during the prior 12 months(fgure 1). About 2.0 million persons (0.81%)reported experiencing fraud related to consumerproducts and services, the most commonlyreported type of fnancial fraud (table 1).Findings are from the 2017 Supplemental FraudSurvey (SFS), the frst data collection of itskind under the National Crime VictimizationSurvey (NCVS). Te SFS collected data onthe experiences of adults with seven types ofpersonal fnancial fraud during the 12 monthspreceding their interview. Tis report describesthe prevalence of personal fnancial fraud,victim characteristics, and whether the fraudwas reported to police or others. For moreinformation on the Bureau of Justice Statistics’(BJS) defnition of fraud and the fraud typesmeasured in the SFS, see the Measurement ofpersonal fnancial fraud victimization text boxand Methodology.FIGURE 1Percent of persons age 18 or older whoexperienced at least one incident of personalfnancial fraud in the past 12 months, by type offraud, 2017Total ÿnancial fraudProducts and servicesCharityPhantom debtPrize and grantRelationship and trustEmploymentInvestment0.0!0.30.60.91.2Percent of all persons1.5Note: Estimates are based on the most recent incident for thatfraud type. Percentages of victims do not sum to totals becausepersons could experience multiple types of fraud. See appendixtable 8 for estimates and standard errors.! Interpret with caution. Estimate is based on 10 or fewer samplecases, or coefcient of variation is greater than 50%.Source: Bureau of Justice Statistics, National Crime VictimizationSurvey, Supplemental Fraud Survey, 2017.HIGHLIGHTSIn 2017— About 3.0 million (1.25%) persons age 18 or olderwere victims of fnancial fraud. About 2.0 million (0.81%) persons age 18 or olderreported experiencing consumer products andservices fraud. About 1.7 million females experienced fnancialfraud, compared to 1.4 million males. About 14% of fnancial fraud victims reported theincident to police. About three-quarters of fnancial fraud victimsreported the incident to their family and friends(77%), two-ffths reported the incident to acompany’s customer service (42%), and one-thirdreported the incident to their bank, credit cardcompany, or other payment provider (31%). More than half of fnancial fraud victims reportedexperiencing socioemotional problems as aconsequence of the incident (53%). Financial fraud victims lost 1,090 on averageand more than 3.2 billion in total.Bul l etinFinancial Fraud in the United States, 2017
Of the 2.0 million victims of consumer products andservices fraud, about two-thirds experienced fraudwith a product (1.3 million victims) and one-thirdwith a service (560,720) (appendix table 1). About340,000 persons (0.14% of all persons age 18 or older)experienced charity fraud, in which they contributed toa bogus charitable organization or to a crowdfundingappeal under false pretenses (appendix table 2). Ofthe 296,620 victims of phantom debt fraud (0.12% ofall persons), approximately half were victims of a scamclaiming they did not pay their taxes (94,960 victims)(appendix table 3). Of the 263,690 victims of prize andgrant fraud (0.11% of all persons), the majority reporteda sweepstakes scam (90,440 victims) or government loanor grant scam (78,860) (appendix table 4).More than 155,000 persons experienced relationshipand trust fraud (0.06% of all persons), which includesa falsifed romantic relationship (49,710) or a fraudsterposing as a family member (45,440) (appendix table 5).Of the 150,460 victims of employment fraud (0.06% ofall persons), about half experienced a scam claimingto provide a business opportunity (76,990 victims)(appendix table 6). Among the fnancial fraud victims,consumer investment fraud was the least common ofthe seven types of fraud measured. All 36,010 victims ofconsumer investment fraud (0.01% of all persons) wereinvolved in scams in which they invested money with aperson or company but the investment was made up orthe money was never invested (appendix table 7).The majority of fraud victims experienced one typeof fraudAbout 95% of fraud victims, or 2.9 million persons,experienced one type of fnancial fraud (table 2). Teremaining 156,700 persons experienced two or more.TABLE 1Victims age 18 or older who experienced at least one incident of personal fnancial fraud in the past 12 months, by typeof fraud, 2017Type of fraudNumber of victims Percent of victims Percent of all personsTotal fnancial fraud3,039,200100%1.25%Products and ntom debt296,6209.80.12Prize and grant263,6908.70.11Relationship and ent36,010 !1.2 !0.01 !Standard errorNumber of victims Percent of victims Percent of all persons144,867 ,5120.510.006Note: Estimates are based on the most recent incident for that fraud type. Numbers and percentages of victims do not sum to totals because persons couldexperience multiple types of fraud.! Interpret with caution. Estimate is based on 10 or fewer sample cases, or coefcient of variation is greater than 50%. Not applicable.Source: Bureau of Justice Statistics, National Crime Victimization Survey, Supplemental Fraud Survey, 2017.TABLE 2Victims age 18 or older who experienced personal fnancial fraud, by number of fraudtypes experienced, 2017Number of fraudtypes experiencedTotal fnancial fraudOne typeTwo or more typesNumber of victims3,039,2002,882,500156,700Percent of victims100%94.85.2Standard errorNumber of victims Percent of victims144,867 141,0461.05%32,4581.04 Not applicable.Source: Bureau of Justice Statistics, National Crime Victimization Survey, Supplemental Fraud Survey, 2017.F I N A N C I A L F R AU D I N T H E U N I T E D S TAT E S , 2017 A P R I L 20212
Measurement of personal financial fraud victimizationOne of the biggest challenges to measuring financialfraud has been the lack of a clear definition of the term“fraud.” The Bureau of Justice Statistics (BJS) set out toaddress this issue in multiple ways in developing theSupplemental Fraud Survey (SFS) to the National CrimeVictimization Survey (NCVS). First, BJS worked withStanford University’s Financial Fraud Research Center(FFRC) and the Financial Industry Regulatory Authority(FINRA) Investor Education Foundation to develop afraud taxonomy for systematically classifying fraudulentacts into a definitional framework.1 The taxonomy, whichwas also largely adopted by the National Academiesof Sciences’ Modernizing Crime Statistics taxonomy,was used to identify the types of scams that the SFSwould ask about and to develop the screeningquestions accordingly.2The definition of fraud used for the fraud taxonomy, andsubsequently the SFS, includes acts that “intentionallyand knowingly deceive the victim by misrepresenting,concealing, or omitting facts about promised goods,services, or other benefits and consequences that arenonexistent, unnecessary, never intended to be provided,or deliberately distorted for the purpose of monetarygain.” The SFS measures completed fraud only anddoes not measure attempted fraud. In addition, theSFS measures only financial fraud committed against aperson and does not measure fraud committed against abusiness or commercial establishment. The seven specifictypes of fraud measured by the SFS, which also align withkey categories in the taxonomy, are listed below.The criteria used for screening a victim into the incidentreport section of the SFS instrument vary depending onthe type of fraud. For some types of fraud (for instance,charity fraud), pairing the introductory screener languagewith an affirmative response to a question (for instance,“Have you donated money to a charity or a charitablecause that later turned out to be fake or that you latersuspected was fake?”) is sufficient to demonstrate thatthe offender intended to defraud (i.e., he or she made upa fake charity or charitable cause). In the case of productsand services fraud, unless the victim actively tried to gethis or her money back and was unsuccessful, it would bedifficult to prove that the offender had not accidentallyfailed to deliver the product or service. For some fraudtypes, the SFS screener enables a range of fraud estimatesto be produced, based on an increasing likelihood thatfraud occurred and could be criminally prosecuted. Forproducts and services fraud, for example, a person isclassified as a fraud victim with an affirmative answerto the question, “Have you paid for any products orservices that you NEVER received or that turned out to bea SCAM?” and with a negative response to the follow-upquestion, “Did you get all of your money back from theperson or company WITHOUT filing a claim or takinglegal action?”Fraud typeCharityExpected benefit or outcome for victimA contribution to a charitable cause or organization.Consumer investmentA large return on an investment.Consumer products and services Obtaining the agreed-upon consumer productor service.EmploymentAcquiring a paid job.Phantom debt collectionAvoiding the consequences of failing to pay a debt thatthe victim is told he or she owes and must act on.Winning a prize, grant, lottery, or other windfallof money.Prize and grantRelationship and trustFostering or continuing a personal and sometimesintimate relationship.ExamplesBogus natural-disaster relief, law enforcementcharity scams, and personal crowdfunding sites forbogus causes.Ponzi schemes, penny stock fraud, oil and gasexploration scams, and bond fraud.Technology support scams, automotive repairscams, weight-loss product scams, and onlinemarketplace scams.Work-at-home scams, government job-placementscams, and nanny scams.Government debt-collection scams and medical-debtscams.Prize promotion and sweepstakes scams, lottery scams,fake government grant offers, and foreign princeletter scams.Friend or relative impostor scams and in-person oronline romance scams.1See Stanford Center on Longevity. (2015). Framework for ataxonomy of fraud. nomy-of-fraud/2See National Academies of Sciences, Engineering, and Medicine.(2016). Modernizing crime statistics: Report 1: Defining andclassifying crime. The National Academies Press. https://doi.org/10.17226/23492F I N A N C I A L F R AU D I N T H E U N I T E D S TAT E S , 2017 A P R I L 2021Continued on next page3
Measurement of personal fnancial fraud victimization (continued)Prevalence estimates under fve diferent defnitions offraud can be produced based on diferent criteria fordefning types of fraud. Fraud 1 includes victims whoresponded afrmatively to one or more of the screeningitems. However, for some fraud types (i.e., prize and grant,employment, investment, and products and servicesfraud), a single afrmative response was insufcientto classify respondents as fraud victims, because thescreening item alone did not demonstrate the ofender’sintent to defraud. In other words, fraud 1 includes bothvictims who screened into the incident report and victimswho did not. Fraud 2 includes all victims who screenedinto the incident report and did not get their moneyback. Fraud 3 includes all victims who screened intothe incident report (fraud 2) and also self-identifed as afraud victim when asked the question, “Thinking aboutthe same incident [the most recent incident of that type],do you think you were a victim of fraud?” Though notspecifed in a criminal statute, the criteria under whichthe victim believes the incident was fraud are importantbecause the victim is unlikely to report the incident topolice if he or she does not believe a crime occurred.Fraud 4 includes victims who met the criteria for beingclassifed as a victim, but in the case of prize and grant,employment, investment, and products and servicesfraud, the victims had to additionally confrm that theytried to get their money back from the perpetrator.Fraud 5 is more exclusive than fraud 4 in that victimsof employment fraud and products and services fraudhad to also believe that there was no chance of gettingtheir money back. The prevalence estimates and rates forthe fve defnitions of fnancial fraud are provided in thisreport (table 3). The prevalence of fnancial fraud rangesfrom 3.9 million persons (fraud 1) to 1.9 million (fraud 5).Unless otherwise noted, tables in this report use thefraud 2 defnition. This defnition was used because it ftsthe legal defnition of fraud (victims who did not receivetheir money back) and provided sufcient sample sizes toproduce prevalence estimates.TABLE 3Victims age 18 or older who reported personal fnancial fraud in the Supplemental Fraud Survey screener, by frauddefnition and type of fraud, 2017Fraud 1 defnitionaNumber PercentType of fraudof victims of victimsTotal fnancial fraud 3,909,730 1.60%Products and services 2,634,530 1.08Charity341,950 0.14Phantom debt296,620 0.12Prize and grant405,850 0.17Relationship and trust155,190 0.06Employment209,060 0.09Investment80,870 0.03Fraud 2 defnitionbNumber Percentof victims of victims3,039,200 1.25%1,982,240 0.81341,950 0.14296,620 0.12263,690 0.11155,190 0.06150,460 0.0636,010 ! 0.01 !Fraud 3 defnitioncNumber Percentof victims of 200.12263,6900.11155,1900.06150,4600.0636,010 ! 0.01 !Fraud 4 defnitiondNumber Percentof victims of victims2,308,800 0.95%1,267,440 0.52341,950 0.14296,620 0.12263,690 0.11155,190 0.06110,020 0.0536,010 ! 0.01 !Fraud 5 defnitioneNumber Percentof victims of victims1,908,040 0.78%832,240 0.34341,950 0.14296,620 0.12263,690 0.11155,190 0.0697,440 0.0436,010 ! 0.01 !Note: Estimates are based on most recent incident for that fraud type. Numbers and percentages of victims do not sum to totals because personscould experience multiple types of fraud. See appendix table 9 for standard errors.! Interpret with caution. Estimate is based on 10 or fewer sample cases, or coefcient of variation is greater than 50%.aRespondents who endorsed the initial screener item.bRespondents who endorsed the initial screener item and did not get their money back.cRespondents who endorsed the initial screener item, did not get their money back, and defned the incident as fraudulent.dRespondents who endorsed the initial screener item, did not get their money back, and tried to get their money back.eRespondents who endorsed the initial screener item, did not get their money back, tried to get their money back, and experienced no chance ofgetting their money back.Source: Bureau of Justice Statistics, National Crime Victimization Survey, Supplemental Fraud Survey, 2017.F I N A N C I A L F R AU D I N T H E U N I T E D S TAT E S , 2017 A P R I L 20214
A smaller percentage of whites were victims ofpersonal fnancial fraud than persons of other racialand ethnic groupsIn 2017, about 1.7 million females experienced personalfnancial fraud, compared to 1.4 million males (table 4).While the number of female victims of fraud wassignifcantly higher than the number of male victims,there was no statistically signifcant diference in howprevalent fnancial fraud victimization was betweenthem. A smaller percentage of white persons werevictims of fnancial fraud (1.19%) than black persons(1.67%) and persons who were Native Hawaiian or OtherPacifc Islander, American Indian or Alaska Native, ortwo or more races (2.19%).Tere were no statistically signifcant diferences in theprevalence of fnancial fraud by the victim’s age in 2017.Tere were 377,690 fraud victims ages 18 to 24, whichwas the lowest number of victims for any age group.In 2017, the prevalence of fnancial fraud varied by thevictim’s marital status. Te percentage of never-marriedpersons who experienced fraud was higher (1.35%) thanthe percentage for married persons (1.00%) but lowerthan the percentage for divorced persons (1.83%).Persons in households that earned between 50,000 and 99,999 annually had lower rates of fraud (1.02%) thanpersons in households that earned less than 50,000 orbetween 100,000 and 199,999.TABLE 4Victims age 18 or older who experienced personalfnancial fraud, by demographic characteristics, 2017Demographic characteristic Number of victims Percent of all male1,666,150 4,260 †1.67 †Hispanic449,950 †1.15124,030 †0.90AsianaOthera,b106,220 †2.19 ‡Age18–24*377,6901.28%25–34526,560 ‡1.2235–49701,810 †1.1950–64840,160 †1.3565 or older592,990 †1.18Marital statusNever married*946,1501.35%Married1,261,770 †1.00 †Widowed244,510 †1.62Divorced487,550 †1.83 †Separated89,220 †1.91Household incomeLess than 25,000715,4601.51% † 25,000– 49,999831,2301.29 ‡ 50,000– 99,999*841,8601.02 100,000– 199,999509,820 †1.34 ‡ 200,000 or more140,840 †1.22Note: Estimates are based on the most recent incident of fraud. Detailsmay not sum to totals due to rounding. See appendix table 10 forstandard errors.*Comparison group.†Diference with comparison group is signifcant at the 95%confdence level.‡Diference with comparison group is signifcant at the 90%confdence level.aExcludes persons of Hispanic origin (e.g., “white” refers to non-Hispanicwhites and “black” refers to non-Hispanic blacks).bIncludes Native Hawaiians or Other Pacifc Islanders, American Indians orAlaska Natives, and persons of two or more races.Source: Bureau of Justice Statistics, National Crime Victimization Survey,Supplemental Fraud Survey, 2017.F I N A N C I A L F R AU D I N T H E U N I T E D S TAT E S , 2017 A P R I L 20215
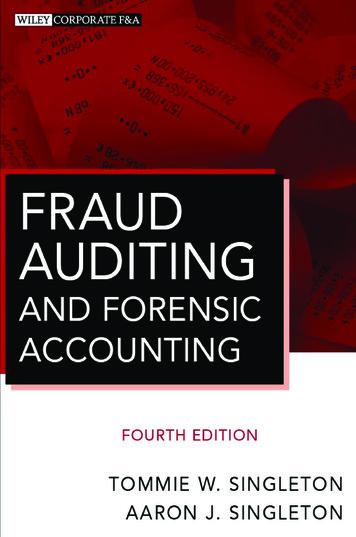
About 1 in 7 fraud victims reported the incidentto policeAbout 1 in 7 of the 3.0 million persons who experiencedpersonal fnancial fraud reported the fraud to police(14%) (table 5). Reporting of fraud to police varied bythe type of fraud experienced. About 37% of victimsof relationship and trust fraud and 31% of victims ofphantom-debt fraud reported it to police. By comparison,10% of victims of consumer products and services fraudreported the fraud to police.of the company that they interacted with, and about30% contacted their bank, credit card company, or otherpayment provider (i.e., MoneyGram or Western Union).About 12% of victims reported the fraud to a state orlocal consumer agency, such as a state attorney general’sofce or the Better Business Bureau. One in 10 victimsreported the fraud to a federal consumer agency, suchas the Federal Trade Commission, Consumer FinancialProtection Bureau, FINRA, U.S. Securities and ExchangeCommission, Internal Revenue Service, or InternetCrime Complaint Center.Victims also reported fraudulent incidents to a varietyof other persons or groups. More than 7 in 10 fnancialfraud victims reported the incident to family orfriends (77%), while 7% of victims told a lawyer (table 6).More than 40% of victims contacted the customer serviceTe majority of fnancial fraud victims reported theincident to family or friends along with another personor group (64%) (not shown in table). About 36% ofvictims only reported the incident to family or friends.TABLE 5Victims age 18 or older who reported personal fnancialfraud to police, by type of fraud, 2017TABLE 6Victims age 18 or older who reported personal fnancialfraud to select persons or groups, by type of person orgroup, 2017Type of fraudTotal fnancial fraudaRelationship and trustPhantom debtPrize and grantEmploymentProducts and services*CharityNumber of 240341,950Percent of victims whoreported to police14.0%37.0 †31.5 †17.212.7 !10.08.9 !Note: Estimates are based on the most recent incident for that fraud type.See appendix table 11 for standard errors.*Comparison group. Percentage of victims who reported to policecompared to each fraud type and not total fnancial fraud.†Diference with comparison group is signifcant at the 95%confdence level.! Interpret with caution. Estimate is based on 10 or fewer sample cases, orcoefcient of variation is greater than 50%.aInvestment fraud is excluded from this table due to too few sample casesbut is included in total fnancial fraud.Source: Bureau of Justice Statistics, National Crime Victimization Survey,Supplemental Fraud Survey, 2017.Type of person/groupaFamily/friendCompany's customer serviceBank/credit card company/otherpayment providerbState/local consumer agencycFederal consumer agencyd*LawyerSomeone elsePercent ofvictims whoreported toperson/group77.0%41.731.411.610.26.84.7Standard error1.99%2.332.191.511.431.180.99Note: Estimates are based on the most recent incident of fraud.Percentages do not sum to totals because persons could experiencemultiple types of fraud and subsequently contact multiple persons orgroups for each fraud type experienced.aNot all victims of a specifc fraud type were asked about all the diferentconsumer organizations they contacted. For more information, see theSupplemental Fraud Survey instrument.bOther payment provider includes MoneyGram and Western Union.cIncludes state or local consumer agencies, such as state attorneys generalofces and the Better Business Bureau.dIncludes the Federal Trade Commission, Consumer Financial ProtectionBureau, Financial Industry Regulatory Authority, U.S. Securities andExchange Commission, Internal Revenue Service, and Internet CrimeComplaint Center.Source: Bureau of Justice Statistics, National Crime Victimization Survey,Supplemental Fraud Survey, 2017.F I N A N C I A L F R AU D I N T H E U N I T E D S TAT E S , 2017 A P R I L 20216
Financial fraud victims lost more than 3.2 billiontotal in 2017Financial fraud victims experienced a variety of negativeconsequences as a result of the incident. A victim hadto lose money in the incident for it to be classifed asfraud. In total, victims lost more than 3.2 billion in2017, approximately half of which was due to consumerproducts and services fraud ( 1.9 billion) (table 7).Financial losses incurred by victims varied by fraud type.On average, victims of consumer products and servicesfraud lost about 880. Victims of relationship andtrust fraud incurred the greatest average monetary lossof 3,610.On average, fraud victims who reported the incidentto police had lost more money than fraud victims whodid not report to police (table 8). Relationship and trustfraud victims who reported the incident to police lost 6,830 on average, while relationship and trust fraudvictims who did not report to police lost about 1,500.Tis pattern held for all fraud types.TABLE 7Financial losses among victims age 18 or older whoexperienced at least one fnancial fraud incident in thepast 12 months, by type of fraud, 2017Type of fraudTotal fnancial fraudb,cRelationship and trustPhantom debtProducts and services*EmploymentPrize and grantCharityMean 1,090 3,610 † 1,320 † 880 850 430 † 70 †Median 200 400 700 100 400 200 30Total lossesa 3,249,735,930 588,648,770 † 454,967,830 † 1,871,082,030 135,497,060 † 116,171,410 † 27,323,360 †Note: Estimates are based on the most recent incident of that fraud type.Details may not sum to totals due to rounding. See appendix table 12 forstandard errors.*Comparison group. Compared to each fraud type and not totalfnancial fraud.†Diference with comparison group is signifcant at the 95%confdence level.aThe percentage of victims who experienced one type of fraud multipletimes during the reference period varied from 1% to 6%. To account forthese losses, the average loss in each category was added to the amountlost by the victim in the most recent incident and added to total losses.bTotal fnancial losses are expected to be greater than the amounts shownin this table due to top coding, a procedure used to protect respondentsfrom disclosure risk.cInvestment fraud is excluded from this table due to too few sample casesbut is included in total fnancial fraud.Source: Bureau of Justice Statistics, National Crime Victimization Survey,Supplemental Fraud Survey, 2017.TABLE 8Financial losses among victims age 18 or older who experienced at least one incident of personal fnancial fraud in thepast 12 months, by type of fraud and reporting to police, 2017Type of fraudTotal fnancial fraudb,cRelationship and trustPhantom debtProducts and servicesEmploymentPrize and grantCharityMean 3,440 † 6,830 † 1,570 † 3,840 † 1,630 † ! 1,130 † 110 † !Reported to policeMedianTotal lossesa 800 1,457,016,580 4,210 420,675,440 † 900 153,639,270 † 500 758,800,680 1,800 ! 31,069,800 † ! 800 50,717,600 30 ! 3,421,170 † !Mean 700 1,500 1,200 550 730 270 70Not reported to police*MedianTotal lossesa 200 1,792,719,350 40 167,973,330 1,200 301,328,560 100 1,112,281,350 600 104,427,260 200 65,453,810 30 23,902,190Note: Estimates are based on the most recent incident of that fraud type. Details do not sum to totals due to rounding. See appendix table 13 forstandard errors.*Comparison group.†Diference with comparison group is signifcant at the 95% confdence level.! Interpret with caution. Estimate is based on 10 or fewer sample cases, or coefcient of variation is greater than 50%.aThe percentage of victims who experienced one type of fraud multiple times during the reference period varied from 1% to 6%. To account for theselosses, the average loss in each category was added to the amount lost by the victim in the most recent incident and added to total losses.bTotal fnancial losses are expected to be greater than the amounts shown in this table due to top coding, a procedure used to protect respondents fromdisclosure risk.cInvestment fraud is excluded from this table due to too few sample cases but is included in total fnancial fraud.Source: Bureau of Justice Statistics, National Crime Victimization Survey, Supplemental Fraud Survey, 2017.F I N A N C I A L F R AU D I N T H E U N I T E D S TAT E S , 2017 A P R I L 20217
More than half of fnancial fraud victims reportedexperiencing socioemotional problemsVictims also reported experiencing socioemotionalproblems as a result of the fraudulent incident. For thisreport, socioemotional problems are feelings of moderateto severe distress; signifcant problems with work orschool, such as trouble with a boss, coworkers, or peers;or signifcant problems with family members or friends,including more arguments than before the victimization,an inability to trust, or not feeling as close afer thevictimization. More than half of all fnancial fraudvictims reported experiencing socioemotional problemsas a consequence of the victimization (53%) (fgure 2).Two-thirds of victims of phantom debt, employment,prize and grant, and relationship and trust fraud reportedexperiencing socioemotional problems. Less than halfof products and services fraud victims (47%) and about29% of charity fraud victims reported experiencingsuch problems.FIGURE 2Percent of victims age 18 or older who experiencedsocioemotional problems as a result of personal fnancialfraud, by type of fraud, 2017Total ÿnancial fraudaPhantom debt†Employment‡Prize and grantRelationship and trustProducts and services*Charity†0102030 40 50 60Percent of victims708090Note: Estimates are based on the most recent incident for that fraud type.See appendix table 14 for estimates and standard errors.*Comparison group. Compared to each fraud type and not totalfnancial fraud.†Diference with comparison group is signifcant at the 95%confdence level.‡Diference with comparison group is signifcant at the 90%confdence level.aInvestment fraud is excluded from this table due to too few sample casesbut is included in total fnancial fraud.Source: Bureau of Justice Statistics, National Crime Victimization Survey,Supplemental Fraud Survey, 2017.Diferences between fnancial fraud and identity thefThe Bureau of Justice Statistics (BJS) defnes and measuresidentity theft and personal fnancial fraud separately,with the distinction being whether respondents willinglyprovided personal information to the ofender. In thecase of identity theft, victims’ personal information(e.g., account information or Social Security number) isobtained and used without their permission. Identitytheft is similar to other types of theft, whereby victims’information is taken without their knowledge, consent, orcontrol. BJS’s Identity Theft Supplement to the NationalCrime Victimization Survey (NCVS) collects informationabout the misuse of an existing account, a new account,or personal information that persons age 16 or olderexperienced in the prior 12 months. For more information,see Victims of Identity Theft, 2018 (NCJ 256085, BJS,April 2021).In the context of the NCVS’s Supplemental Fraud Survey,personal fnancial fraud occurs when the victims willinglyprovide personal information but are deceived aboutwhat they will receive in return for that information.For an incident to be classifed as a fraud, victims mustbe knowingly and intentionally deceived and losemoney in the transaction. For more information, see theMeasurement of personal fnancial fraud victimization textbox and Methodology in this report.F I N A N C I A L F R AU D I N T H E U N I T E D S TAT E S , 2017 A P R I L 20218
MethodologyData collectionThe Supplemental Fraud Survey (SFS) is a supplement tothe National Crime Victimization Survey (NCVS), whichthe U.S. Census Bureau carries out for the Bureau ofJustice Statistics (BJS). The NCVS collects data on crimesreported or not reported to police against persons age 12or older from a nationally representative sample of U.S.households. The sample includes persons living in groupquarters (such as dormitories, rooming houses, andreligious-group dwellings) and excludes persons livingin military barracks and in institutional settings (suchas correctional or hospital facilities) and persons whoare homeless.From October 1, 2017 through December 31, 2017,
Stanford University's Financial Fraud Research Center (FFRC) and the Financial Industry Regulatory Authority . and personal crowdfunding sites for bogus causes. Consumer investment. A large return on an investment. Ponzi schemes, penny stock fraud, oil and gas exploration scams, and bond fraud. Consumer products and services. Obtaining the .