Transcription
On-Demand Internet-Related Jobs Scale Becoming Significant175
DATA GATHERING OPTIMIZATION YEARS IN MAKING INCREASINGLY GLOBAL COMPETITIVE176
Data Gathering Optimization Accelerates WithComputer Adoption.Mainframes(Early 1950s* ) * In 1952 IBM launched the first fully electronic data processing system, the IBM 701.177
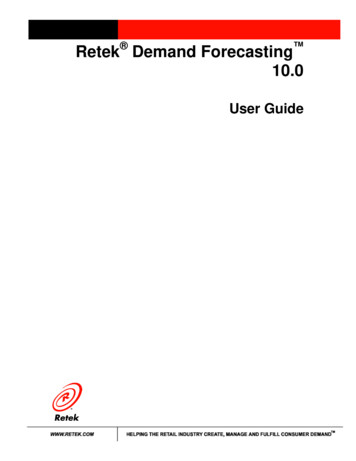
Data Gathering Optimization (1950s ) Enabled by Mainframe Adoption 16B16K 12B12K 8B8K 4B4K 0Mainframe Units, USAMainframe Shipment Value, USAMainframe Shipment Value & Units0196019651970Shipment Value1975198019851990Annual Mainframe ShipmentsSource: W. Edward Steinmueller: The USA Software Industry: An Analysis and Interpretive History (3/95).178
Data Gathering Optimization (1950s ) Government Mainframe Deployment 195519601965Social SecurityNASAIRSCalculate Benefits for15MM Recipients (62MM Now)Calculate Real-TimeOrbital DeterminationCalculate / Store55MM Records (126MM Now)Source: Social Security Administration (75th Anniversary Retrospective), NASA – ‘Computers in Spaceflight’, CNET – “IRS Trudges on WithAging Computers” (5/08). Note: Social Security includes Americans receiving retirement benefits, old-age / survivors insurance, unemploymentbenefits, or disability benefits. Tax records includes include total households since all are required to file taxes regardless of amount owed.179
Data Gathering Optimization (1950s ) Business Mainframe Deployment195519651975BanksInsuranceCredit CardsBank of AmericaAetnaVisaProcess ChecksOptimize Insurance PoliciesManage Merchant NetworkTelecomAirlinesRetailBell Labs / AT&TAmerican AirlinesWalmartOptimize Telephone SwitchingProcess Transactions / DataTrack Inventory / LogisticsHospitalsTulane Medical School SystemManage Patient DataSource: Bank of America, IBM, Computer World (9/85), Network Computing (3/04), Computer History Museum, Walmart Museum. Note: Banks (1952):Bank of America adopted ‘Electronic Recording Method of Accounting’ system developed by Stanford Research Institute. Telecom (1955): Bell Labsinstalled the IBM 650 to facilitate engineering for complex automated telephone switching systems. Hospitals (1959): Tulane Medical School Systeminstalled the IBM 650 to process medical record data. Airlines (1962): IBM computers integrated into SABRE system. Insurance (1965): Aetna installedIBM’s 360 to automate policy creation. Retail (1972): Walmart established a data processing facility. Credit Cards (1973): Year IBM partnered with Visa.180
.Data Gathering Sharing Optimization Accelerates WithComputer Adoption.Consumer Mobiles The Cloud(2006 ).181
Computing Big Bangs Cloud (2006) Consumer Mobile (2007) 2006Amazon AWS2007Apple iPhoneUntil now, a sophisticated &scalable data storage infrastructurehas been beyond the reachof small developers.Why run such a sophisticatedoperating system on a mobiledevice? Well, because it’sgot everything we need.- Amazon S3 Launch FAQ, 2006- Steve Jobs, iPhone Launch, 2007Source: Wikimedia, Apple, Amazon, Steve Jobs Photo by Tom Coates.182
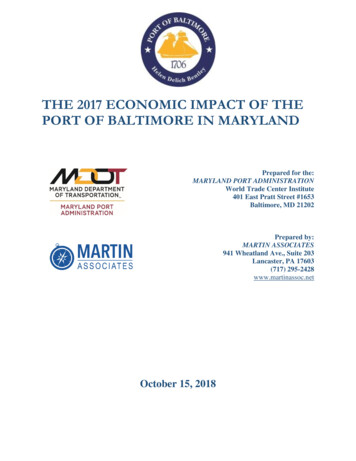
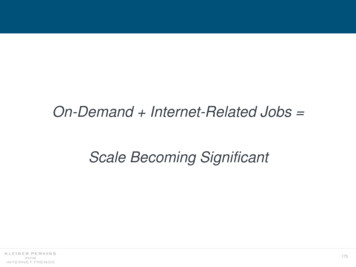
Computing Big Bangs Cloud (2006) Consumer Mobile (2007)Apple iOS – # of AppsAmazon AWS – # of Services20182MM Apps2018140 Services2008 5,000 Apps20061 rce: Amazon, The Internet Archive. Apple; AppleInsider. Note: Based on Apple releases.Includes all iPhone/iPad/Apple TV applications available for download. Data as of 5/18.201420162018183
.Computing Big Bangs Volume Effects Cloud Compute Cost Declines Continue -11% vs. -10% Y/Y. 0.50% 0.4-10% 0.3-20% 0.2-30% 0.1-40% 0Y/Y ChangeCost Per InstanceAWS Compute Cost Growth*-50%2008 2009 2010 2011 2012 2013 2014 2015 2016 2017 2018CostY/Y ChangeSource: The Internet Archive. *Cost data reflects price of ‘current generation’ m.large on-demand Linux instance in USAEast Virginia (m1.large 2008-2013, m3.large 2014-2015, m4.large 2016-2017, m5.large 2018). m.large chosen asa representative instance of general purpose compute; pricing does not account for increasing instance performance.184
.Computing Big Bangs Volume Effects Cloud Revenue Re-Accelerating 58% vs. 54% Q/QCloud Service Revenue – Amazon Microsoft Google 10B100%75% 6B50% 4BY/Y GrowthGlobal Revenue 8B25% 2B 00%Q1Q2 Q32015Q4Amazon AWSQ1Q2 Q32016Q4Q1Microsoft AzureQ2 Q32017Q4Q12018Google CloudSource: Amazon AWS Company filings, Microsoft Azure Keith Weiss @ MorganStanley (4/18), Google Cloud Brian Nowak @ Morgan Stanley (5/18). Note: GoogleCloud revenue excluded in Y/Y growth rate calculation due to limited quarterly estimates.185
Data Gathering Sharing Optimization (2006 ) Enabled by Consumer Mobile Adoption.Smartphone ShipmentsGlobal Shipments1.5B1.0B0.5B02007 2008 2009 2010 2011 2012 2013 2014 2015 2016 2017Source: Morgan Stanley (Katy Huberty, 3/18), IDC.186
.Data Gathering Sharing Optimization (2006 ) Enabled by Social Media Adoption Time Spent on Social MediaMessages per Day60B135100Messages per DayGlobal Daily Time on Social Media (Minutes)150905040B20B002012 2013 2014 2015 2016 2017Telegram(2/16)Line(10/17)Source: Global Web Index (9/17), Telegram (2/16), Line (10/17), WeChat (11/17), Whatsapp (7/17).Note: Per Global Web Index, social media time spent for Internet users aged 16-64. n 61,196(2012), 156,876 (2013), 168,046 (2014), 198,734 (2015), 211,024 (2016), 178,421 (2017).WeChat Whatsapp(11/17)(7/17)187
.Data Gathering Sharing Optimization (2006 ) Enabled by Sensor Pervasiveness.MEMS Sensor / Actuator ShipmentsGlobal Shipments15BSensors Data In More PlacesVisualNavigationGoogle cisionCookingJoule10B5B02012 2013 2014 2015 2016 2017Source: IC Insights (2018), Google Maps, Mobike, Nest, Samsara, Motiv, Joule. Note: MEMS sensors andactuators includes all MEMS-based sensors (e.g., Accelerometers, Gyroscopes, etc.), but does not include opticalsensors, like CMOS image sensors, also includes actuators made using MEMs processes, per IC Insights.188
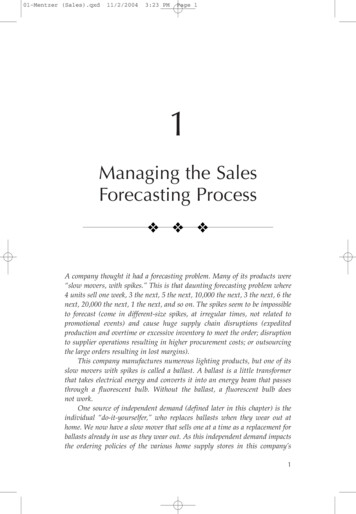
.Data Gathering Sharing Optimization (2006 ) Ramping @ Torrid PaceInformation Created Worldwide(per IDC)2025E163 ZB, 36%180Amount, % Structured160Zettabytes (ZB)1402020E47 ZB, 16%12010080201512 ZB, 9%60402020102 ZB, 9%20050.1 ZB02004200620082010201220142016 2018E 2020E 2022E 2024ESource: IDC Data Age 2025 Study, sponsored by Seagate (4/17). Note: 1 petabyte 1MM gigabytes, 1 zeta byte 1MM petabytes. The grey area in the graph represents data generated, not stored. Structured data indicates data thathas been organized so that it is easily searchable and includes metadata and machine-to-machine (M2M) data.189
Data Can Be Important Driver ofCustomer Satisfaction190
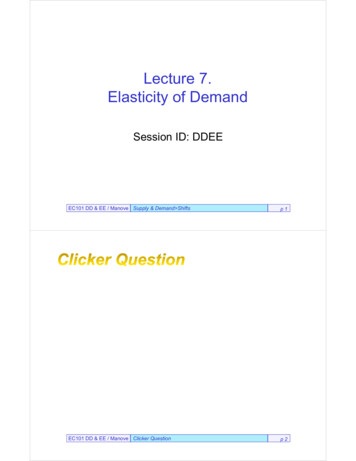
USA Internet Data Leaders Relatively High Customer SatisfactionAmerican Customer Satisfaction Index (ASCI) Scores(Internet Data Companies 100B Market Capitalization, 5/18, USA)77 Q4:17 USA AverageAmazonAmazon(E-Comemrce)Google (Alphabet)Google / Alphabet(Search)Facebook / InstagramFacebook(Social Media)Netflix*Netflix(Video)Booking.com (Priceline)Booking Holdings(Lodging Inventory)60E-Commerce85Search82Social Media72Video79Lodging Inventory657870758085902017 ASCI ScoreSource: American Customer Satisfaction Index (ASCI). *Netflix data from 2016, as ASCI score was not tracked in 2017. Instagram / Facebookaverage score used as ‘Facebook’ score. Priceline.com used as ‘Booking Holdings’ score. Note: ASCI is a tool first developed by The Universityof Michigan to measure consumer satisfaction with various companies, brands, and industries. ACSI surveys 250K USA customers annually viaemail, responses to weighted questions are used to create a cross-industry score on a scale of 0-100. Top 2017 Score 87 (Chick-fil-A).191
Google Personalization Queries Drive Engagement Customer SatisfactionQuery Growth(2015 -2017)Data-Driven Personalization1000%Google Query Growth, Global (2015-2017)900%800%600%400%200%60%65%For MeShould I?0%Source: Google (5/18). Note: Google queries only personalized for geo-location data. *Reflects mobile queries,where location data is readily available / important.Near Me*192
Spotify Personalization Preferences Drive Engagement Customer SatisfactionUser PreferencesSpotify Daily EngagementDAU / MAU, Global50%44%37%25%0%201420162017Unique Artist ListeningMonthly Unique Artist Listened toPer User, GlobalData-Driven Personalization201511212080 684002014Source: Spotify, Benjamin Swinburne @ Morgan Stanley (4/18)Note: Monthly unique artists listened to per user as of 5/18.201520162017193
Toutiao Personalization Interests Drive Engagement Customer SatisfactionMAUsData-Driven PersonalizationMAUs, Global250MM200MM150MM100MM50MM0201520162017Minutes Spent per Day80Minutes6040200Main Page – User AMain Page – User BSnapchat(5/18)Source: Toutiao (5/18), Snap (5/18), Instagram (8/17).*Instagram data reflects time spent by users under the ageof 25, assumed to be representative of all Instagram users.Instagram*(8/17)Toutiao(5/18)194
Data Improves Predictive Ability ofMany Services195
Data Volume Foundational to Algorithm Refinement Artificial Intelligence (AI) Performance Object Detection Precision (mAP @[.5,.95])Object Detection - Performance vs. Dataset SizeGoogle Research & Carnegie Mellon, 20174035302510MM1030MM100MM100300MMExample Images in Training DatasetSource: Revisiting Unreasonable Effectiveness of Data in Deep Learning Era – Sun, Shrivastava, Singh, & Gupta, 2017Note: Chart reflects object detection performance when initial checkpoints are pre-trained on different subsets of JFT-300M tagged imagedataset. X-axis is the data size in log-scale, y-axis is the detection performance in mAP@[.5,.95] on “COCO minival” testing set.196
Data Volume Foundational to Tool / Product Improvement.Artificial Intelligence (AI) Predictive CapabilityAWS ‘Data Flywheel’ – Amazon Rekognition*More DataPricingMore Uploads Lower Average PriceMore CustomersCustomersLarge / Small Enterprises Public AgenciesBetter AnalyticsAccuracyRegular ImprovementsBetter ProductsFeaturesRegular ImprovementsSource: Amazon Artificial Intelligence on AWS Presentation (6/17). *Amazon Rekognition enables users todetect objects, people, text, scenes, and activities in their photos and videos using machine learning.197
Artificial Intelligence (AI)Service Platforms for Others Emerging from Internet Leaders198
Amazon AI Platform Emerging from AWS Enabling Easier Data Processing / Collection for Others Amazon AWS AI Services / InfrastructureAI Hardware – Scalable GPU Compute ClustersRekognition Image RecognitionComprehend Language ProcessingSageMaker Machine Learning FrameworkSource: Amazon. AWS Amazon Web Services.199
.Google AI Platform Emerging from Google Cloud Enabling Easier Data Processing / Collection for OthersGoogle Cloud AI Services / InfrastructureAI Hardware – Tensor Processing UnitsGoogle Cloud Vision APICloud AutoML – Custom ModelsDialogflow Conversational PlatformSource: Google200
AI in Enterprises Small But Rapidly Rising Spend Priority Per Morgan Stanley CIO Survey (4/18 vs 1/18)Which IT Projects Will See The Largest Spend Increase in 2018?Share of CIO Respondents, USA E.U.10%5%0%Networking EquipmentArtificial IntelligenceJanuary 2018HyperconvergedInfrastructureApril 2018Source: AlphaWise, Morgan Stanley Research. Note: n 100 USA / E.U. CIOs. Note: Full Question Text ‘Which three External IT Spending projects will see the largest percentage increase in spending in 2018?’201
AI is one of the most important thingshumanity is working on.It is more profound than electricity or fire We have learned to harness fire for the benefits ofhumanity but we had to overcome its downsides too. AI is really important, but wehave to be concerned about it.- Sundar Pichai, CEO of Google, 2/18Source: CNBC (2/18).202
Data Sharing Creates Multi-Faceted Challenges203
Data Consumers Love-Hate RelationshipSource: Cartoonstock, Artist: Roy Delgado204
Most Online Consumers Share Data for Benefits USA Consumers per Deloitte79%Willing to Share Personal Data For ‘Clear Personal Benefit’ 66%Willing To Share Online Data With Friends & FamilySource: USA Consumer Data Deloitte To share or not to share (9/17)Note: n 1,538 USA customers surveyed in cooperation with SSI in 2016.205
Most Online Consumers Protect Data When Benefits Not ClearConsumers Taking Action To Address Data Privacy ConcernsDeleted / Avoided Certain Apps64%Adjusted Mobile Privacy Settings47%Disabled Cookies28%Didn't Visit / Closed Certain Websites27%Closely Read Privacy Agreements26%Did Not Buy Certain Product9%0%25%50%75%% of Respondents that Took Action in the Last 12 Months Due to DataPrivacy Concerns, USASource: Deloitte To share or not to share (9/17)Note: n 1,538 USA consumers in cooperation with SSI.206
Internet Companies Making Consumer Privacy Tools More Accessible (2018)Facebook2008Google201820082018Source: Facebook, Google207
Data Sharing Varying Views208
EU / Asia / Americas Rising Regulatory Focus on Data Collection Sharing General Data Protection RegulationEnacted 5/25/18Privacy Act of 1974Enacted 12/31/74Act on Protection of Personal InformationEnacted 5/30/17Personal Information Protection ActEnacted 09/30/11Data Privacy LawsEnacted in Past 10 YearsDeveloping (2018)Source: Wikimedia, USA Congress, EU, Japan Government, South Korea Government, Argentina Government.Note: Argentina proposed a 2017 draft amendment to the Personal Data Protection Act that would strengthen current regulationand align with most GDPR requirements. Japan enacted an amendment to its Act on Protection of Personal Information thatwent into effect on 5/30/17. All EU countries grouped due to passage of EU-wide GDPR laws.209
.China Encouraging Data Collection[Xi Jingping] called for building high-speed, mobile, ubiquitous &safe information infrastructure, integrating government & social dataresources, & improving the collection of fundamental information.[Xi stated] The Internet, ‘Big Data,’ Artificial Intelligence, &‘The Real Economy’ should be interconnected.- Xinhua State News Agency, 12/9/17Ministry of Industry & InformationTraining to Build ‘Big Data’ DatacenterChina to Further Promote GovernmentInformation Sharing & DisclosureXinhua State Press Agency, 5/07/17Xinhua State Press Agency, 12/7/17China Launches ‘Big Earth’ Big Data ProjectTo Boost Science Data SharingXinhua State Press Agency, 2/13/18Source: Xinhua (PRC’s official Press Agency).210
Cybersecurity Threats Increasingly Sophisticated.Targeting DataObserved Malware VolumeAdversaries are taking malware tounprecedented levels ofsophistication & impact.Weaponizing cloud services & othertechnology used for legitimate purposes.And for some adversaries,the prize isn’t ransom, butobliteration of systems & data.- Cisco 2018 Annual Cybersecurity Report, 2/18Malware Volume (Indexed to (Q1:16), Global15x10x5x0Q1 Q2 Q3 Q4 Q1 Q2 Q3 Q42016Source: Cisco 2018 Annual Cybersecurity Report. Note: Data collected by Cisco endpoint security equipment / software. WhileMalware volume increased 11x from Q1:16 to Q4:17, traffic events process by the same equipment only increased 3x.2017211
Global Internet Leadership USA & China212
Economic Leadership.213
Relative Global GDP (Current ) USA China India Gaining Other Leaders FallingGlobal GDP Contribution (Current )40%% of Global 1980Europe1990ChinaIndia200020102017Latin AmericaSource: World Bank (GDP in current ). Other countries account for 30% of global GDP.214
Cross-Border Trade Increasingly Important to Global EconomyTrade as % of Global GDP40%Share30%20%10%0%20161960 1965 1970 1975 1980 1985 1990 1995 2000 2005 2010 2015Source: World Bank. Note: ‘World Trade’ refers to the average of Imports &Exports (to account for goods in-transit between years) for all nations.215
Internet Leadership A Lot’s Happened Over5-10 Years 216
Today’s Top 20 Worldwide Internet Leaders 5 Years Ago* USA @ 9 China @ 2 Public / Private Internet Companies, Ranked by Market Valuation e / AlphabetFacebookAlibabaTencentNetflixAnt FinancialeBay PayPal**Booking HoldingsSalesforce.comBaiduXiaomiUberDidi USAChinaChinaUSAChinaChinaTotalMarket Value ( B)5/29/13 41812129128856-7113-71412534------- 1,429Source: CapIQ, CB Insights, The Wall Street Journal, media reports. *Only includes public companies in2013. **eBay PayPal combined for comparison purposes though PayPal spun-off of eBay on 7/20/15.217
Today’s Top 20 Worldwide Internet Leaders Today USA @ 11 China @ 9Public / Private Internet Companies, Ranked by Market Valuation e / AlphabetFacebookAlibabaTencentNetflixAnt FinancialeBay PayPal*Booking HoldingsSalesforce.comBaiduXiaomiUberDidi USAChinaChinaUSAChinaChinaTotalMarket Value ( B)5/29/135/29/18 418 110025943484-75-72-56-52-31-30-30 1,429 5,788Source: CapIQ, CB Insights, Wall Street Journal, media reports. *eBay PayPal combined for comparison purposes though PayPal spun-off of eBayon 7/20/15. Market value data as of 5/29/18. The Wall Street Journey, Recode, TechCrunch, Reuters, and the Information articles detail the latestvaluations for Ant Financial (4/18), Xiaomi (5/18), Uber (2/18), Didi Chuxing (12/17), Airbnb (3/17), Meituan-Dianping (10/17), and Toutiao (12/17).218
Smartphones China @ #1 Worldwide OEM.@ 40% vs. 0% Share Ten Years Ago.USA @ 15% vs. 3%Worldwide New Smartphone Shipments by OEM Headquarters60%40%1.0B40%0.5B20%China OEM ShareWorldwide Shipments1.5B0%00%2007 2008 2009 2010 2011 2012 2013 2014 2015 2016 2017ChinaUSAKoreaOther% from China OEMsSource: Katy Huberty @ Morgan Stanley (3/18), IDC. Note: OEM Original Equipment Manufacturer.219
Internet Globally USA Platforms Lead User Numbers Active Users By Platform2.5BActive Users by Platform, l Platforms)Google(Android)Tencent(WeChat)Source: Facebook (4/18), Google (5/17), Tencent (3/18), Alibaba (5/18). Note: Facebook MAUs, Google MAUs, Tencent WeChat MAUs, Alibaba Mobile MAUs.Alibaba(E-Commerce)220
Internet by Country China Platforms Lead User Numbers in ChinaActive Users By Platform2.5BActive Users by Platform, l Platforms)ChinaGoogle(Android)Asia (ex-China)EuropeTencent(WeChat)North AmericaAlibaba(E-Commerce)Rest Of WorldSource: Hillhouse Capital. Facebook (4/18), Google (5/17), Newzoo (Google Android USA estimate, 1/18), Tencent (3/18), Alibaba (5/18). Note: Facebook MAUs,Google MAUs (Newzoo Global Mobile Market Report estimates that there are 125MM active Android smartphones in the USA in 2017), Tencent WeChat monthly active accountsvs. users as many Chinese users have multiple accounts (ex. 688MM users sent red envelopes during the 2018 Chinese New Year), Alibaba Annual active consumers. EstimatedWeChat ex-China MAU 5% of total per Hillhouse. Estimate Alibaba ex-China annual active consumers (Lazada Aliexpress) 80MM annual active customers per Hillhouse.221
China Feature Data-Rich Internet Platforms Largest # of Users in One CountryTencentAlibabaWeChat WeChat PayTaoBao AlipayPhotos Friends Games Apps Finances Bills Searches News Brands Feedback Finances.Bills Source: Tencent, Alibaba222
China Internet Users More Willing to Share Data for Benefits vs. Other Countries per GfKWould you share personal data (financial, driving records, etc.)for benefits (e.g., lower cost, personalization, lUSAUSASouth %8%0%10%20%30%40%% of Global Respondents Very Willing to Share (6 or 7 on 7 Point Scale)Source: GfK Survey (1/17). Note: n 22K of internet users ages 15 . A scale of 1-7 were used to identify the level of agreement with thefollowing statement: “I am willing to share my personal data (health, financial, driving records, energy use, etc.) in exchange for benefits orrewards like lower costs or personalized service” – using a scale where “1” means “don’t agree at all” and “7” means “agree completely.”.223
China Digital Data Volume @Significant Scale & Growing Fast Providing Fuel forRapid Artificial Intelligence Advancements224
Artificial Intelligence USA & China 225
Artificial Intelligence Competition Increasingly Complex Tasks China Momentum Strong1985199520056th World ComputerChess ChampionshipLarge Scale VisualRecognition Challenge 20101) Deep Thought (USA)2) Bebe (USA)3) Cray Blitz (USA)China No Entrants1) NEC-UIUC* (USA Japan)2) XRCE (France / EU)3) University of Tokyo (Japan)China 11th PlaceRoboCup-99 SoccerSimulation League1) CMUnited-99 (USA)2) MagmaFreiburg (Germany)3) Essex Wizards (UK)China No Entrants2018Stanford Question AnsweringDataset (Ongoing)1) Google Carnegie Mellon (USA)2) Microsoft* NUDT (USA China)3) YUANFUDAO (China)4) HIT iFLYTEK (China)5) Alibaba (China)Source: International Computer Games Association, RoboCup, Image-Net, Stanford. Note: Stanford Question Answering Dataset is a set of 100,000 human-generatedquestions covering 500 Wikipedia articles. Scores ranked by Exact Match Accuracy, which refers to the share of questions correctly parsed / answered. Highest Scoreincluded for teams with multiple results (i.e. Google Carnegie Melon) *National Affiliation refers to main campus of sponsoring Group / Company / University. Microsoftsubmitting team based in Beijing (lead by Feng-Hslung Hsu who was lead developer of ‘Deep Thought’ while @ Carnegie Mellon). NEC team based in USA.226
Natural Science & Engineering Higher Education China Graduation Rates Rising Rapidly per National Science FoundationAnnual Natural Science & Engineering Degrees(Agricultural Sciences / Biological Sciences / Computer Sciences / Earth, Atmospheric & Ocean Sciences / Mathematics / Engineering)Doctoral(Bachelor’s Equivalent)Doctorate Degrees, Selected Countries / EconomiesFirst University Degrees, Selected Countries / EconomiesFirst University1.5MM1.0MM0.5MM02000 2002 2004 2006 2008 2010 2012 2014ChinaUSA60K40K20K0EU – Top 82000 2002 2004 2006 2008 2010 2012 2014JapanSource: USA National Science Foundation analysis of National Bureau of Statistics (China), Government of Japan, UNESCO, OECD, National Center for Education Statistics, IPEDS, & National Center for Science /Engineering data. Note: Data for the majority of the countries were collected under same OECD, EU, and UIS guidelines & field groupings in the ISCED-F are similar to fields used in China, a major degree producer.Natural sciences include agricultural sciences; biological sciences; computer sciences; earth, atmospheric, and ocean sciences; & mathematics. EU-Top 8 for doctoral degrees includes UK / Germany / France / Spain /Italy / Portugal / Romania / Sweden. EU-Top 8 for first university degrees includes UK / Germany / France / Poland / Italy / Spain / Romania / The Netherlands. The # of S&E doctorates awarded rose from about 8K in2000 to more than 34K in 2014. Despite the growth in the quantity of doctorate recipients, some question the quality of the doctoral programs in China (Cyranoski et al. 2011). The rate of growth in doctoral degrees inS&E and in all fields has considerably slowed starting in 2010, after an announcement by the Chinese Ministry of Education indicating that China would begin to limit admissions to doctoral programs & focus on qualityof graduate education (Mooney 2007). Also in China, first university degrees increased greatly in all fields, with a larger increase in non-S&E than in S&E fields. China experienced an increase of almost 1.2MM degreesand up more than 400% from 2000 to 2014. China has traditionally awarded a large proportion of its first university degrees in engineering, but the percentage declined from 43% in 2000 to 33% in 2014.227
Artificial Intelligence Focus China Government Highly Focused on Developing AIArtificial Intelligence - Next Generation Development Plan Goals1) Build Open & Coordinated AI Innovation Systems2) Foster a Highly Efficient Smart Economy3) Construct Safe / Convenient Intelligent Society4) Strengthen Military-Civilian Integration in AI5) Build Safe & Efficient Information Infrastructure6) Plan Next Generation AI Science & Technology ProjectsSource: New America Translation of China State Council documents (7/20/17).228
Artificial Intelligence USA Ahead China Focused Organized GainingI’m assuming that [USA’s] lead [in ArtificialIntelligence] will continue over the next five years,& that China will catch up extremely quickly.In five years we’ll kind of be at the same level, possibly.It’s hard to see how China would havepassed us in that period, although their rate ofimprovement is so impressively good.- Eric Schmidt, Chairman, US Defense Innovation Advisory Board,Keynote Address at Artificial Intelligence & Global Security Summit, 11/13/17229
ECONOMIC GROWTH DRIVERS EVOLVE OVER TIME 230
CenturyEconomic Growth DriversPre-18thCultivation & Extraction19-20thManufacturing & Industry21st Compute Power & Human Potential231
Lifelong Learning Crucial in EvolvingWork Environment &Tools Getting Better More Accessible232
Lifelong Learning 33MM Learners 30% (Coursera) Top Courses, 2017Learners40MMRegistered Learners, GlobalMachine Learning StanfordNeural Networks & Deeper Learning Deeplearning.aiLearning How to Learn: Powerful Mental Tools toHelp You Master Tough Subjects UC San DiegoIntroduction to Mathematical Thinking StanfordBitcoin & Cryptocurrency TechnologiesProgramming for EverybodyPrincetonUniversity of MichiganAlgorithms, Part I PrincetonEnglish for Career DevelopmentUniversity of Pennsylvania30MM20MM10MMNeural Networks / Machine Learning University of TorontoFinancial Markets Yale02014201520162017Learners by Geography30%0%20%North America28%40%Asia20%60%EuropeSouth AmericaSource: Coursera. Note: Course popularity based on averagedaily enrollments. Graph shows learners as of 5/18.11%80%5%100%Africa233
Lifelong Learning Educational Content Usage Ramping Fast (YouTube) Selected EducationChannel Subscribers1B9MMDaily Learning Video Views 6MM 770%Viewers Use Platform to Help SolveWork / School / Hobby ProblemsSubscribers 66MM 6 23MM 38%Growth Y/Y (2017)Job Search Video Views(e.g., Resume-Writing Guides)0AsapCrashSCIENCE CourseTEDEd2013SmarterKhanEvery AcademyDay2018Source: YouTube (5/18).234
Lifelong Learning Employee Re-Training Engagement High (AT&T) ‘Workforce 2020’ / ‘Future Ready’ Programs 1BAllocated for web-based employee training.Partners Coursera / Udacity / Universities.2.9MMEmerging tech courses completed by employees.Most popular courses Cyber Security / Machine Learning /Data-Driven Decision Making / Virtual Collaboration.194KEmployees (77% of workforce) actively engaged in re-training.61%Share of promotions received by re-trained employees (2016-Q1:18)Source: AT&T (4/18).235
Lifelong Learning 50% of Freelancers Updated Skills Within Past 6 MonthsWhen Did You Last Participate in Skill-Related Training?% of USA n Past 6 MonthsNon-Freelancers 6 Months Ago / NeverSource: Edelman Research / Upwork ‘Freelancing In America: 2017.’ Note: Surveyconducted July-August 2017 on 2,173 Freelance Employees who have receivedpayment for supplemental temporary, or project-oriented work in the past 12 months.236
CHINA INTERNET ROBUST ENTERTAINMENT RETAIL INNOVATION*Disclaimer – The information provided in the following slides is for informational and illustrative purposes only. No representation or warranty, express or implied, is given and no responsibility orliability is accepted by any person with respect to the accuracy, reliability, correctness or completeness of this Information or its contents or any oral or written communication in connection with it.Hillhouse Capital may hold equity stakes in companies mentioned in this section. A business relationship, arrangement, or contract by or among any of the businesses described herein may notexist at all and should not be implied or assumed from the information provided. The information provided herein by Hillhouse Capital does not constitute an offer to sell or a solicitation of an offerto buy, and may not be relied upon in connection with the purchase or sale of, any security or interest offered, sponsored, or managed by Hillhouse Capital or its affiliates.237
China Macro Trends Strong238
China Consumer Confidence Near 4 Year High Manufacturing Index 2016China Consumer Confidence Index (LHS)2017PMI, ChinaConsumer Confidence Index, ChinaChina Consumer Confidence Index Manufacturing Purchasing Managers' Index (PMI)2018China Manufacturing PMI (RHS)Source: China National Bureau of Statistics (CNNIC), Morgan Stanley Research. Note: The Purchasing Managers Index isMeasured by China National Bureau of Statistics Based on New Orders, Inventory Levels, Production, Supplier Deliveries &the Employment Environment. Score of 50 Indicates an Expanding Manufacturing Sector. Consumer Confidence is aMeasure of Consumers’ Sentiment About the Current / Future State of the Domestic Economy, Indexed to 100.239
China G
Amazon AWS -# of Services 2006 2008 2010 2012 2014 2016 2018 2006 1 Service 2018 140 Services Computing Big Bangs Cloud (2006) Consumer Mobile (2007) 2008 2010 2012 2014 2016 2018 2008 5,000 Apps 2018 2MM Apps Apple iOS -# of Apps Source: Amazon, The Internet Archive. Apple; AppleInsider. Note: Based on Apple releases.