Transcription
SDG DashboardsThe role of information tools in the implementation ofthe 2030 AgendaSeptember 2017Draft for comments
ContentsA closer look at the evolution of information dashboards. 6Information dashboards in the development agendas. 7Mapping of SDG/MDG information dashboards in Latin America. 8Five country-level experiences of SDG dashboards . 8Brazil . 9Colombia .19Mexico .24Panama .33Paraguay .38Findings and emerging insights .42#1: Three cohorts of development dashboards .42#2: Dashboards for what purpose .43#3: Supply-side traction: Where does the dashboard sit .45#4: Demand-side traction: Is the dashboard interesting enough .46#5: Issues of data quality .48#6: The cost and software architecture for setting up a dashboard .49#7: Sustainability of dashboards .50Conclusions .50References .51Annexes .53Annex 1: Research Questions .53This paper was prepared by Maria E. Boza as part of a research collaboration between UNDPSIGOB and the UNDP Bangkok-Hub. Tomas Fantl, Romualdo Rijo and Magalí Cáceres were partof the research team. We want to thank government and UNDP officials who provided informationfor preparing the case studies, and to Mikaela Prokop and Miguel Cereceda for their comments.The views expressed in this publication are those of the author(s) and do not necessarilyrepresent those of the United Nations, including UNDP, or the UN Member States. For questionsand additional information please contact maria.eugenia.boza@undp.org.2
List of FiguresFigure 1: Dashboard, definition . 6Figure 2: Summary table of development information tools . 8Figure 3: Summary infographic: development dashboards in Brazil .10Figure 4: The MDGs icons before and after the Brazilian 2004 campaign .11Figure 5: Snapshot Relatórios Dinámicos, municipality of Aguas Formosas .12Figure 6: Snapshot Atlas Brazil, front page .14Figure 7: Atlas Brazil: Choice of variables and geographical units in query .14Figure 8: Atlas Brazil, MHDI scorecard ranking .15Figure 9: Snapshot, 2030 Agenda Platform (Brazil) .17Figure 10: Colombia's NDP in relationship to the SDGs .20Figure 11: Colombia’s tiered planning system and planning tool for localizing priorities .20Figure 12: Summary infographic: development dashboards in Colombia .21Figure 13: SINERGIA building blocks.22Figure 14: Snapshot top dashboard of SINERGIA, Colombia.23Figure 15: Summary infographic: development dashboards in Mexico .25Figure 16: Screenshot SI-ODM, municipality of Asientos, State of Aguascalientes .27Figure 17: Snapshot SI-ODM, municipality of Asientos, State of Aguascalientes .29Figure 18: Snapshot Pilot SDG Dashboard, Mexico .30Figure 19: Beta version, official dashboard SI-ODS .32Figure 20: Summary infographic: development dashboards in Panama .34Figure 21: Screenshot of the Integrated System of Development Indicators SID, Panama .35Figure 22: Screenshot of the Pilot SDG Platform, Panama .36Figure 23: Conceptual diagram of the Panama pilot SDG Platform: framework, indicators,initiatives and people.37Figure 24: Summary infographic: development dashboards in Paraguay .39Figure 25: Screenshot of the Paraguay SDG Platform .41Figure 26: Actors in a dashboard initiative.45Figure 27: Users and producers of information in the SINERGIA dashboard (Colombia) .473
List of n Cooperation Agency (Mexico)National Population Council (Mexico)National Council for Economic and Social Policy (Colombia)Specialized Technical Committee for the MDG Information System (Mexico)National Statistical Office (Colombia)Dirección General de Estadísticas, Encuestas y Censos (Paraguay)Department of National Planning (Colombia)United Nations Economic Commission for Latin America and the CaribbeanHuman Development IndexHigh-Level Political ForumInter-Agency and Expert Group on SDG IndicatorsBrazilian Institute of Geography and Statistics (Brazil)Information and communication technologiesNational Statistics and Census Institute (Panama)National Institute of Statistics and Geography (Mexico)Information Society Programme for Latin America and the CaribbeanInstitute for Applied Economic Research (Brazil)Information technologiesKey performance indicatorsMonitoring and evaluationMillennium Development GoalsMunicipal Human Development IndexNon-governmental organizationOpen Government PlatformOpen Working GroupSustainable Development GoalsSustainable Development Solutions NetworkStrategic Affairs of the Presidency of the Republic (Brazil)Social Services of the Business Association of Parana (Brazil)Integrated System of Development Indicators (Panama)Swedish International Development Cooperation AgencySystems for Governance, sometimes also referred as UNDP-SIGOBNational performance monitoring and evaluation system (Colombia)MDG Information System (Mexico)Secretaría Técnica de Planificación (Paraguay)United Nations Development GroupUnited Nations Development ProgrammeUnited Nations Educational, Scientific and Cultural OrganizationUnited Nations Population FundUnited Nations International Children's Emergency Fund4
The 2030 Agenda was adopted in September 2015 by all UN member states as an ambitiousglobal development program that aims to protect people and the planet, and achieve prosperityfor all. The agenda includes a result framework with 17 Sustainable Development Goals (SDGs)and 169 targets across three dimensions of sustainable development: economic development,social inclusion, and environmental sustainability, all underpinned by good governance.Compared to the previous development agenda of the Millennium Declaration and the MillenniumDevelopment Goals (MDGs), the 2030 Agenda is broader in scope, universally applicable, morecomplex and with bolder targets. The implementation of the 2030 Agenda carries significantchallenges and it is important to build on the lessons learned during the implementation of theMDGs. One of those lessons is the catalyzing role that dashboards can have on a developmentagenda, both as a government management tool and as a platform for engaging localgovernments, and stakeholders.Information dashboards are tools at the tip of the iceberg in a system that produces and usesinformation. We can expect that SDG dashboards will be at the crux of monitoring andimplementation challenges of the 2030 Agenda for at least two reasons. First, countries areexpected to adapt SDG targets and indicators to their national contexts1. The monitoring andreporting requirements for this framework2 are prompting countries to review their statisticalsystems and capacities, improve interoperability between different data systems, and betterintegrate data from external sources. Second, effective implementation of the 2030 Agenda willrequire countries to use whole-of-government approaches as well as leveraging real engagementfrom national stakeholders in parliament, civil society, and the private sector.We are in a time of experimentation on how to bring people together around the 2030 Agendaand countries around the world are expressing interest in setting up dashboards as informationtools to support the implementation of the SDGs. In times like this it is important to learn from thepast and also to be inspired by new technologies and possibilities. In Latin America, countrieshave experimented with different ways to make MDG data more widely available, and developeddashboards and online platforms to increase the impact of the development agenda. In recentyears, emerging trends in information and communication technologies (ICTs) and big data havepushed the frontier of data use. All these create opportunities to expand the role of informationtools for the implementation of the 2030 Agenda.This paper is a collaboration between UNDP’s Bangkok Regional Hub and the UNDP-SIGOBregional project of the UNDP Panama Hub for Latin America and the Caribbean to provide lessonslearnt and emerging practices from setting up dashboards to support the implementation of the2030 Agenda in Latin America. This work is based on analysis of five country-level experiences:Brazil, Colombia, Mexico, Panama and Paraguay. These cases were selected out of an initialscoping of ten cases based on their innovations, results, and scalability. The document isorganized into three sections. First, we set up the scope of the work, review its basic conceptsand present the initial scoping exercise. Second, we present in detail each of the five experiences.1UN Economic and Social Council E/CN.3/2016/2/Rev.1*2For more information on the guidelines to develop the monitoring and reporting framework, see UNDG,“Mainstreaming the 2030 Agenda for Sustainable Development, Reference Guide to UN Country Teams”, February2016, p.775
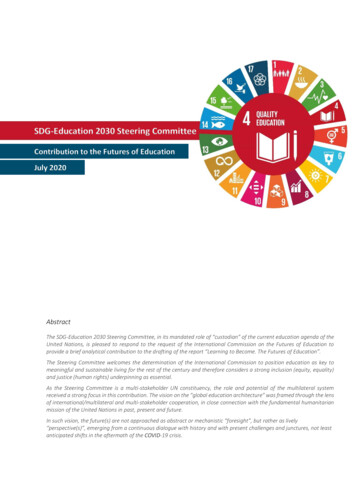
Finally, we discuss key insights that emerge from the cases and bring in elements of the state-ofthe-art in dashboard design.A closer look at the evolution of informationdashboardsAn information dashboard is “a visual display of the most important information needed to achievecertain objectives, that has been consolidated into a single screen so it can be monitored at aglance” (Few 2013). The term “dashboard” originates from the automobile dashboard wheredrivers monitor at-a-glance the major functions of their vehicle via a cluster of instruments.Historically, the dashboard was a board in front of a carriage that protected the driver from specksand dashes of mud.Figure 1: Dashboard, definitionA dashboard is a form of delivering a progress report. Sometimes also referred to or known asmanagement dashboard or business intelligence dashboard, they are data visualization tools thatdisplay status of metrics and key performance indicators (KPIs) for a country, an organization ora project. Unlike periodic extensive written reports, dashboards are designed and used tomaintain situation awareness on real-time and provide snapshots of performance.In today’s world of information overload, dashboard design has turned into an art of how to displaydata for at-a-glance monitoring as they consolidate numbers, metrics, and sometimesperformance scorecards on a single screen. Among all the information tools, what is specificabout dashboards is that (1) they are linked to a database with the ability to pull real-time datafrom multiple sources and (2) they are designed to provide an at-a-glance view of vast amountsof information synthesized through graphs, indicators, symbols and others.Often the terms dashboards and scorecards are used interchangeably, but they are not thesame. Like the dashboard in a car, an information dashboard is a display of various meters,6
gauges, and lights that give up-to-date information of an initiative. Metrics do not inherently tellyou whether the results are positive or negative. Performance scorecards use a prescriptiveformat that employs spotlight indicators (for example, red, yellow or green) to indicate the qualityof performance, comparing results with goals. Like a school report card, the scorecard usuallymeasures periodic results (weekly, monthly, quarterly, annually) against a predetermined goal,allowing users to gauge how their performance stacks up against expectations. A dashboard may-but need not- include performance scorecards.Nowadays dashboards are essential in the business management toolkit. The popularity ofdashboards as management tool was the result of the adoption of a business approach thatinvolved the identification and use of key performance indicators (KPIs). Introduced by Kaplanand Norton in the late 1990s, the approach relied on the now well-known balanced scorecard, aspecial type of dashboard. Later, the increased pressure for corporate accountability fosteredwide adoption of dashboards a tool to help keep an eye on performance on real time.Dashboards emerged as a tool to navigate available but cumbersome, large and oftencomplex databases that had been used almost exclusively by those highly proficient indata analysis. Hence, information dashboards are the tip of the iceberg in a system that producesand uses data for management purposes.Information dashboards in the development agendasThe field of development has been ripe for the adoption of information dashboards, if nothing else,because of the availability of large and complex databases such as those of the WorldDevelopment Indicators and the Human Development Reports and even more with the roll out ofthe MDG as the first highly-structured development agenda at the beginning of the millennium.Still, dashboards were not part of the development toolbox in the first half of the MDG period. Forexample, it was not until 2013 that the World Bank launched its MDG Dashboard3, with a set ofsix interactive dashboards to explore progress status and trends on a small set of MDG indicatorsfrom the World Development Indicator database.In contrast, dashboards have been at the core of the 2030 Agenda from its inception, both at theglobal and national levels. For example, the World Bank’s SDG Dashboard4 has been availablesince 2015 and the Sustainable Development Solutions Network (SDSN)/Bertelsmann Stiftung’sSDG Index & Dashboards5 was launched in 2016. At the national level, México presented its SDGpilot dashboard as a side event to the 2015 UN General Assembly.This evolution is the result of a time of intense experimentation in developing new methodologiesto explore, develop and make information available to different development stakeholders. TheMDGs posed an enormous challenge for statistical development in terms of monitoring andreporting on progress using a standardized system of indicators. In Latin America, most ndex.org/data/47
began to report their progress on the MDGs in the middle of the 2000s and by 2015 had severalpublications available.In the transition to the 2030 Agenda, a number of countries in Latin America are rolling out theimplementation of the new framework with new and revamped development informationdashboards. These experiences may be of interest for other countries in their own endeavors toleverage new information tools in the implementation of the SDGs.Mapping of SDG/MDG information dashboards in Latin AmericaThis report reviews emerging practices in development information dashboards across the LatinAmerican region. It looks at how dashboards have been set up, what data was included, whatwas the IT architecture, what were the institutional and governance arrangements, what were theconsiderations around sustainability and, most importantly, what are the lessons learned todevelop the new generation of SDG dashboards (see research questions in Annex 1)The first stage was a scoping exercise where we identified MDG and SDG dashboards throughliterature review and consultation with experts and then compiled basic information on each ofthem. In all, we found MDG/SDG dashboards in 10 countries (Argentina, Bolivia, Brazil, Colombia,Dominican Republic, El Salvador, Guatemala, Honduras, Mexico, and Panama), later anadditional country was added to the group (Paraguay). We explored the different dashboards andcarried out a summary desk review on them. There were important differences in their structure,data, and institutional arrangements (see summary table in Annex 2). Through a process ofinternal discussion and consultation with experts, five cases were chosen based on their features,results, and scalability.Five country-level experiences of SDG dashboards6The five cases selected for the case studies are very different from each other. Brazil, Mexico,and Colombia have been powerhouses in innovation for the MDG/SDG agendas, each countrywith a different angle. Panama and Paraguay, on the other hand, are smaller countries, withoutthe legacy and depth of institutional capacities, but with early pilot SDG dashboards. In thosecountries we identified 12 different development dashboards. Together, the five cases and twelvedashboard experiences will help to illuminate the different approaches and trade-offs in setting upinformation dashboards to support the implementation of the SDGs (see figure 2)Figure 2: Summary table of development information toolsName and linkRelatorios Dinamicos, MDG meworkMDGDataResults6Experiences were documented based on interviews and desk research. Initial research was conducted betweenAugust and October of 2016, and updated between January and March of 2017. The cases are presented inalphabetical order.8
Atlas do Desenvolvimiento veSDGResultsColombia2004ActiveNDPProcess &resultsColombia2017 (e)In ResultsPanama2017 (e)In asbrasil.org.br/2030 Agenda /sinergiapp.dnp.gov.co/#HomeSeguimientoSDG PortalIn development, link not available for public delmilenio.org.mx/SDG Pilot DashboardPilot platform, link not availableBeta version a/inec/sidSDG pilot platformPilot platform, link not availableParInfoLink no longer availableSDG platformLink not yet available for public access&&BrazilBrazil was the cradle for the 2030 Agenda with its hosting of the United National Conference onSustainable Development (UNCSD), also known as Rio 20 or Earth Summit 2012. The primaryresult of the conference was the nonbinding document, "The Future We Want," where heads ofstate of the 192 governments in attendance renewed their political commitment to sustainabledevelopment and declared their commitment to the promotion of a sustainable future. Thedocument included language supporting what later would be known as the SustainableDevelopment Goals (SDGs). Brazil was a force throughout the post-2015 process.However, the launch of the 2030 Agenda coincided in Brazil with times of political turmoil during2015-16, and albeit slowly, Brazil is gearing up for the implementation of the SDGs. In October2016, The National Commission for the Sustainable Development Goals was created as the maininstitutional mechanism for the implementation of the 2030 Agenda. As explained in Brazil’svoluntary review at the UN High Level Political Forum, the Commission functions as “an advisoryand parity body, aiming to internalize, disseminate and confer transparency to the 2030 Agendaimplementation process, constituting the space for integration [of initiatives beyond the federalgovernment], engagement and dialogue with federate entities and civil society” (Brazil 2017).Another important step toward the implementation of the SDG in Brazil was the partnering withexisting civil society organization networks towards the implementation of the 2030 Agenda. Brazil9
was a powerhouse in the implementation of the MDG and there were lessons learned on theimportance of social participation in the dissemination and implementation of an internationalagenda. This factor was so important that one of the main guidelines adopted at the Rio 20Conference defined that Agenda 2030 would be built "from the bottom up" and in consultationwith civil society on its priorities. As a result of this process in Brazil, a broad network of civilsociety organizations was formed, including 5 major national networks that are now involved inthe SDGs: the national movement ODS Nós Podemos created in 2004 to promote the MDGs, theCivil Society Working Group Agenda 2030, created in preparation for Rio 20 and participant inthe negotiations on the SDGs, the Sustainable Cities Program, the SDG Network of public andprivate institutions, civil society organizations, social movements, indigenous peoples, andtraditional communities working on human rights and sustainable development goals; and theSDG Strategy -an inter-sectoral coalition of entities promoting debate on ways to implement theSustainable Development Objectives and search for solutions to reach them.For the purposes of this research, in Brazil there are three information tool of interest: two MDGdashboards, the MDG Observatory and Atlas-Brazil, and the brand-new 2030 Agenda Platform(see timeline in figure 3).Figure 3: Summary infographic: development dashboards in BrazilSource: UNDP-SIGOB with information from different sources10
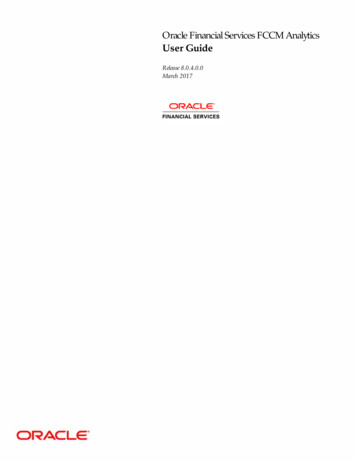
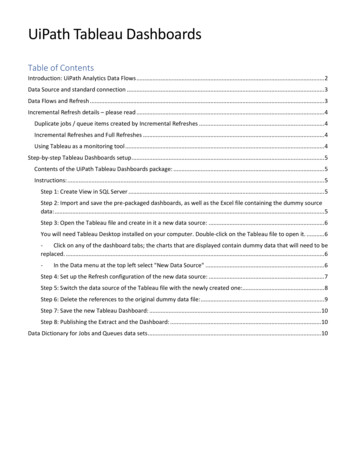
Brazil institutionalized the MDGs in 2004 and made early strides in advocacy and mainstreaming.With a population of 205 million people and a federal government with 27 States and 5,570municipalities, in Brazil the main challenge of any development agenda is mainstreaming thepriorities to subnational and local levels as local governments have a broad degree of autonomy.To encourage civil society and local governments’ participation in the MDGs, the federalgovernment with the support of UNDP Brazil, created in 2004 the national Movement for CivicAction and Solidarity, a non-partisan and pluralistic movement of volunteers devoted to achievingthe MDGs in Brazil. This movement pulled talents and resources into achieving the MDGs. Forexample, the well-known MDG icons were designed in Brazil as part of this 2004 nationaladvocacy campaign and were later adopted at the global level (see figure 4). Also in 2004, theMDG Award was created to encourage, value and give visibility to civil society organizations andmunicipalities which contributed to achieving the MDGs. It was awarded every two years until2014 and mobilized thousands of individuals in Brazil.Figure 4: The MDGs icons before and after the Brazilian 2004 campaignCirca 2004The municipalities also organized their own MDG network (Rede ODM Brasil) and in 2009launched the MDG Observatory7. The portal was developed and maintained by the ServicioSocial de Industria SESI, a branch of the Federation of Industries of the State of Paraná, andcoordinated with UNDP. The initiative also received support from UNICEF, civil society groups,private firms and from the National Ministry of Planning, Budget, and Management. The MDGobservatory was a multi-functional portal which provided access to the interactive dashboard7http://www.portalodm.com.br/11
Relatorios Dinamicos8 as well as a library of publications, progress reports, news bulletinboards, tips for citizens and businesses to contribute to the MDGs, and a database on goodpractices of high-impact municipal policies. The dashboard provides access to official public dataon the 60 MDG indicators and produces state and municipal MDG profiles (see in figure 5 theMDG report for one municipality). Both the MDG Portal and the Relatorios Dinamicos dashboardare still online and active.Figure 5: Snapshot Relatórios Dinámicos, municipality of Aguas talodm/12
Source: http://www.relatoriosdinamicos.com.br/portalodm/, consulted January 2017The other dashboard is the Atlas of Human Development Brazil9 which focuses on the humandevelopment index (HDI) and includes the MDGs. Atlas Brazil is an initiative of the governmentthink tank Institute for Applied Economic Research IPEA, the public-sector foundation JoaoPinheiro Foundation, and UNDP. Atlas Brazil was part of a larger research project to localize HDIand popularize the concept of development centered on people. Since its first edition, the MHDIhas produced insightful results by exposing the wide territorial disparities in Brazil.Available since 2011 and relaunched in 2013 with a broader set of indicators, the Atlas of HumanDevelopment in Brazil is an online consultation platform for the Municipal Human DevelopmentIndex (MHDI) of the 5,565 Brazilian municipalities and for over 200 indicators on population,education, housing, health, work, income and vulnerability, with data extracted from theDemographic Censuses of 1991, 2000 and 2010 (see Figure 6). As time went by, additionaldataset were made available through this information tool; for example, in 2014, the MHDI for theMetropolitan Regions; and more recently, in 2016, disaggregated data by gender, urbanizationand ethnicity (see Figure 7).9http://www.atlasbrasil.org.br/13
Figure 6: Snapshot Atlas Brazil, front pageSource: http://www.atlasbrasil.org.br/, consulted January 2017Figure 7: Atlas Brazil: Choice of variables and geographical units in query14
Source: http://www.atlasbrasil.org.br/, consulted August 2017Atlas Brazil offers the user the choice of looking at profiles (full reports), maps, radar graphs, HDItrees and HDI ranking. While, profiles are longer and heavier in text and data than the usualdashboard aesthetics10, Atlas Brazil offers a single dimension ranking on the the MHDI, makingpossible comparison between Brazilian municipalities over time.Figure 8: Atlas Brazil, MHDI scorecard ranking10A municipal profile is an 11-page report with information on HDI, demography, health, education, income, laborforce, housing and social vulnerability.15
It is important to understand some elements of the data ecosystem in Brazil. First, the countryhas a strong statistical institute, Instituto Brasileiro de Geografia e Estatística IBGE, that producesa regular and reliable census every 10 years, household surveys and other instruments. Second,there is IPEA, a government think-tank that is part of the Presidency11. With its cadres ofeconomists and analysts, IPEA is a powerhouse of analytical capacities. Among its other tasks,IPEA was responsible for reporting on the MDGs. Third, UNDP Brazil strategy on its HDR,emphasizing disaggregation of data and adopting the format of an Atlas rather than a conventionalreport, had made the human development products very influential in government policy making(UNDP Evaluation Office 2006). When the online information tool Atlas was launched in 2011,UNDP and its partners had the experience of producing 3 previous Atlases in earlier electronic11The Institute for Applied Economic Research (IPEA) is a federal public foundation linked to the Secretariat ofStrategic Affairs of the Presidency of the Republic (SEA/PR). It provides technical and institutional support togovernment actions – enabling the formulation and reformulation of public policies and Brazilian developmentprograms. Its work is made available to society through numerous regular publications and seminars. IPEA’s missionis to “enhance public policies that are essential to Br
the-art in dashboard design. A closer look at the evolution of information dashboards An information dashboard is "a visual display of the most important information needed to achieve certain objectives, that has been consolidated into a single screen so it can be monitored at a glance" (Few 2013).