Transcription
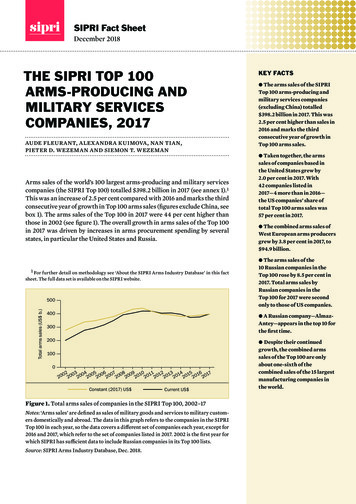
SIPRI Fact SheetDecember 2018THE SIPRI TOP 100ARMS‑PRODUCING ANDMILITARY SERVICESCOMPANIES, 2017aude fleurant, alexandra kuimova, nan tian,pieter d. wezeman and siemon t. wezemanArms sales of the world’s 100 largest arms-producing and military servicescompanies (the SIPRI Top 100) totalled 398.2 billion in 2017 (see annex 1).1This was an increase of 2.5 per cent compared with 2016 and marks the thirdconsecutive year of growth in Top 100 arms sales (figures exclude China, seebox 1). The arms sales of the Top 100 in 2017 were 44 per cent higher thanthose in 2002 (see figure 1). The overall growth in arms sales of the Top 100in 2017 was driven by increases in arms procurement spending by severalstates, in particular the United States and Russia.1 For further detail on methodology see ‘About the SIPRI Arms Industry Database’ in this factsheet. The full data set is available on the SIPRI website.Total arms sales (US b.)500400w The arms sales of the SIPRITop 100 arms-producing andmilitary services companies(excluding China) totalled 398.2 billion in 2017. This was2.5 per cent higher than sales in2016 and marks the thirdconsecutive year of growth inTop 100 arms sales.w Taken together, the armssales of companies based inthe United States grew by2.0 per cent in 2017. With42 companies listed in2017—4 more than in 2016—the US companies’ share oftotal Top 100 arms sales was57 per cent in 2017.w The combined arms sales ofWest European arms producersgrew by 3.8 per cent in 2017, to 94.9 billion.w The arms sales of the10 Russian companies in theTop 100 rose by 8.5 per cent in2017. Total arms sales byRussian companies in theTop 100 for 2017 were secondonly to those of US companies.w A Russian company—AlmazAntey—appears in the top 10 forthe first time.3002001000KEY FACTS02 03 04 05 06 07 08 09 10 11 12 13 14 15 16 1720 20 20 20 20 20 20 20 20 20 20 20 20 20 20 20Constant (2017) US Current US Figure 1. Total arms sales of companies in the SIPRI Top 100, 2002–17Notes: ‘Arms sales’ are defined as sales of military goods and services to military customers domestically and abroad. The data in this graph refers to the companies in the SIPRITop 100 in each year, so the data covers a different set of companies each year, except for2016 and 2017, which refer to the set of companies listed in 2017. 2002 is the first year forwhich SIPRI has sufficient data to include Russian companies in its Top 100 lists.Source: SIPRI Arms Industry Database, Dec. 2018.w Despite their continuedgrowth, the combined armssales of the Top 100 are onlyabout one-sixth of thecombined sales of the 15 largestmanufacturing companies inthe world.
2sipri fact sheetDEVELOPMENTS IN THE TOP 100The Top 100 companies are ranked by their total annual arms sales. Ashas been the case every year since 2002, companies based in the USA andWestern Europe continued to dominate the Top 100 in 2017: a total of 66 USand West European companies are listed. Their combined arms sales of 321.5 billion were 2.5 per cent higher than in 2016, and together theyaccounted for 81 per cent of Top 100 arms sales in 2017.The combined arms sales of West European arms pro ducers in theTop 100 grew by 3.8 per cent in 2017, to 94.9 billion. The arms sales of companies based in the United Kingdom were the highest in Western Europe( 35.7 billion in 2017), accounting for 9.0 per cent of the Top 100 total in2017 (see figure 2). Between 2002 and 2016, the annual combined armssales of British companies in the Top 100 were second only to those of UScompanies. However, in 2017 Russia was the second largest arms producerin the Top 100: the combined arms sales of Russian companies ( 37.7 billion)accounted for 9.5 per cent of the Top 100 total in 2017.The arms sales of the 10 largest companies in the Top 100 amounted to 198.2 billion in 2017—an increase of 10 per cent ( 2.1 billion) comparedwith their arms sales in 2016. The top 10 accounted for 50 per cent of totalTop 100 arms sales in 2017. Notably, 2017 was the first year that a Russiancompany appeared in the top 10: Almaz-Antey, which ranked 10th, is also thefirst company based outside the USA or Western Europe to be ranked in thetop 10. Five US and four West European companies occupied the other ninepositions in the top 10 in 2017.MAJOR ARMS-PRODUCING COUNTRIESThe United StatesThe combined arms sales of the 42 USA-based companies in the Top 100grew by 2.0 per cent in 2017, to 226.6 billion, accounting for 57 per cent ofthe overall total (see figure 3). Considering the volume of US arms sales andthe number of companies ranked in 2017, the USA will continue to be theworld’s largest producer of arms for the foreseeable future.Lockheed Martin remains, by far, the largest arms producer in the world,with arms sales of 44.9 billion in 2017—an increase of 8.3 per cent comparedwith 2016. The increase was mainly due to ongoing deliveries of F-35 combataircraft, missiles and anti-missile systems, and Aegis naval combat systems.The growth in Lockheed Martin’s arms sales and the 11 per cent drop inthose of Boeing widened the gap between the top two arms pro ducers toBox 1. Chinese arms-producing companiesChinese arms-producing companies are not covered by the SIPRI Top 100 due to the lack of data on which to make a reasonableor consistent estimate of arms sales dating back to 2002. Nonetheless, some information is available on several major companiesthat are part of the mainly state-owned Chinese arms industry.SIPRI estimates that three Chinese arms companies would be ranked in the top 10 of the Top 100 arms-producing and militaryservices companies: AVIC with arms sales of 20.1 billion, NORINCO with 17.2 billion and CETC with 12.2 billion. Based onthe limited information available and taking into account arms exports and the general growth in China’s military spending, atleast seven other arms companies would probably be in the Top 100 if figures for arms sales were available.
the sipri top 100 arms-producing companies, 2017 18.0 billion in 2017. The fall in Boeing’s arms salescan be partially attributed to delays in the deliveryof KC-46 tanker aircraft and the end of deliveries ofC-17 transport aircraft. 2There were several large mergers and acquisitionsby US companies in 2017. The acquisitions of Rockwell Collins by United Technologies and of OrbitalATK by Northrop Grumman were particularly noteworthy. The buying companies may have made theacquisitions with the aim of gaining an advantageagainst their competitors in the upcoming majorarms- acquisition programmes announced by theUSA in 2016 and 2017, which will include the modernization of US nuclear forces.In contrast, the recent trend in consolidations ofUS military services companies slowed in 2017. Inthe past few years some of the larger arms- producingcompanies have spun off their military servicesactivities in order to focus on their core capabilitiesand often also because the growth in revenue fromsuch activities was far lower than anticipated. Inmany cases, the resulting smaller companies havethen merged into larger military services companies.However, the only example of this in 2017 was theformation of DXC (ranked 82nd in the Top 100),following the merger of Computer Sciences Cor por ation and relevant parts of Hewlett Packard Enterprise Services’ business.3Other 3.5%South Korea 1.4%India 1.9%Israel 2.0%Germany 2.1%Japan 2.2%Italy 2.6%United States 57%Trans-European 3.7%France 5.3%United Kingdom 9.0%Russia 9.5%Figure 2. Share of arms sales of companies in the SIPRITop 100 for 2017, by countryNotes: The Top 100 classifies companies according to the countryin which they are headquartered. The Top 100 does not includethe entire arms industry in each country covered, only the largest companies. The category ‘Other’ consists of countries whosecompanies’ arms sales comprise less than 1% of the total: Australia,Brazil, Canada, Poland, Singapore, Spain, Sweden, Switzerland,Turkey and Ukraine. Figures do not always add up to a total of 100%because of the conventions of rounding.Source: SIPRI Arms Industry Database, Dec. 2018.Western EuropeThe combined arms sales of the seven British companies in the Top 100amounted to 35.7 billion in 2017—an increase of 2.3 per cent compared with2016, largely due to increases in the arms sales of BAE Systems, Rolls-Royceand GKN (see annex 1). BAE Systems, which is ranked fourth in the Top 100,remains the UK’s biggest arms producer. Its arms sales rose by 3.3 per cent,to 22.9 billion in 2017. BAE Systems is a clear example of an internationalized arms-producing company: 29 000 of its 83 000 personnel are employedby a US subsidiary. GKN’s arms sales rose by 20 per cent in 2017—the highestannual increase among British companies. This was the second consecutiveyear of double-digit growth in GKN’s arms sales, which is due to high globaldemand for its aircraft components. In contrast, the arms sales of BabcockInternational—which is involved in the maintenance and production of British Navy ships including new nuclear submarines—fell by 1.9 per cent in 2017after two consecutive years of significant growth. This was mostly due to aslowdown in domestic procurement.2 As Boeing altered its reporting in 2017, the method used to estimate its arms sales has changedcompared with 2016, which may also explain the difference between the 2 years.
4sipri fact sheetThe total arms sales of the six French companiesin the Top 100 rose by 11 per cent, to 21.3 billion inUnited StatesRussia2017. While all six companies increased their armsUnited Kingdomsales in 2017, the significant growth in the arms salesFranceof the combat aircraft producer Dassault and theTrans-Europeanshipbuilder Naval Group stand out. Dassault’s armsItalysales grew by 48 per cent, to 2.1 billion in 2017, dueJapanin large part to contracts with India and Qatar forGermanycombat aircraft. Naval Group’s arms sales rose byIsrael15 per cent, to 4.1 billion, which can be attributedIndiato its ongoing production of submarines and frigatesSouth Koreafor the French Navy, Brazil and India, and of frigatesOtherfor Egypt.–25 –20 –15 –10 –5051015The two Italian arms companies ranked in theTop 100, Leonardo and Fincantieri, both had stableFigure 3. Percentage change in arms sales of companies inarms sales in 2017 compared with 2016, with slightthe SIPRI Top 100, by country, 2016–17increases of 0.9 and 0.4 per cent, respectively. Leo Notes: The change refers to the companies in the Top 100 for nardo, which is one of the world’s largest arms pro2017. The figures are based on arms sales in constant (2017) US dol- ducers, reported arms sales of 8.9 billion in 2017.lars. The category ‘Other’ consists of countries whose companies’While there were modest increases in its defencearms sales comprise less than 1% of the total: Australia, Brazil,electronics and aeronautics business segments,Canada, Poland, Singapore, Spain, Sweden, Switzerland, Turkeyits helicopter business segment decreased in 2017,and Ukraine.affecting overall results.Source: SIPRI Arms Industry Database, Dec. 2018.Arms sales by the four German companies in theTop 100 grew by 10 per cent overall in 2017, to 8.3 billion. The growthwas mainly due to the 61 per cent rise in the arms sales of Krauss-MaffeiWegmann (KMW)—the highest increase recorded by any company in theTop 100 for 2017. The sharp rise in KMW’s arms sales is largely attributableto the growing domestic demand for its armoured vehicles and to deliveriesof tanks to Qatar. One of the four German companies is a new entrant to theTop 100: Hensoldt, which is ranked 74th, was formed after the acquisitionby an investment fund (KKR) of a German division of Airbus Group thatproduces military electronics.The one Spanish company in the Top 100, the shipyard Navantia, increasedits arms sales by 23 per cent in 2017, to 910 million. The Top 100 for 2017 alsoincludes a Swedish company, Saab, whose arms sales fell by 5.3 per cent, anda Swiss company, RUAG, whose arms sales rose by 5.6 per cent.SIPRI categorizes companies whose ownership and control structuresare located in more than one European country as ‘trans-European’. AirbusGroup, which was ranked seventh in 2017 and whose main arms-productionfacilities are located in France and Germany, falls into this category. Its armssales fell by 13 per cent in 2017, to 11.3 billion, which can be attributed tothe above-mentioned sale of its German military electronics division and todelays in deliveries of the A400M military transport aircraft.RussiaThe arms sales of the 10 Russian companies in the Top 100 amounted to 37.7 billion in 2017, accounting for 9.5 per cent of total Top 100 arms sales.
the sipri top 100 arms-producing companies, 20175Their combined arms sales were 8.5 per cent higher than in 2016. 3 In generalterms, the arms sales of Russian companies have grown significantly since2011 in line with Russia’s increased spending on arms procurement for itsarmed forces. Arms exports by Russian companies have remained relativelystable over the same period.Almaz-Antey, which produces advanced air defence systems (such as theS-400), is the first Russian company to be ranked in the top 10 since SIPRIbegan to include Russian companies in its Top 100 lists. Due to ongoingdomestic and foreign demand, its arms sales grew by 17 per cent in 2017, to 8.6 billion.Eight of the nine other Russian companies included in the Top 100 alsoincreased their arms sales, three by more than 15 per cent: United EngineCorporation (25 per cent), High Precision Systems (22 per cent) and TacticalMissiles Corporation (19 per cent). The only Russian company to report adecrease in arms sales in 2017 was UralVagonZavod. With a drop in armssales of 33 per cent, it fell from 53rd position in 2016 to 66th in 2017. Thisdecrease is probably due to delays in deliveries of new tanks and otherarmoured vehicles to Russia.Russia started an initiative to consolidate its arms industry in 2007. Theaim is to create larger companies that operate in specific arms-related sectors (e.g. United Aircraft Corporation and United Shipbuilding Corporation,which were the second and third largest Russian arms producers in 2017).The consolidation process, which is nearing completion, continued in 2017:the merger of United Instrument Manufacturing Corporation (UIMC) withRussian Electronics resulted in the formation of a new company that willcontinue to operate under the name Russian Electronics. The new company,which takes on UIMC’s relatively large arms-production business and themore modest arms-related business of the original Russian Elec tronics,entered the Top 100 in 2017 in 47th position. Further consolidation is plannedin the land systems sector over the next few years.OTHER ESTABLISHED PRODUCERSEight countries with companies ranked in the Top 100 for 2017 are categor ized by SIPRI as ‘other established producers’: Australia, Canada, Israel,Japan, Poland, Singapore, South Korea and Ukraine.4 In 2017 the combinedarms sales of the 17 companies based in the countries in this category totalled 27.9 billion, 6.9 per cent less than in 2016. They accounted for 7.0 per cent ofthe Top 100 total in 2017.As was the case in previous years, Japan was the largest arms producer inthe ‘other established producers’ category in 2017. The combined arms salesof the five Japanese companies in the Top 100 amounted to 8.7 billion in2017, accounting for 2.2 per cent of the Top 100 total. Arms sales by the threelargest Japanese arms-producing companies—Mitsubishi Heavy Industries,Kawasaki Heavy Industries and Fujitsu—remained stable. The arms sales of3 This includes the ‘pro forma’ arms sales in 2016 of the new company Russian Electronics, whichwas formed in 2017. See annex 1.4 The ‘other established producers’ category includes countries that rank arms-producing andmilitary services companies in the Top 100 and have mature and, in many cases, significant armsproducing capabilities, but do not intend to develop their capabilities further.
6sipri fact sheetthe two other companies followed contrasting trajectories: NEC’s arms salesrose by 7.8 per cent, while IHI Corporation’s fell by 7.6 per cent. AlthoughJapan lifted its long-standing ban on arms exports in 2014, it has not yetresulted in a notable increase in arms exports and Japanese companiesremain largely reliant on domestic demand for arms sales. However, Fujitsudoes generate significant overseas revenues from the provision of infor mation technology services to the militaries of other countries.With combined arms sales of 7.9 billion, the three Israeli companies listedin 2017 accounted for 2.0 per cent of the Top 100 total. Considering the smallsize of the country, Israel’s arms sales are relatively high: despite an overalldecrease of 3.9 per cent in 2017, the total arms sales of Israeli companiesremain comparable with those of German or Japanese companies in theTop 100. This is a result of high domestic demand and a large and diverseexport customer base.The South Korean arms industry has matured over the past few years andnow covers all of the main arms-production sectors, including ships, aircraft, land systems, electronics and ammunition. South Korean companieshave also increased their arms exports significantly in recent years. FourSouth Korean companies are listed in the Top 100 for 2017. With combinedarms sales of 5.5 billion, they accounted for 1.4 per cent of the Top 100 total.However, all four companies saw a drop in their arms sales in 2017, leadingto an overall decrease of 23 per cent compared with 2016—the largest annualpercentage decrease of any country that ranked companies in the Top 100 in2017. Korea Aerospace Industries (KAI) and DSME had the largest reductions in arms sales. The 53 per cent (almost 1 billion) fall in KAI’s armssales accounted for 60 per cent of the overall decrease in South Korean armssales. KAI fell from 50th in the Top 100 in 2016 to 98th in 2017. Several ofKAI’s large programmes for the South Korean armed forces are coming toan end, while deliveries of new helicopters have been delayed. DSME’s armssales fell by 25 per cent in 2017. However, such dips in arms sales are notuncommon among shipbuilders, and it is likely that DSME’s arms sales willincrease in the coming years due to existing contracts with the Korean Navyand export customers.As in 2016, one company from each of Australia, Canada, Poland, Singa pore and Ukraine ranked in the Top 100 for 2017. There were marginalincreases in the arms sales of the Australian and Canadian companies, andslight decreases in those of the Singaporean and Polish companies. Armssales by UkrOboronProm, the company under which most of Ukraine’s armspro duction is organized, fell by 11 per cent in 2017. This was largely due toinflation.EMERGING PRODUCERSThree countries with companies ranked in the Top 100 are categorized bySIPRI as ‘emerging producers’ in 2017: Brazil, India and Turkey. Emerging producers have expressed ambitions to develop their arms-productioncapabil ities to higher levels in most arms-production sectors (i.e. naval, air,land, electronics and ammunition). The combined arms sales of the sevencom panies based in the countries in this category were 11.1 billion—an
the sipri top 100 arms-producing companies, 20177increase of 8.1 per cent compared with 2016. These companies accounted for2.8 per cent of total Top 100 arms sales in 2017.India is the largest arms producer in this category, with four companiesranked in the Top 100. Their combined arms sales of 7.5 billion in 2017 were6.1 per cent higher than in 2016. The two largest Indian arms pro ducers,Indian Ordnance Factories and Hindustan Aeronautics, are the highestranking (37th and 38th, respectively) companies in 2017 among countries inthe ‘emerging producers’ category. These two companies along with BharatElectronics have been listed in the Top 100 since 2002. A fourth company,Bharat Dynamics, entered the Top 100 in 2017 (ranked 94th) with arms salesof 880 million. There was a marginal decrease in Hindustan Aeronautics’total arms sales, while the totals of the other three companies each roseby approximately 10 per cent. All four companies are state-owned and arealmost entirely dependent on domestic demand. The overall increase inarms sales in 2017 is a result of India’s aims to modernize its armed forcesand source its military equipment from Indian companies as far as possible.Turkey has ambitions to develop its arms industry to fulfil its increasingdemand for weapons and become less dependent on foreign suppliers. Thisis reflected in the increase of 24 per cent in 2017 in the combined arms salesof the two Turkish companies in the Top 100: ASELSAN, which produceselectronics, and Turkish Aerospace Industries, which produces aircraft.The only South American arms company in the Top 100 is Brazil’s Embraer,which is ranked 84th. Embraer’s arms sales decreased by 10 per cent in 2017,to 950 million.A COMPARISON OF THE TOP 100 WITH THE WORLD’S LARGESTMANUFACTURERSThe arms industry is often perceived as ‘big business’. To provide a morerealistic picture, the largest arms-producing and military services com panies from the Top 100 are compared here with the world’s largest companies in the manufacturing sector as listed in the Fortune Global 500 for2017. Such a comparison is appropriate since the production and development processes of most manufacturers and arms producers are similar.Sales of the top 15 manufacturing companies totalled 2311 billion in 2017(see table 1). This is almost 10 times greater than the total arms sales of thetop 15 arms producers ( 231.6 billion). To put this into clearer perspective,the sales of these 15 manufacturing companies are almost six times greaterthan the total combined arms sales of the Top 100 arms-producing com panies ( 398.2 billion). The sales of one company alone—Toyota, the world’slargest manufacturing company, which totalled 254.7 billion in 2017—are10 per cent higher than the total combined arms sales of the top 15 armsproducers.Lockheed Martin, the world’s largest arms company, is ranked 178th inthe Fortune Global 500 for 2017 and ranks outside the top 50 largest manufacturers. Its arms sales represent only 18 per cent of Toyota’s total sales andare about half the size of the total sales of the company ranked 15th in theFortune Global 500: China Railway and Engineering Group.One company, General Electric, ranks highly as both a manufacturer andas an arms producer: it is 22nd in the Top 100 for 2017 and was also the
sipri fact sheet810th largest manufacturing company. However, its arms sales representedonly 3 per cent of its total sales and General Electric would not be includedin the Fortune Global 500 on the basis of its arms sales alone.Two other arms-producing companies, Boeing and Airbus Group, areamong the 50 largest manufacturing companies in the world. However,Boeing’s arms sales accounted for only 29 per cent of its total sales in 2017.If Boeing were to produce only arms, it would fall to rank around 400th inthe Fortune Global 500 for 2017. Similarly, Airbus Group would not featurein the Fortune Global 500 based on arms sales alone.Undoubtedly, this is an imperfect and rather crude comparison. However,the contrasts shown by the available data indicate that claims championingthe significant economic role and impact of the arms industry should beassessed very carefully.Table 1. The top 15 manufacturing companies in the Fortune Global 500 compared with the top 15 arms-producingand military services companies in the SIPRI Top 100, 2017Figures for arms sales and total sales are in billions of US dollars.Ranka123456789101112131415Top 15 manufacturingcompaniesToyotaVWAppleSamsung ElectronicsDaimlerGeneral MotorsFordHon Hai Precision IndustryHondaGeneral ElectricFiat Chrysler GroupcSAIC MotorNissanBMWChina Railway andEngineering GroupTotal top 15 salesTotal sales(US 6.7125.0113.9108.2104.197.0RankbTop 15 arms producers123456789101112131415Lockheed Martin Corp.BoeingRaytheonBAE SystemsNorthrop Grumman Corp.General Dynamics Corp.Airbus GroupThalesLeonardoAlmaz-AnteyUnited Technologies Corp.L-3 CommunicationsHuntington Ingalls IndustriesUnited Aircraft Corp.United Shipbuilding Corp.2311Arms sales(US 87.47.75.6231.6455.6Corp. Corporation.Note: Figures may not add up to stated totals due to the conventions of rounding.a Companies are ranked based on total sales as listed in the Fortune Global 500 for 2017.b Companies are ranked based on total arms sales as listed in the SIPRI Top 100 for 2017.c Fiat Chrysler Group is not listed separately in the Fortune Global 500, but as part of the holding company Exor.Sources: Fortune, ‘The Fortune Global 500’, 2017; and SIPRI Arms Industry Database, Dec. 2018.Total sales(US b.)
the sipri top 100 arms-producing companies, 20179Annex 1. The SIPRI Top 100 arms-producing and military services companies in the world excludingaChina, 2017Figures for arms sales and total sales are in millions of US dollars.RankbArmssales, 2017(US m.)Armssales, 2016(constant2017 US m.)dChange inarms sales,2016–17(%)Totalsales, 2017(US m.)Armssales as a% of totalsales, 20172017 2016 nited StatesUnited StatesUnited StatesUnited KingdomUnited StatesUnited StatesTrans-EuropeaneFranceItalyRussiaUnited StatesUnited StatesUnited States44 92026 93023 87022 94022 37019 46011 2909 0008 8608 5707 7807 7506 47041 48630 13223 39322 20821 85119 63512 9288 4208 7817 3207 0157 7916 5.751 04893 39225 34823 49025 80330 97375 23917 79912 9909 12259 8379 7537 41419221617231520363521RussiaRussiaUnited StatesUnited KingdomUnited StatesFranceUnited StatesUnited StatesUnited StatesRussiaJapan6 4404 9804 4604 4204 3804 1304 1004 0603 8303 6003 5706 1824 8643 5534 3364 3913 5864 8604 0842 5323 0313 5734.22.4261.9–0.215–16–0.65119–0.17 7445 58340 53419 34610 1704 16714 1985 804122 1003 62336 uropeaneUnited Kingdom3 4203 3803 2303 3733 3463 2941.41.0–1.96 6443 5016 siaUnited StatesUnited StatesUnited StatesFranceRussiaUnited States3 2203 1703 1503 0402 9802 9102 8302 7603 3133 1392 8794 2882 8902 6792 3242 685–2.81.09.4–293.18.6222.83 3953 90825 9006 1824 46819 0902 9074 45495811249671597623630Lockheed Martin Corp.BoeingRaytheonBAE SystemsNorthrop Grumman Corp.General Dynamics Corp.Airbus GroupThalesLeonardoAlmaz-AnteyUnited Technologies Corp.L-3 CommunicationsHuntington IngallsIndustriesUnited Aircraft Corp.United Shipbuilding Corp.Honeywell InternationalRolls-RoyceLeidosNaval GroupTextronBooz Allen HamiltonGeneral ElectricTactical Missiles Corp.Mitsubishi HeavyIndustriesRheinmetallMBDABabcock InternationalGroupElbit SystemsRussian HelicoptersBechtel Corp.fHarris Corp.CACI InternationalSafranHigh Precision SystemsScience ApplicationsInternational Corp.SaabSweden2 6702 818–5.33 18084373839404142383739513347Indian Ordnance FactoriesHindustan AeronauticsCSRAUnited Engine Corp.Israel Aerospace IndustriesOrbital ATKIndiaIndiaUnited StatesRussiaIsraelUnited States2 6502 6102 5802 5702 4802 3902 4422 6352 2972 0492 7901 9608.5–0.91225–11222 7642 7645 4004 0263 5384 764969448647050
10sipri fact sheetRankbArmssales, 2017(US m.)Armssales, 2016(constant2017 US m.)dChange inarms sales,2016–17(%)Totalsales, 2017(US m.)Armssales as a% of totalsales, 20172017 2016 65677460United StatesUnited StatesIsraelFranceRussiaJapanSouth KoreaFranceUnited StatesRussiaGermanyUnited StatesUnited StatesGermanySingaporeItalyUnited KingdomSouth KoreaTurkeyUnited StatesUnited KingdomIndiaUnited States2 3002 2202 2102 1702 1402 1402 1302 1202 0702 0601 9201 8401 7501 7501 6801 6601 5801 5601 4201 4201 4101 3801 3602 2771 9502 1272 0821 8942 1122 3541 4322 1651 9291 8311 3781 1131 0861 7061 6531 5101 6741 1011 3071 1791 2321 50.44.6–6.8298.62012–8.86 822.2 2585 6403 77114 0353 7295 41818 2032 39846 7066 8304 1711 8034 7945 6572 6321 5581 4692 00413 3451 6161 676869705363665977RussiaUnited StatesUnited StatesUnited KingdomTurkey1 3401 3001 3001 2501 2202 0131 3781 2761 4621 028–33-5.71.9–14192 2231 9321 6884 2441 420606777298671727374757677738276–927175Rockwell CollinsGeneral AtomicsfRafaelCEARussian ElectronicsgKawasaki Heavy IndustriesHanwha TechwinDassault Aviation GroupeAECOMKRETThyssenKruppOshkosh Corp.KBRKrauss-Maffei WegmannST EngineeringFincantieriCobhamLIG Nex1ASELSANDynCorp InternationalGKNBharat ElectronicsManTech InternationalCorp.UralVagonZavodEngilityBWX TechnologiesSercoTurkish AerospaceIndustriesAerojet RocketdyneTransDigm GroupPGZHensoldt hVencoreVectrusFujitsuUnited StatesUnited StatesPolandGermanyUnited StatesUnited StatesJapan1 2201 1901 1901 1601 1301 1201 1101 2059701 21212008781 2151 1191.323–1.8–3.329–7.8–0.81 8773 5041 3231 2171 3721 11536 ��878572861088189IHI Corp.Sierra Nevada dyne TechnologiesNavantiaJacobs Engineering GroupPrecision Castparts Corp.JapanUnited StatesAustraliaUkraineUnited StatesFranceBrazilSouth KoreaUnited StatesSpainUnited StatesUnited States1 0701 0201 0201 0201 0009609509409209109009001 1589199991 1481 0219381 0551 2459297381 ��110.214 1751 6001 0671 05324 5561 0145 8219 8212 60497610 0229 003864969649516103593910
the sipri top 100 arms-producing companies, 2017Rankb2017 2016 CompanycCountry90919293949596979899100United StatesUnited StatesUnited StatesUnited KingdomIndia
MILITARY SERVICES COMPANIES, 2017. aude fleurant, alexandra kuimova, nan tian, pieter d. wezeman and siemon t. wezeman. SIPRI Fact Sheet. December 2018. Arms sales of the world's 100 largest arms-producing and military services companies (the SIPRI Top 100) totalled 398.2. 1. billion in 2017 (see annex 1).