Transcription
Anaparti et al. Arthritis Research & Therapy (2017) 19:249DOI 10.1186/s13075-017-1459-xRESEARCH ARTICLEOpen AccessWhole blood microRNA expression patterndifferentiates patients with rheumatoidarthritis, their seropositive first-degreerelatives, and healthy unrelated controlsubjectsVidyanand Anaparti1,2,3 , Irene Smolik1,3,4, Xiaobo Meng1,2,3, Victor Spicer2, Neeloffer Mookherjee1,2,5and Hani El-Gabalawy1,2,3,4,5*AbstractBackground: Epigenetic mechanisms can integrate gene-environment interactions that mediate disease transitionfrom preclinical to clinically overt rheumatoid arthritis (RA). To better understand their role, we evaluated microRNA(miRNA, miR) expression profile in indigenous North American patients with RA who were positive for anticitrullinatedprotein antibodies; their autoantibody-positive, asymptomatic first-degree relatives (FDRs); and disease-free healthycontrol subjects (HCs).Methods: Total RNA was isolated from whole blood samples obtained from HC (n 12), patients with RA (n 18), andFDRs (n 12). Expression of 35 selected relevant miRNAs, as well as associated downstream messenger RNA (mRNA)targets of miR-103a-3p, was determined by qRT-PCR.Results: Whole blood expression profiling identified significantly differential miRNA expression in patients withRA (13 miRNAs) and FDRs (10 miRNAs) compared with HCs. Among these, expression of miR-103a-3p, miR-155,miR-146a-5p, and miR-26b-3p was significantly upregulated, whereas miR-346 was significantly downregulated, inboth study groups. Expression of miR-103a-3p was consistently elevated in FDRs at two time points 1 year apart.We also confirmed increased miR-103a-3p expression in peripheral blood mononuclear cells from patients withRA compared with HCs. Predicted target analyses of differentially expressed miRNAs in patients with RA and FDRsshowed overlapping biological networks. Consistent with these curated networks, mRNA expression of DICER1,AGO1, CREB1, DAPK1, and TP53 was downregulated significantly with miR-103a-3p expression in FDRs.Conclusions: We highlight systematically altered circulating miRNA expression in at-risk FDRs prior to RA onset, aprofile they shared with patients with RA. Prominently consistent miR-103a-3p expression indicates its utility as aprognostic biomarker for preclinical RA while highlighting biological pathways important for transition to clinicallydetectable disease.Keywords: MicroRNA, Rheumatoid arthritis, Epigenetics, miRNA, miR-103a-3p, Whole blood, miR-103a* Correspondence: hani.elgabalawy@umanitoba.ca1Department of Internal Medicine, Rady Faculty of Health Sciences, University ofManitoba, Room 799, 715 McDermot Avenue, Winnipeg, MB R3E 3P4, Canada2Manitoba Centre for Proteomics and Systems Biology, University ofManitoba, Winnipeg, MB, CanadaFull list of author information is available at the end of the article The Author(s). 2017 Open Access This article is distributed under the terms of the Creative Commons Attribution 4.0International License (http://creativecommons.org/licenses/by/4.0/), which permits unrestricted use, distribution, andreproduction in any medium, provided you give appropriate credit to the original author(s) and the source, provide a link tothe Creative Commons license, and indicate if changes were made. The Creative Commons Public Domain Dedication o/1.0/) applies to the data made available in this article, unless otherwise stated.
Anaparti et al. Arthritis Research & Therapy (2017) 19:249BackgroundRheumatoid arthritis (RA) is a chronic autoimmunedisease that results from a complex interplay betweengenetics, environmental factors, and the immune system.Retrospective studies of RA onset based on archival serumsamples have indicated that rheumatoid factor (RF) andanticitrullinated protein antibodies (ACPA) are detectablemonths to years prior to clinical disease onset, and theyexhibit a progressive increase in titer as disease onsetapproaches. In the case of ACPA, this phenomenon is believed to relate to expansion of an autoantigen repertoiretargeted by the ACPA, a process that has been termedepitope spreading [1–3].We previously demonstrated a high prevalence of RAin an indigenous North American (INA) population inManitoba, Canada, an observation that is consistent withthose in other INA populations [4]. In this population,RA is characterized by familial disease aggregation andearly age of disease onset [5, 6]. A high proportion ofthese INA patients with RA are genetically predisposedby having shared epitope encoding HLA-DRB1 alleles,particularly *1402 and *0404 [7]. The disease is primarilyseropositive, and it is severe and disabling, with frequentlarge joint involvement. In studying the first-degree relatives (FDRs) of INA patients with RA, we have demonstrated frequent RF and ACPA seropositivity, and wehave shown that the serum cytokine profile of the FDRsresembles that of their affected relatives more so thanthat of control subjects with no family history of autoimmune disease [6–8]. Thus, this population is ideallysuited for studying the onset of RA in high-risk individuals and the potential role that genetic, environmental,and epigenetic factors play in the process.MicroRNAs (miRNAs, miRs) are conserved, small,noncoding, single-stranded RNAs ( 18–25 nucleotides)that play a role in posttranscriptional gene regulation.miRNAs bind to the 3′-untranslated region (3′-UTR) oftarget messenger RNA (mRNA) and induce gene silencingby either promoting mRNA degradation or transcriptdestabilization, resulting in suppression of target proteinsynthesis [9, 10]. In RA, proinflammatory cytokines (e.g.,tumor necrosis factor-α, interleukin [IL]-1β, and IL-17)alter the expression of multiple miRNAs (e.g., miR-155,miR-146a, miR-26b, miR-16, and miR-21) in peripheralblood mononuclear cells (PBMCs), synovial fibroblasts,T lymphocytes, and synovial tissues derived from patients with RA [11–13]. In turn, miRNAs regulate inflammatory and signaling pathways influencing cellulardifferentiation and bone homeostasis within the synovial microenvironment [11]. Consequently, miRNAsplay a central role in the regulation of inflammatoryprocesses, synovial proliferation, and osteoclastogenesis, thus affecting the disease activity in RA [12–14].Therefore, miRNAs may serve as a critical epigeneticPage 2 of 11component in the breakdown of immune tolerance andprogression toward RA disease onset.There is limited knowledge on the role of miRNAs inRA pathogenesis, particularly during the preclinicalphase of the disease. To define mechanisms underpinning the progression of autoimmunity toward diseaseonset in at-risk individuals, we sought to evaluatemiRNA expression profiles in blood samples derivedfrom INA patients with RA, their seropositive FDRs,and healthy control subjects (HCs). This is the firststudy to demonstrate unique and reproducible differences in miRNA expression patterns in whole blood between these groups. Furthermore, we demonstrated thatmiR-103a-3p is uniquely upregulated in both patientswith RA and FDRs. The observed miRNA patterns andthe molecular networks they represent are of value indefining new mechanisms involved in RA onset whilebeing potentially useful as biomarkers for predicting onset of preclinical RA.MethodsStudy designINA study participants were recruited from Cree,Ojibway, and Oji-Cree communities in central Canada[5, 6]. The biomedical research ethics board of theUniversity of Manitoba approved the overall design ofthe study and the consent forms (ethics, 2005:093;protocol, HS14453). Specific research agreements withthe study communities were developed and approvedby the community leadership. The conduct of the studywas guided by the principles of community-based participatory research, a cornerstone of the Canadian Institutesof Health Research guidelines for Aboriginal health research (http://www.cihr-irsc.gc.ca/e/29134.html). As such,community leadership provided input into the initial development of the project, as well as ongoing input throughadvisory board meetings. Local healthcare providers weretrained in study methodology and standard operating procedures. Regular knowledge translation activities such asnewsletters and local radio appearances by study investigators provided the communities with updates regardingprogress and significance. The study participants providedinformed consent after the study was explained to them indetail, with the help of an INA translator from their community where necessary. The following three groups wereincluded in this study: (1) ACPA-positive patients withRA, (2) their unaffected ACPA-positive FDRs, and (3)HCs negative for ACPA and RF. The demographics of thestudy groups are summarized in Table 1. RA diagnosiswas made on the basis of fulfilling the 2010 AmericanCollege of Rheumatology/European League AgainstRheumatism classification criteria. None of the FDRsor HCs demonstrated clinical evidence of synovitis, asdetermined by a rheumatologist (HEG).
Anaparti et al. Arthritis Research & Therapy (2017) 19:249Page 3 of 11Table 1 Clinical characteristics of the study populationHealthy control subjects (n 12)ACPA /patients with RA (n 18)Age, years, median (range)40 (23–66)46.6 (29–70)ACPA /FDRs (n 12)33.65 (28–60)Sex, female/male10/214/412/1Disease duration, years, median (range)NA12.02 (0–35.6)NACRP titer, median (range)3.35 (1.07 –9.25)6.91 (2–42.6)2.595 (1.01–15.9)RF titer, IU/ml, median (range)ml 20321 (20–1540)34.9 (20–570)Anti-CCP titer, median (range)1 (0.4–2.0)201 (19–289)114 (7–365)BMI, kg/m2, median (range)29.54 (19.9–34.4)27.37 (20.4–39.6)26.09 (19.6–40.7)Abbreviations: ACPA Anticitrullinated protein antibodies, BMI Body mass index, Anti-CCP Anticyclic citrullinated protein antibodies, CRP C-reactive protein,FDR First-degree relative, RA Rheumatoid arthritis, RF Rheumatoid factor, NA Not applicableAll values are reported as median (range) unless otherwise indicatedSample collectionVenous blood was collected into PAXgene Blood RNAtubes (PreAnalytiX, Hombrechtikon, Switzerland), processed as per the manufacturer’s instructions, and used toisolate total RNA. PBMCs were isolated using SepMate -50tubes (STEMCELL Technologies, Vancouver, BC, Canada)as per the manufacturer’s protocol. Briefly, venousblood was drawn into ethylenediaminetetraacetic acidcoated tubes and diluted 1:1 with incomplete GibcoRPMI medium (Life Technologies, Carlsbad, CA, USA),layered onto SepMate -50 tubes with Histopaque Plus(Sigma-Aldrich, St. Louis, MO, USA), and centrifugedat 1000 g for 10 minutes at room temperature. Buffycoat was separated, and cells were washed in RPMI1640 medium prior to RNA isolation.ImmunoassaysSerum C-reactive protein (CRP) levels were monitoredin serum by using a human high-sensitivity C-reactiveprotein (hs-CRP) enzyme-linked immunosorbent assaykit (Biomatik, Cambridge, ON, Canada) as per the manufacturer’s instructions. The concentration of ACPA wasmonitored in serum using the BioPlex 2200 anticycliccitrullinated protein antibodies reagent kit (Bio-Rad Laboratories, Hercules, CA, USA).Total RNA extraction and qRT-PCRTotal RNA was isolated from whole blood and PBMCsusing the Ambion mirVANA miRNA isolation kit (catalogue number AM1561; Life Technologies, Carlsbad,CA, USA) as per the manufacturer’s instructions. RNAquality was determined using Bioanalyzer with the RNA6000 Nano Kit (Agilent Technologies, Santa Clara, CA,USA). Total RNA with absorbance at 260 and 280 nm 2.0and RNA integrity number 7.0 was used for monitoringmiRNA expression using a two-step qRT-PCR protocol aspreviously described [15]. Briefly, we used the AppliedBiosystems TaqMan MicroRNA Reverse TranscriptionKit (Life Technologies) with miRNA-specific stem-loopprimers for reverse transcription (Additional file 1:Table S1). Specific amplification of miRNA targets wasperformed using TaqMan Universal Master Mix II andtarget-specific TaqMan MicroRNA Assay Mix in theABI PRISM 7300 Real-Time PCR System (all from LifeTechnologies). For mRNA amplification, first-strandcomplementary DNA was synthesized from total RNA(1 μg) using SuperScript VILOTM MasterMix (LifeTechnologies) as per the manufacturer’s instructions.Target mRNA was amplified using Applied Biosystems Power SYBR Green Master Mix (Life Technologies) as perthe manufacturer’s instructions. Primers used for mRNAamplification of miR-103a-3p are listed in Additional file 1:Table S2.Data analysis and statisticsCandidate endogenous control miRNAs for datanormalization were selected on the basis of prior literature (RNU48, RNU44, U6 snRNA, RNU6B, and miR-16).Expression of these selected miRNAs was assessed forstable expression across samples in whole blood andPBMCs obtained from HCs, patients with RA, andFDRs. RefFinder, a web-based comprehensive gene analysis platform that integrates geNorm, NormFinder, BestKeeper, and comparative cycle threshold (ΔCt) methods,was used to identify the miRNA candidates suitable asendogenous controls for data normalization. On thebasis of this approach, RNU48 and RNU6B were identified as optimum reference miRNAs for normalizationacross all samples in this study [16]. Reference Ct valuesfor data normalization were determined by calculatingthe average Ct value of RNU48 and RNU6B [referenceCt mean (Ct {RNU48} Ct (RNU6B)] and used for eachsample. Raw Ct values for each target miRNA were thennormalized with reference Ct values to obtain ΔCt valuesfor each sample [ΔCt (target miRNA) Ct (target) reference Ct]. ΔCt values of each miRNA were further corrected using a global mean normalization strategy toobtain normalized ΔCt values [normalized ΔCt ΔCt(target miRNA) mean ΔCt] for all assessed miRNAs[17–19]. Relative fold changes were calculated using the
Anaparti et al. Arthritis Research & Therapy (2017) 19:249Page 4 of 11ΔΔCt method [20]. Of the 35 miRNAs analyzed, 33showed detectable expression (Ct 35) (Table 2) andwere considered for further analyses. Target mRNA expression was determined in samples after normalizationusing 18S ribosomal RNA as an endogenous control[20], and relative fold changes were calculated using theΔΔCt method.GraphPad Prism version 5.0 was used for miRNA analysis and generating volcano plots, scatterplots, and bargraphs. Empirical cumulative distribution plots (basedon the Kolmogorov-Smirnov [KS] test) and ROC curveswere generated using MS Excel (Microsoft, Redmond,WA, USA) and Prism (GraphPad Prism, La Jolla, CA,USA) software, respectively. The KS test is a nonparametricTable 2 Fold change expression of microRNAsmiRNARA vs HCFDR vs HCP ValueFold DR vs RARankP ValueFold change3.9610.0238P ValueFold 980.3627 1.250.8636 1.550.0754 101.8850.00241.370.2530 0.49811.08hsa-miR-19a0.07321.7370.02051.550.9662 1.11hsa-Let-7a0.05691.7370.20861.170.2358 1.47hsa-miR-19b0.02601.6790.11691.340.4091 .01201.52120.01621.300.9157 5hsa-miR-2220.07961.29140.21541.200.4587 1.07hsa-miR-1070.05761.28150.2481 1.020.4587 1.31hsa-miR-29c0.24281.28160.14571.110.8159 1.15hsa-Let-7e0.05021.27170.5837 1.200.0987 1.53hsa-miR-210.02611.24180.09241.220.7832 1.16hsa-miR-2230.01151.22190.54871.030.5115 1.82hsa-miR-26b-5p0.11911.21200.6744 1.450.0277 1.76hsa-miR-323-3p0.11231.17210.20331.120.9831 -miR-29a0.10311.14230.6174 1.290.11241.46hsa-miR-15a0.55941.11240.8292 1.560.1223 iR-34a*0.10651.06260.0495 1.840.0262 1.94hsa-miR-2210.18421.06270.9914 1.370.2356 1.45hsa-miR-240.2956 1.05280.86511.030.98311.04hsa-miR-18a0.7615 1.07290.7639 1.850.1124 1.72U60.8069 1.11300.0001 1.590.0625 1.43hsa-miR-125a-3p0.1654 1.20310.6178 1.100.48471.10hsa-miR-160.9950 3.94320.8276 1.240.2802 1.23hsa-miR-3460.0001 8.70330.0001 20.000.0338 2.32Abbreviations: FDR First-degree relative, HC Healthy control subjects, miRNA or miR MicroRNA, RA Rheumatoid arthritismiRNA profiling was analyzed in the whole blood total RNA samples obtained from HC, patients with RA, and FDRs using TaqMan probes. P values were obtainedusing the Mann-Whitney U test, and median fold change values were used to classify miRNAs rankwise. Columns highlighted in bold represent miRNAs that showsignificant differential expression after Benjamini-Hochberg correction for multiple comparison analyses (Q 0.04). RA vs HC indicates miRNA expression in patients withRA compared with HCs. FDR vs HC indicates miRNA expression in FDRs compared with HCs. FDR vs RA indicates miRNA expression in FDRs compared with patients withRA. hsa-miR-34a* represents hsa-miR-34a-3p
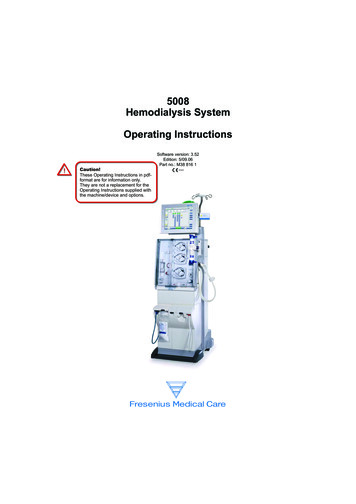
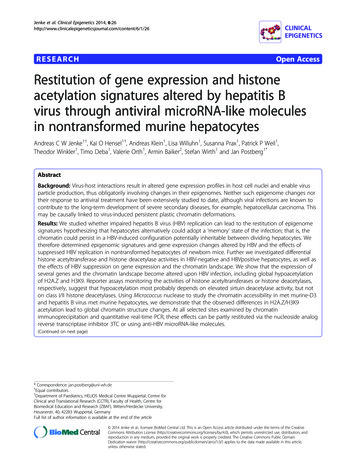
Anaparti et al. Arthritis Research & Therapy (2017) 19:249statistical method that does not assume normal distribution[21]. Differences between the datasets were represented asKS scores (in the range of 1 and 1) corresponding to maximum degree of separation between the cumulative distributions of the datasets being compared and directlyproportional to relative expression levels. KS scores 0.5were considered significant. Heat maps were generated withunsupervised hierarchical clustering using the TIGR multiple experiment viewer. Ingenuity Pathway Analysis ([IPA]www.ingenuity.com; QIAGEN Bioinformatics, RedwoodCity, CA, USA) was used for biomolecular network analyses and to predict mRNAs targeted by the differentiallyexpressed miRNAs identified in this study. The MannWhitney U test, the Kruskal-Wallis test with Dunn’s posthoc method, or Spearman’s rank correlation coefficientanalysis was used for statistical analysis as required,and P values 0.05 were considered significant. Differentially expressed miRNAs were determined afteradjusting P values with Benjamini-Hochberg correctionfor multiple comparisons [22].ResultsStudy populationParticipants were age-matched, ethnically homogeneousindividuals, and approximately 80% of them were women(Table 1). As expected, patients with RA demonstratedhigher hs-CRP levels (mean SD 10.05 10.02 μg/ml)than HCs (mean SD 4.03 2.31 μg/ml) and FDR(mean SD 4.18 3.09 μg/ml). Patients with RA in thestudy were on disease-modifying antirheumatic drugsand had an established disease profile that was eitherinactive or moderately active, as indicated by their Disease Activity Score in 28 joints (Table 1 and Additionalfile 1: Table S3).aPage 5 of 11Whole blood miRNA expression profile was altered inpatients with RA and FDRsUsing targeted TaqMan miRNA assay probes (LifeTechnologies), we analyzed the expression of 33 selectedmiRNAs. The miRNAs were selected on the basis oftheir relevance to RA as described in the literature(Additional file 1: Table S1). Overall, our analysis indicated that RA and FDR groups exhibited uniquely similar miRNA expression patterns compared with HC inwhole blood samples (Table 2 and Fig. 1; Additional file1: Table S4), but there were notable differences betweenthese three groups. Whereas expression of 13 miRNAswas significantly different in patients with RA, 10 miRNAs were differentially expressed in FDRs, comparedwith HCs. Notably, the expression of miR-103a-3p wasincreased in both patients with RA ( 3.96-fold) andFDR ( 7.68-fold), whereas the expression of miR-346was decreased in both groups ( 8.7-fold and 20-fold,respectively). Finally, in comparing patients with RAwith FDRs, miR-34a*, miR-26b-5p, and miR-346 differedsignificantly in their expression levels.Unsupervised hierarchical clustering (Fig. 1a) of all33 detectable miRNAs in patients with RA and FDRswas performed to generate a tree clearly separatingmiRNAs into two major clusters. Volcano scatter plotsfurther demonstrated that miR-103a-3p and miR-346were the most upregulated (upper right corner of theplot) and downregulated (upper left corner of the plot),respectively (Fig. 1b). These findings suggested thatmiR-103a-3p was uniquely upregulated in both patientswith RA and their FDRs compared with HCs. On thisbasis, we undertook further analyses to examine theperformance of miR-103a-3p as a biomarker in thispopulation.b-5P-Value (Log10)-4miR-346miR-103a-3p-3-2P 0.05-101-4-2024Fold Change (Log2)Fig. 1 a Unsupervised hierarchical clustering generated using fold change expression values of microRNAs (miRNAs, miRs) analyzed in patientswith rheumatoid arthritis (RA) and first-degree relatives (FDRs) compared with healthy control subjects. Color scheme: Violet increased expression;cyan decreased expression; and white unchanged. b Volcano plot showing expression of 33 miRNAs in the whole blood of patients with RA (closedsquares) and FDRs (open triangles). The miRNAs that are significantly altered in both groups are located above the horizontal dashed line correspondingto P 0.05
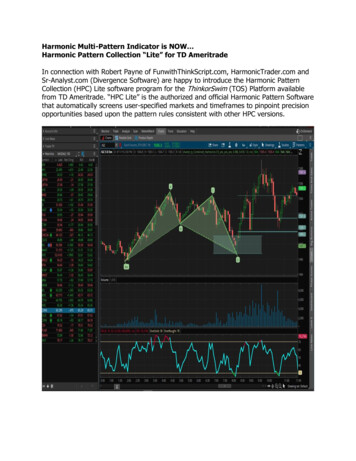
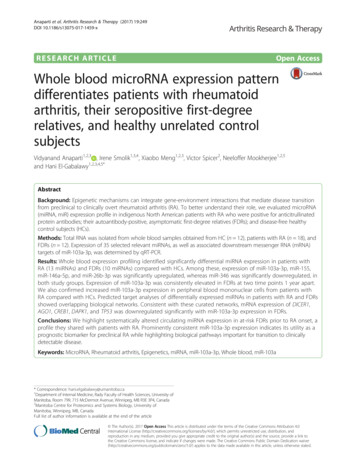
Anaparti et al. Arthritis Research & Therapy (2017) 19:249Page 6 of 11Performance of miR-103a-3p as a biomarkerEmpirical cumulative distribution plots, together withROC analysis, showed that miR-103a-3p can effectivelydistinguish between HCs, patients with RA, and FDRs(P 0.0001; 0.01% false discovery rate). The calculatedKS distance between HCs and patients with RA basedon miR-103a-3p expression was 0.59 (at ΔCt 22.29),whereas FDRs were separated by 0.75 (at ΔCt 21.32)from HCs and by 0.49 (at ΔCt 20.89) from patientswith RA (Fig. 2a). We determined the sensitivity andspecificity of miR-103a-3p expression using KS distanceas a cutoff point (Fig. 2b). At 95% CI, the AUC of theROC plot was 0. 8072 for ACPA-positive patients withRA (P 0.0001; 92% specificity and 67% sensitivity),whereas FDRs showed AUCs of 0.9350 (P 0.0001; 92%specificity and 83% sensitivity) compared with HCs and0.7507 (P 0.001; 71% specificity and 78% sensitivity)compared with patients with RA. These analyses suggestthat elevated whole blood levels of miR-103a-3p mayserve as a robust biomarker in ACPA-positive individuals at risk for developing future RA.Elevated whole blood miR-103a-3p expression levels arestable feature in FDRsFDRs, as a group, showed a 7.6-fold increase in miR103a-3p expression compared with HCs and a 1.96-foldincrease compared with patients with RA (Fig. 3a). Wethen sought to determine whether the increased miR103a-3p expression levels were stable over time in specificindividuals. Whole blood was collected from six HCs andatwo FDRs at two independent time points ( 1 year apart),and miR-103a-3p expression was compared at the twotime points. These experiments demonstrated that at bothtime points, the expression of miR-103a-3p was higher inFDRs (as indicated by lower ΔCt values) compared withHCs (Fig. 3b). This suggests that there is sustained upregulation of miR-103a-3p in FDRs compared with HCs. Weobserved limited variability in miR-103a-3p expression related to time between sampling, sample acquisition, andsample storage (data not shown). The delineation of therelative contributions of various cellular subsets in wholeblood to the observed increase in miR-103a-3p requiresfurther experiments where individual cellular subsets arefractioned and tested.Pairwise miR-103a-3p target correlation analysis distinctlysegregates FDRsBiomolecular interaction between the differentiallyexpressed miRNAs (Table 2) with their respective annotated transcript targets was analyzed using the IPA bioinformatics tool. The biomolecular network revealedthat tumor protein 53 (TP53) and Argonaute 2 (AGO2)were the two major hubs within the network that wereproposed to regulate the expression of most of the differentially expressed miRNAs identified in this study(Additional file 1: Figure S1). The curated functionalpathways (log P value 2.0 by Fisher’s exact test; thresholdvalue 0.05) predicted to be regulated by the miRNAsidentified in this study included metabolic and physiological processes such as cellular growth, development,bFig. 2 a Kolmogorov-Smirnov (K-S) plots showing cumulative distribution of microRNA (miR) miR-103a-3p expression for healthy control subjects(HCs; open circles), patients with rheumatoid arthritis (RA; closed squares), and first-degree relatives (FDRs; open triangles). The distance betweentwo distribution plots is represented by double arrows. K-S distance 0.5 was considered significant. b ROC curves (representing 1-specificity vssensitivity values) for HCs, patients with RA, and FDRs, calculated using expression values of miR-103a-3p
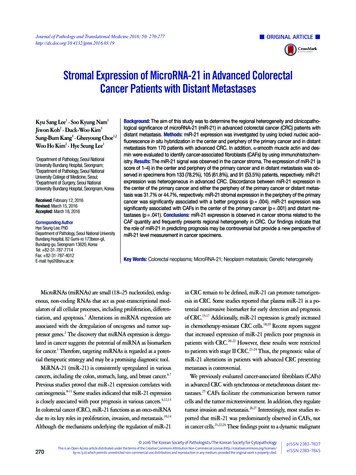
Anaparti et al. Arthritis Research & Therapy (2017) 19:249HCRA50FDRCtFC relativeto HC as 10-5***b5404303CtaPage 7 of 1120***21100-1 0*****ns0RAFDR-1T1T2Fig. 3 Expression of microRNA (miR) miR-103a-3p in whole blood or peripheral blood mononuclear cells obtained from healthy control subjects(HCs), patients with rheumatoid arthritis (RA), or first-degree relatives (FDRs). miR-103a-3p transcriptional abundance was analyzed by qPCR. aScatterplot of normalized cycle threshold (ΔCt) values and fold change of miR-103a-3p relative expression in whole blood of HCs (open circles),patients with RA (filled squares), and FDRs (open triangles). Error bars represent median values analyzed by Kruskal-Wallis test with Dunn’s testfor multiple comparisons (*** P 0.001 vs HCs). b Scatterplot of normalized ΔCt values showing miR-103a-3p expression in whole blood ofHCs (open circles) and FDRs (open triangles) collected at two independent time points 1 year apart (T1 and T2)proliferation, and cell death and are overrepresented inchronic diseases (Additional file 1: Table S5).Consistent with curated network analysis, availableliterature suggests that miR-103a-3p expression is regulated by TP53 and AGO2 [23–29]. Furthermore, miR103a-3p binds to 3′-UTRs of CCNE, CDK1, DICER1,AGO1, GPD1, ID2, CREB1, TIMP3, DAPK1, KLF4, andPTEN and regulates diverse physiological functions, including vascular inflammation, glucose metabolism, adipogenesis, endothelial cell activation, tumor metastasis,cellular apoptosis, and oxidative stress. Therefore, wemonitored the expression of all the above-mentionedmRNAs by qRT-PCR (Fig. 4 and Additional file 1: TableS6). Compared with HCs, whole blood expression ofArgonaute 1 (AGO1), cyclic AMP-responsive elementbinding protein 1 (CREB1), death-associated proteinkinase 1 (DAPK1), and TP53 was significantly downregulated in FDRs. DICER1 mRNA expression showeda similar trend, albeit statistically nonsignificant. Nosignificant change was observed in whole blood of patients with RA compared with HCs, except for AGO1.Additionally, Spearman’s correlation analysis withBenjamini-Hochberg correction for multiple comparisons (Additional file 1: Table S6) did not demonstrateany statistical significance between miR-103a-3p andany of its target mRNA expression levels. This suggeststhat regulation of miR-103a-3p and its targets is complex and warrants further investigation.DiscussionIn the present study, we examined the expression pattern of a wide spectrum of miRNAs in whole blood samples from a cohort of INA patients with RA, theirACPA-positive unaffected FDRs, and unaffected INAcontrol subjects with no clinical or serological evidenceof autoimmunity. We demonstrated distinct differencesFig. 4 Transcript abundance of microRNA (miR) miR-103a-3p targetmessenger RNAs (DICER1, AGO1, CREB1, TP53, and DAPK1) analyzedby qPCR using total RNA obtained from whole blood of healthycontrol subjects (HCs), patients with rheumatoid arthritis (RA) andfirst-degree relatives (FDRs). Scatterplots represent relative fold changeexpression values compared with HCs. Error bars represent medianvalues analyzed by Mann-Whitney U test. ***P 0.001, ** P 0.01,*P 0.05. ns Nonsignificant compared with HCs
Anaparti et al. Arthritis Research & Therapy (2017) 19:249between all three groups, and to our knowledge, we arethe first to demonstrate that miR-103a-3p is overexpressed in patients with RA and FDRs compared withHCs. Although aberrant miRNA expression patterns inthe peripheral blood of patients with RA has been widelyreported [13, 30], aberrant expression in ACPA-positiveunaffected individuals has not been reported previously.This study provides an impetus for evaluating the wholeblood miRNA profile, particularly miR-103a-3p expression, as a potential biomarker for predicting imminentdisease in individuals at risk for developing RA. It alsopoints to specific biological pathways that may be involved in the transition to clinically detectable disease.We elected to examine miRNA profiles using wholeblood samples collected in PAXgene RNA tubes for several reasons. First and foremost is the ease with whichthese samples are collected and stored, along with theremarkable resistance of the miRNA to endogenousribonuclease activity, as well as stability to extreme pH,temperature, and storage conditions [31, 32]. An alternative approach that is being widely investigated in aspectrum of chronic diseases is testing miRNA levels inserum or plasma [33, 34]. Although this latter cell-freeapproach has the advantage of potentially harnessinglarge archival serum/plasma sample repositories, itsuffers from limitations in providing a complete andunbiased miRNA profile of the circulating peripheralblood compartment of an individual. This relates tofactors such as preprocessing of samples, cellular contamination, and inconsistency in miRNA levels inserum vs plasma [35, 36].One major advantage of using whole blood to determine miRNA levels is that this approach retains the richcompositional architecture of the circulating blood, thusproviding the most unbiased representation of this space.Although this approach may be ideally suited for biomarker discovery, its primary disadvantage is the inabilityto define the cellular subsets that are contributing to theobserved miRNA profiles. Combined with the markedcellu
that play a role in posttranscriptional gene regulation. miRNAs bind to the 3′-untranslated region (3′-UTR) of target messenger RNA (mRNA) and induce gene silencing by either promoting mRNA degradation or transcript destabilization, resulting in suppression of target protein synthesis [9, 10]. In RA, proinflammatory cytokines (e.g.,