Transcription
FIVE-YEAR LICENSE RENEWAL:Blue Chip Casino, LLCDrew KlacikLaura LittlepageSeth PaytonCenter for Urban Policy and the EnvironmentIndiana University School of Public and Environmental AffairsIndiana University-Purdue University IndianapolisLarry DeBoerPurdue UniversityJuly 2002
Table of ContentsIntroduction .1Project Development and Gaming Activities .3Project Development Certificate Compliance .3Gaming Activity .4Impact of Gaming Activity on Tourism .4Figure 3: Average Distance Traveled by Regularity of Visits to Blue Chip.7Employment .9Employment Certificate Compliance.9Impact on Blue Chip’s Workforce .9Previous Employment Status .10Reasons for Leaving a Job to Accept Employment at Blue Chip .11Change in Annual Wages Upon Beginning at Blue Chip .12Reasons for Beginning Employment at Blue Chip .13Blue Chip Employment History .14Employee Training and Skill Building.17Economic and Fiscal Activity.19Compliance .20Tax Revenue .20Incentive Payments .21Fiscal Impact of Tax Revenues on Local Government.22Overall Impact on LaPorte County .23Fiscal Impact of New Employment .25Fiscal Impact on LaPorte County .26Fiscal Impact on Michigan City.27Fiscal Impact on Michigan City Area School Corporation .28Economic Benefits of Gaming-Related Taxes and Incentives .29Total Spending.29Total Benefits .30Economic Benefit by Type of Expenditure.31Jobs Created .33Wages Generated .34Other Issues.35Summary of Findings .36Appendix A: Methodology for Estimating Local Revenues and Costs.38City and County Revenue Estimates.39City and County Cost Estimates.40School Corporation Revenue Estimates .43School Corporation Cost Estimates.44
INTRODUCTIONThe Riverboat Gambling Act (Act), effective July 1, 1993, authorized the Indiana GamingCommission to issue licenses for the express purpose of riverboat gambling in the state of Indiana.Part of the statutory criteria for issuance of these licenses, in addition to being financially capable ofcompleting the project and passing an Indiana State Police investigation, is the applicant’s ability topromote tourism and economic development in the home dock area while best serving the interestof the citizens of Indiana. The Indiana Gaming Commission (Commission) contracted with theCenter for Urban Policy and the Environment (Center) of Indiana University’s School of Public andEnvironmental Affairs to perform economic impact, fiscal impact, financial, management, and otheranalyses required to assist the Commission in awarding the initial riverboat casino licenses.Additionally, the Commission requested the Center’s assistance in monitoring the economic impactsand fiscal returns from each riverboat operation.In partnership with the Commission, the Center has, since 1993, completed evaluations for thegranting of ten riverboat casino licenses. The Center also has completed annual performance reportsfor all operating riverboat casinos. In addition, the Center has provided other analyses for theCommission, as requested, and also served as the staff and conducted extensive research for theIndiana Gambling Impact Study Commission.The Center uses analytic and decision facilitation competencies to inform policy choices aboutcomplex societal, economic, and political problems, especially in Central Indiana. The Center isnonpartisan and non-ideological and works on a broad range of policy issues. Governments,nonprofit organizations, businesses, and foundations support projects at the center. Affiliated facultyfrom Indiana University–Purdue University Indianapolis and other universities, professional staff ofthe Center, and graduate assistants form project teams.On April 17, 1996, the Commission issued a Certificate of Suitability for a Riverboat Owner’s Licensefor a riverboat to be docked in Michigan City, Indiana. Blue Chip Casino, Inc. (Blue Chip) openedon August 22, 1997. Following its first year of operation, Blue Chip entered into negotiations withBoyd Gaming Corporation to purchase the company. The Commission approved the sale onNovember 8, 1999. The name of the licensee was changed to Blue Chip Casino, LLC. The Actspecifies that an owner's initial license expire five (5) years after the effective date of the license. Thisreport is an analysis of Blue Chip’s first five years of operation.The Certificate specified certain levels of project development and incentive payments to be madeby Blue Chip and specified that Blue Chip abide by agreements made with the city of Michigan City.Because this analysis must be completed before the completion of Blue Chip’s fifth year ofoperations, in year five, data are shown for year five through April 30, 2002. In addition to the fiveyear totals of components included in the previous annual reports, this report includes an analysis ofthe tourism impact of Blue Chip’s visitors, a study of the employment impact, a descriptive analysisof the economic impact of the additional revenue received, and an analysis of the fiscal impact onlocal communities. This five-year report is the eighth of ten analyses, one for each Indiana riverboat.The first, an analysis of Aztar, was completed in February 2001. The next three, Empress, Trump,1
and Majestic Star, were completed in July 2001. The fifth and sixth, Grand Victoria and Argosy,were completed in November 2001. The seventh report, Harrah’s, was completed in April 2002.Each additional report will allow an opportunity to refine the methodology, improve data collection,and compare and contrast riverboat performance and its impacts on local communities.2
PROJECT DEVELOPMENT AND GAMING ACTIVITIESThe 3,000-passenger (plus 500 crew) riverboat opened with 37,400 square feet of gaming space.The vessel has an 87,000 square-foot permanent pavilion. The pavilion has two restaurants, a snackbar, and a lounge with a bar. After breaking ground in 1998, the 217,000 square foot hotel (188rooms) attached to the pavilion opened on February 15, 2000.Gaming activity reflects the number of riverboat patrons and how much money they spent.Spending is defined as the amount bet, less winnings received.Project Development Certificate ComplianceIn the Certificate of Suitability (referred to throughout as Certificate), Blue Chip committed to spendapproximately 87 million on project development, in addition to pledging to Michigan City otherincentives totaling several million dollars. At the end of April 2002, Blue Chip reported that 152.8million has been spent on project development, 65.8 million more than agreed upon in theCertificate.Blue Chip has spent money locally for both capital and operating expenses as well as throughsponsorships and contributions. As Table 1 illustrates, since 1997, Blue Chip has spent 99.2 millionlocally. Additionally, Blue Chip has impacted the Michigan City area through 563,500 insponsorships and contributions to local area organizations. This excludes any contributions that werepart of the local development agreement, which are discussed under Incentive Payments.Table 1: Local Spending, Sponsorship, and ContributionsLocal SpendingSponsorships andContributions1997/981999 60,500,000 8,500,000 18,900,0002000 8,600,00020012002 thru 4/30 2,700,000 99,200,000Total 120,000 118,160 166,825 82,030 76,485 563,5003
Gaming ActivityThe Certificate did not require any specific levels of gaming activity by Blue Chip. As Table 2illustrates, Blue Chip has had attendance of over 16 million people since opening and adjusted grossgaming receipts of almost 719 million, for an average of 44 of casino win per patron per cruise.Table 2: Gaming ActivityCategoryAttendanceGross GamingReceipts Per Patron perCruise1997/982002 thru 6720013,992,2401,319,45016,223,195 127,168,000 161,710925 178,334,900 185,462,655 66,026580 718,703,060 36 44 47 46 50 44Impact of Gaming Activity on TourismOne argument for legalizing riverboats was that the projects would become a tourist destination andlocal businesses would benefit from the influx of visitors who would consume goods and services atlocal establishments as well as at the riverboat casino. It also was assumed that most of the casinovisitors would be tourist and not local residents.With the cooperation of Blue Chip, the Center conducted face-to-face interviews with riverboatpatrons over a four-day period in May 2002 in the riverboat pavilion. During the four-day period,the Center acquired a 234-patron sample.1 In general, the estimated average distance traveled tothe riverboat was 97 miles. Three percent of the interviewees were from Michigan City, 47.9percent were from the remainder of Indiana, and 49.1 percent were from outside Indiana (32.9percent were from Michigan).1While not a statistically significant sample, survey responses were consistent and provide informationnecessary to draw adequate conclusions.4
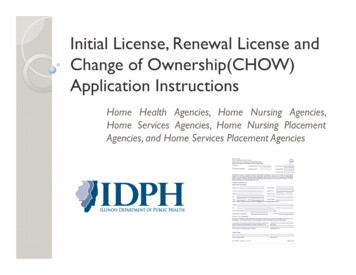
To suggest that riverboat casinos increase tourism in local areas is to presume that the riverboat willdraw people that would not have otherwise visited the area. To test that assumption, eachinterviewed patron was asked to provide his or her main reason for traveling to Michigan City.Figure 1 indicates that 89.3 percent of the patrons stated that their main reason for traveling toMichigan City was to visit Blue Chip Casino. The other most common primary purpose forinterviewees to visit Michigan City (3 percent) was to shop at the outlet mall. The remaining 7.7percent of interviewed patrons were visiting Michigan City for the primary purpose of visiting friendsor relatives, vacationing, conducting business, visiting the dunes, or fishing.Figure 1: Blue Chip Patrons’ Reasons for Visiting Michigan CityOther10.7%Riverboat89.3%5
The patrons also were asked how often they visit Blue Chip Casino. Specifically, each interviewedrespondent was asked to what degree he or she regularly visited the riverboat. Figure 2 illustrates theproportion of respondents by four broadly categorized groups: first time visitor, irregular visitor,somewhat regular visitor, and regular visitor. As shown, most of the patrons visited the riverboatirregularly (32.1 percent). The remaining two-thirds of interviewees were distributed among thethree remaining broad categories as follows: regular visitors (26.5 percent), somewhat regular visitors(23.1 percent), and first time visitors (18.4 percent).Figure 2: Regularity of Patron Visits to Blue ChipRegular26.5%Somewhat Regular23.1%First Time18.4%Irregular Visitor32.1%First Time Visitors Visiting Blue Chip for the first timeIrregular Visitors Visit Blue Chip less than once a year Visit Blue Chip one or two times a yearSomewhat Regular Visitors Visit Blue Chip every couple months Visit Blue Chip once a monthRegular Visitors Visit Blue Chip once a week Visit Blue Chip two to three times a week Visit Blue Chip every day6
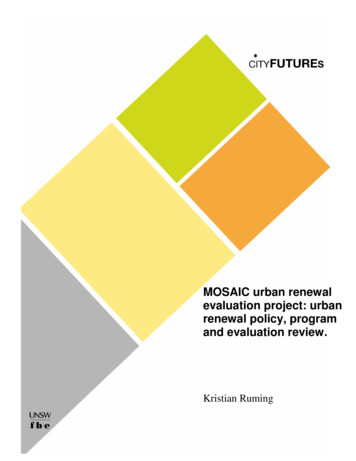
As mentioned previously, the overall average distance traveled was 97 miles. Figure 3 illustrates theaverage estimated distance traveled to visit the riverboat by the regularity of visits. As shown, theaverage distance traveled consistently decreased from 203 miles to 46 miles as regularity of visitsincreases. The patrons who visit the riverboat more frequently are more likely to live closer to theriverboat.Figure 3: Average Distance Traveled by Regularity of Visits to Blue irst TimeIrregularSomewhat regularRegularAs stated previously, 89.3 percent of the interviewed patrons were in Michigan City specifically tovisit the riverboat. In addition, each patron was asked how long he or she planned to stay inMichigan City during his or her visit. Table 3 indicates that 41 of the 234 patrons (18 percent) stayedin Michigan City more than 8 hours. Those patrons who stayed for more than one day were morelikely to have traveled farther distances to visit the riverboat.Table 3: Time Spent in Michigan City by Distance TraveledNumber ofPatrons8 Hours or Less9 to 24 Hours1 Day to 1 WeekTotal Sample1932219234Proportion ofRespondents82%9%8%100%Average MilesTraveled91113143977
Of the 234 interviewees, nine had visited or planned on visiting other Indiana riverboats on theirtrip. One of the patrons visited four other riverboats on his/her trip, six visited two other riverboats,and two planned on visiting one other riverboat. These visits to other Indiana riverboats included avisit to Empress, six visits to Trump, four visits to Majestic Star, five trips to Harrah’s, and two trips toHorseshoe.8
EMPLOYMENTEmployment Certificate ComplianceAs of April 30, 2002, 64 percent of Blue Chip’s employees were women and 20 percent wereminorities. Approximately 61 percent were from LaPorte County. Blue Chip committed to use itsbest efforts to employ a permanent work force that is demographically representative of LaPorteCounty and to fill 90 percent of the jobs with LaPorte County residents. According to 1997population estimates, in LaPorte County 12.6 percent of the population consists of minorities and48.9 percent of women. Blue Chip is more than meeting its commitment to hire women andminorities, but it lags behind in its commitment to hire LaPorte County residents.As Table 4 indicates, as of April 30, 2002, Blue Chip had employment of 1,149 persons in the hoteland casino, slightly below their five-year average of 1,153. Since opening, Blue Chip has paid almost 150 million in wages. Full- and part-time employees receive benefits that include health carecoverage and vacation time.Table 4: Employment and WagesCategoryEmploymentTotal Wages, Tips &Benefits1997/981999200020012002 thru 4/30Total/Average1,0801,1911,2021,1441,1491,153 30,064,562 32,802,110 36,526,900 38,021,950 12,158,960 149,5440482Impact on Blue Chip’s WorkforceIn testimony given to the Indiana Gambling Impact Study Commission in 1999, proponents of legalgaming asserted that gaming-related employment offers the chronically unemployed and underemployed an opportunity to establish a work record and skill set that may lead to even greatereconomic opportunity. Those who oppose legal gambling questioned the validity for this assertionand claimed that gambling-related jobs are often dead-end positions, plagued by high turnover rates.As part of the five-year analysis, current Blue Chip employees were asked to complete a survey oftheir past and current work history, including questions about the learning and skill-buildingopportunities presented to them. This analysis is based on 293 surveys received from 1,153 totalemployees at Blue Chip for a response rate of 25 percent.9
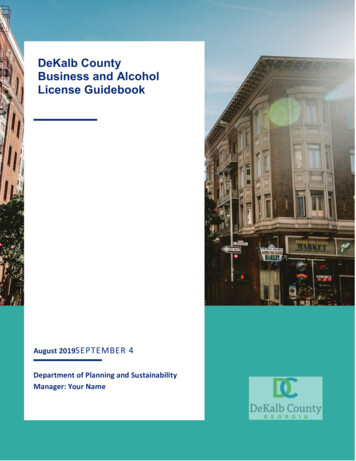
Previous Employment StatusAs shown in Figure 4, 31 percent of the current Blue Chip employees who responded to the surveywere unemployed prior to beginning work at the riverboat. Fifty-four percent had full-time jobs.The average annual wage of the 143 Blue Chip employees who were employed full-time prior tobeginning work and who reported a previous wage was 23,711.Figure 4: Employment Status Prior to Beginning Work at Blue ChipUnemployed9031%Full-time16054%Part-time4315%10
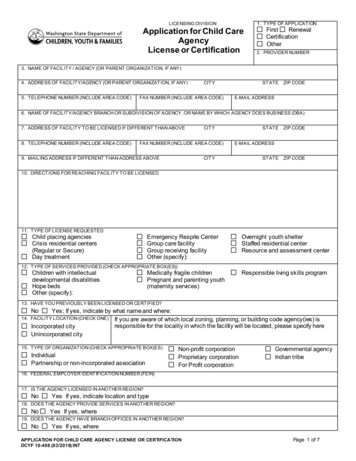
Reasons for Leaving a Job to Accept Employment at Blue ChipAs shown in Figure 5, for the 203 survey respondents who left full- or part-time positions andresponded to the question regarding their motivation to begin work at Blue Chip, the principalreason was more money (35 percent). Better advancement opportunities (15 percent) and improvedbenefits (10 percent) were the second and third most common reasons the previously employedpeople cited for beginning work at Blue Chip. The most common prior occupation of current BlueChip employees who left full- or part-time positions to begin work were either service sector jobs (21percent) or retail sector jobs (11 percent). Nine percent of the employees who responded to thisquestion were previously employed in the manufacturing sector of the economy.Figure 5: Why Previously Employed Accepted Job at Blue ChipOther8529%Close to Home228%Benefits2810%More Money10235%Better Hours83%Advancement4215%11
Change in Annual Wages Upon Beginning at Blue ChipOf the 293 respondents, 194 provided information that compared previous wages to starting wagesat Harrah’s. As shown in Figure 6, 56 percent of the respondents received a raise when starting atBlue Chip, with 40 employees reporting receiving beginning raises of more than 5,000 and 68reported receiving a raise of 5,000 or less. The median increase for employees reporting a wagefrom their previous employer and starting wage at Blue Chip was 1,000. The average increase foremployees reporting both previous and starting wages was 1,016.Figure 6: Change in Annual Wages from Previous Job to Starting at Blue Chip 5,001 4021% 1 - 5,0006835%Less than 06332% 02312%12
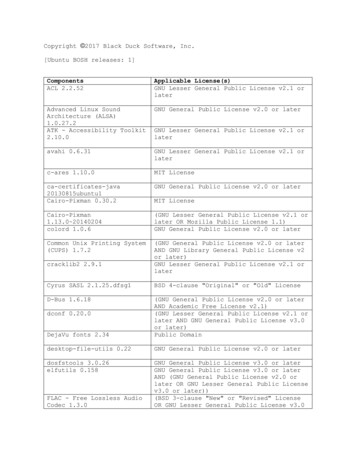
Reasons for Beginning Employment at Blue ChipAs shown in Figure 7, employees cited more money as the principal motivation for beginningemployment at Blue Chip twice as often as any other response. The next most common responsewas better advancement opportunities.Figure 7: Primary Reason for Beginning Employment at Blue Chip (All Respondents)120102100858060424028222080More MoneyBetter HoursAdvancementBenefitsClose to HomeOther13
Blue Chip Employment HistoryOf the 260 survey respondents reporting current and beginning wages at Blue Chip, Figure 8 showsthat 207 (nearly 80 percent) experienced an increase in wages over the period. Only 53, or 20percent, experienced a decline or no increase in annual wages since beginning employment at BlueChip. The average increase in wages for all employees reporting both current and beginning wageswas 5,960 over the period. The median increase was 3,140. Over the same period, per capitaincome in Indiana grew by 3,295. The 28 percent rate of increase for Blue Chip workers comparedwith the 15 percent increase for all Indiana workers shows that Blue Chip workers’ incomes aregrowing, on average, faster than wages for other workers in Indiana. An additional measure of theincreased well being of Blue Chip employees is the fact that 33 respondents report moving fromrental housing to home ownership.Figure 8: Change in Annual Wages Since Beginning Employment at Blue Chip120104103 1 - 5,000 5,001 1008060434020100Less than 0 014
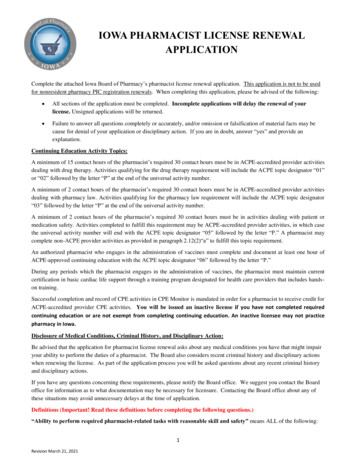
The average and median length of employment at Blue Chip by survey respondents was two yearsand ten months. As shown in Figure 9, 94 workers or 36 percent of all respondents have worked atBlue Chip for four or more years. Thirty percent of the respondents have worked at Blue Chip forless than two years.Figure 9: Years Worked at Blue Chip by Number of Respondents5 or more years9854 and less than 5 years3 and less than 4 years422 and less than 3 yearsMore than 1 less than 2Less than 1 Year46225515
Eighty-nine percent of Blue Chip employees who responded to a survey question regarding hoursworked per week are full-time employees working between 35 and 50 hours per week. As shown inFigure 10, only 32, or 11 percent, report working part-time or less than 35 hours per week. While itis possible that those working full-time were more likely to return their surveys, the vast majority ofrespondents employed by Blue Chip work on a full-time basis.Figure 10: Hours Worked per Week by Blue Chip Employees20More than 50140More than 40 to 509835-4032Less Than 3502040608010012014016016
Employee Training and Skill BuildingWhile the data on wages and employment show that Blue Chip employees are, for the most part,experiencing improved economic conditions, training and skill enhancements are key levers tocontinued growth and career opportunities. Figure 11 shows that 207 (71 percent) of therespondents reported riverboat job-related training, fewer Blue Chip employees are accessing skillbuilding opportunities beyond those directly related to their duties at the riverboat. In fact moreemployees paid for their own training (43 or 15 percent) than received skill-building opportunitiesthat were not directly related to their job and paid for by Blue Chip (32 or 11 percent).Figure 11: Training and Skill Building of Blue Chip Employees43General (Self)General (Blue Chip)Job-Specific32207Thirty-four percent of all respondents reported a high school degree as their highest level ofacademic achievement, and 43 percent reported some college as their highest level of academicachievement. Arguably, these two groups, based on educational experience and need, are mostpositioned to take advantage of additional skill- building opportunities. Five percent of the highschool graduates and 13 percent of those with some college reported receiving non-job-relatedgeneral education opportunities funded by Blue Chip. The two groups that received the highestshare of general training provided by Blue Chip were those with Masters degrees (33 percent) andundergraduate degrees (15 percent). While 18 percent of Blue Chip employees with some collegereported paying for additional skill-building opportunities, only four percent of those with only highschool degrees paid for additional skill-building opportunities on their own.With the information gathered from this survey, there is no way to determine if these results aredetermined by employee decisions, lack of availability to training, or other factors. Blue Chip Casinoreports that they have provided hundreds of hours of operations-related training for their employees.Operations-related training efforts range from new employee orientation and job specific instructionto management and supervisory skills. Blue Chip does not have a written policy regarding tuitionreimbursement and access to outside training opportunities. Blue Chip staff report that requests for17
this type of training are heard on a case-by-case basis and that Blue Chip has supported numerousoutside training opportunities.18
ECONOMIC AND FISCAL ACTIVITYSince opening in 1997, through April 30, 2002, Blue Chip has paid local governments over 68million in gaming-related taxes (admissions and wagering taxes) and has voluntarily contributed anadditional 15.2 million to Michigan City. Of the 68 million in gaming-related taxes, 52.2 millionwas distributed to the city of Michigan City, with the remaining 16.2 million distributed to LaPorteCounty. The analysis of the economic benefits of spending of local gaming-related taxes andincentives is limited to expenditures made by the city of Michigan City.In addition to gaming-related taxes, Blue Chip also generates traditional local tax revenues,principally property taxes on the boat and on other facilities. The presence of the casino and itspatrons creates additional costs for local government. For example, the boat and the accompanyingchange in traffic patterns and volume may require new infrastructure or more frequent maintenanceand increased traffic control costs. The influx of new visitors may require additional public safetyexpenditures. Riverboat casino employees may choose to relocate within the community and paynew taxes (principally property) and demand new infrastructure and services, including policeprotection and schools. The fiscal impact of Blue Chip is determined by comparing the additionaltax revenues attributable to the casino to the service and infrastructure costs. If added revenueexceeds cost, the fiscal impact is said to be positive. If the added revenues fall short of costs, thefiscal impact is negative.While there is much discussion and controversy regarding the economic benefits of the gamingindustry, little attention has been focused on the economic benefits generated by spending the localtax dollars generated from the gaming industry. The Indiana Gambling Impact Study Commissionfound that those who support legalized gaming claim economic benefits such as new jobs at thecasino, millions of dollars of private investment for gaming facilities, accompanied by spin-off benefitsgenerated by visitors to and suppliers of the facilities. Those who question the economic benefitsgenerated by the gaming industry claim that much of the spending is done by local residents andrepresents redirected rather than new dollars for the local economy. Opponents also claim thatprofits are exported to the corporate headquarters of the local casino and that there is no evidenceof new visitor spending beyond the gaming facility.This debate ignores the economic contributions made by spending the tax revenue generated bygaming facilities for local government. The manner in which local governments choose to investlocal gaming tax revenue has immediate and long-term impacts for the local economy. Animmediate benefit occurs when local tax dollars are spent and the effect works its way through thelocal economy. The long-term benefit is determined by how well this spending contributes to thelong-term economic competitiveness of the local economy.19
This chapter of the analysis discusses the following: Compliance: documents Blue Chip’s compliance with mandatory tax payments andvoluntary contributions Fiscal Impact: analyzes the new gaming-related costs and revenues generated by Blue Chipfor taxing units in Michigan City Economic Benefits: identifies the immediate economic benefits generated by Blue Chip’slocal gaming-related tax payments and voluntary contributionsComplianceTax RevenueThere are two sources of direct gaming revenue: the gaming tax, which is 20 percent of grossrevenues, and the admission tax, a total of 3 per admission. The city of Michigan City receives onequarter of the gaming tax and 1 per admission. The county also receives 1 per admission. Inaddition, another dollar is collected that is split several ways by the state. There are other revenuesthat are collected as a result of the gaming facility being located in the community—property taxes,sales taxes, and food and beverage taxes. There are at least two types of impacts that direct gamingrevenues have had on the local community. The first type of impact we examine is the overall fiscalimpact on local governments in Michigan City and LaPorte County, which is discussed in the FiscalImpact of Tax Revenues on Local Government section. The second type is the economic impactgenerated by additional spending. The impact of the additional spending is discussed in theEconomic Benefits of Gaming-Related Taxes and Incentives section.As Table 5 illustrates, Blue Chip has paid almost 127 million in direct taxes to the state of Indianasince it opened.Table 5: State Direct Taxes2CategoryGaming Tax (Stateshare)Admission Tax(Stat
Gaming Activity The Certificate did not require any specific levels of gaming activity by Blue Chip. As Table 2 illustrates, Blue Chip has had attendance of over 16 million people since opening and adjusted gross gaming receipts of almost 719 million, for an average of 44 of casino win per patron per cruise. Table 2: Gaming Activity