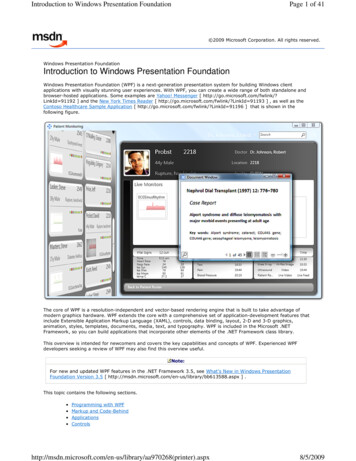
Transcription
Investor PresentationJun 2022
DisclaimerBy attending the presentation or by reading the presentationslides you agree to be bound as follows:This Presentation is prepared by One 97 CommunicationsLimited (“Company”) and is for information purposes only withoutregards to specific objectives, financial situations or needs of any-particular person and is not and nothing in it shall be construedas an invitation, offer, solicitation, recommendation oradvertisement in respect of the purchase or sale of any securitiesof the Company or any affiliates in any jurisdiction or as aninducement to enter into investment activity and no part of it shallform the basis of or be relied upon in connection with anycontract or commitment or investment decision whatsoever. ThisPresentation does not take into account, nor does it provide anytax, legal or investment advice or opinion regarding the specificinvestment objectives or financial situation of any person. Beforeacting on any information you should consider theappropriateness of the information having regard to thesematters, and in particular, you should seek independent financialadvice. This Presentation and its contents are confidential andproprietary to the Company and/or its affiliates and no part of it orits subject matter be used, reproduced, copied, distributed,shared, retransmitted, summarised or disseminated, directly orindirectly, to any other person or published in whole or in part forany purpose, in any manner whatsoever.The information contained in this Presentation is a generalbackground information of the Company and there is norepresentation that all information relating to the context hasbeen taken care of in the Presentation. We do not assumeresponsibility to publicly amend, modify or revise any informationcontained in this Presentation on the basis of any subsequentdevelopment, information or events, or otherwise. ThisPresentation includes certain statements that are, or may bedeemed to be, “forward-looking statements” and relate to theCompany and its financial position, business strategy, events andcourses of action.Forward-looking statements and financial projections are basedon the opinions and estimates of management at the date thestatements are made and are subject to a variety of risks anduncertainties and other factors that could cause actual events orresults to differ materially from those anticipated in the forwardlooking statements and financial projections. Representativeexamples of factors that could affect the accuracy of forwardlooking statements include (without limitation) the condition ofand changes in India’s political and economic status, governmentpolicies, applicable laws, international and domestic eventshaving a bearing on Company’s business, and such other factorsbeyond our control.Forward-looking statements and financial projections include,among other things, statements about: our expectationsregarding our transaction volumes, expenses, sales andoperations; our future merchant and consumer concentration; ouranticipated cash needs, our estimates regarding our capitalrequirements, our need for additional financing; our ability toanticipate the future needs of our merchants and consumers; ourplans for future products and enhancements of existing products;our future growth strategy and growth rate; our future intellectualproperty; and our anticipated trends and challenges in themarkets in which we operate. Forward-looking statements are notguarantees of future performance including those relating togeneral business plans and strategy, future outlook and growthprospects, and future developments in its businesses and itscompetitive and regulatory environment. These forward-lookingstatements represent only the Company’s current intentions,beliefs or expectations, and no representation, warranty orundertaking, express or implied, is made or assurance given thatsuch statements, views, projections or forecasts in thePresentation, if any, are correct or that any objectives specifiedherein will be achieved.We, or any of our affiliates, shareholders, directors, employees,or advisors, as such, make no representations or warranties,express or implied, as to, and do not accept any responsibility orliability with respect to, the fairness, accuracy, completeness orcorrectness of any information or opinions contained herein andaccept no liability whatsoever for any loss, howsoever, arisingfrom any use or reliance on this Presentation or its contents orotherwise arising in connection therewith. The informationcontained herein is subject to change without any obligation tonotify any person of such revisions or change and pastperformance is not indicative of future results.This document has not been and will not be reviewed orapproved by a regulatory authority in India or by any stockexchange in India. No rights or obligations of any nature arecreated or shall be deemed to be created by the contents of thisPresentation.Use of Operating MetricsThe operating metrics reported in this Presentation are calculatedusing internal Company data based on the activity of ourmerchants, consumers and other participants in our ecosystem.While these numbers are based on what we believe to bereasonable estimates of engagement, for the applicable period ofmeasurement, there are inherent challenges in measuring usageacross our large online, offline, in-store and mobile presence.The methodologies used to measure these metrics requiresignificant judgment and are also susceptible to algorithm orother technical errors. We regularly review our processes forcalculating these metrics, and from time to time we may discoverinaccuracies in our metrics or may make adjustments to improvetheir accuracy, which can result in adjustments to previouslydisclosed metrics. In addition, our metrics will differ fromestimates published by third parties due to differences inmethodology.
Paytm is India’s payments super app offering consumers andmerchants commerce & financial services75mnMonthlytransactingusers28mnWe have built two-sided ecosystem tocapture large revenue and profit pool inPayment and CreditMobile PaymentsLending 3,065 BnPaytmmerchants 1,600 Bn 925 Bn 608 BnFY 21FY 26FY 21FY 26Notes:1. Monthly Transacting Users and merchants as of May 20222. Redseer estimates for market size. Mobile Payments includes UPI and Wallet payments GMV, Lending includes retail and MSME loans disbursements3
Our Payment and Financial Services Business is scaling withbetter monetization and contribution marginPayments & Enabling CommerceDistribution of Financial ServicesQuarterly data and Y-o-Y growthConsumerPaymentsMerchantPaymentsCommerce & CloudServices 469Cr 572 Cr 320 Cr69%90%61% 168 CrTotal Revenues& Margin 1,541 Cr342%89%GMVValue of Loans disbursedNumber of LoansContribution profit 2.59 Lakh Cr 3,553 Cr6.5 Mn 539 Cr104%417%374%210%Contribution Margin – 35%As of quarter ending Mar’224
Payments Services to Consumers has 75 Mn Monthly Transacting Usersand 469 Cr Revenue in Q4 FY2022Consumer PaymentsWe earn feeswhen merchantMobile RechargeUtility Bills, Rent, EducationWallet Top-upcollectspayment onPaytm fromconsumerMost Comprehensive Payment options forusersWallet, UPI, BNPL, Cards and Net Banking5
Payment Services to Merchants: 572 CrCommerce & Cloud Services: 320 Cr(for Q4 FY2022)Revenue Model forCommerce and Cloudservices to MerchantsOmniChannelMerchantOnlineMerchantsMid & Large RetailersUses POS for Mobile & CardPaymentsNote:(a) Revenues fromPayment Services toMerchants (1)Subscription (2)MDRSmall Retailers upgrade to SoundBox for reconciliation & trust(b) Revenues fromCommerce & Cloud (3) Deals & giftvouchers, ticketing,advertising etc.Entry Level Merchant useFree Mobile QR for Payments3.Revenue Model forPayment services toMerchantsDeals & GiftVouchersTravel &EntertainmentTicketing2. MDRAdvertising& MarketingMerchants pay foraccepting Cards,EMI / BNPL payments1. SubscriptionMerchants pay for deviceusage, loyalty & othercloud solutions6
Our Payments & Commerce businesses creates foundation forFinancial Services offering to consumers & merchantsPaymentsServicesFinancial ServicesUsersUsersMerchantsLow CAC,High EngagementPayments Super App Brand Distribution Insights Technology Personal Loan & BNPL Co-branded Credit Card Merchant Loan Equity Broking Insurance DistributionCommerceServices7
Strong Traction in Loan Distribution BusinessPersonal LoansMerchant LoansNumber of Loans92,000 (948% Y-o-Y)38,000 (Value of Loans 805 Cr (1,082% Y-o-Y) 565 Cr (123% Y-o-Y)178% Y-o-Y)Postpaid (BNPL)6.4 Mn (373% Y-o-Y) 2,183 Cr (425% Y-o-Y)March ‘22 QuarterTicket Size 87,000 ( 1,170) 1,47,000 ( 1,950) 3,400 ( 45)Average Tenure 12 months 12 monthsMonthly productECL*4.5 to 5.0%5.0 to 5.5%1.1 to 1.3%Bounce Rate*11.5% to 12.5%NA11.0% to 13.0% 3,576 Cr and 5.5 Mn loans disbursed in Apr’22 – May’228*Indicative numbers based on our collection outsourcing arrangement
On track to achieve operating profitability by Sep 2023 quarterRevenue 3,022 CrContribution Margin (% revenue) 2,802 Cr 4,974 Cr( 240 Cr)64% 363 Cr 38%margin 1,498 CrEBITDA before ESOP (% revenue)( 2,468 Cr)( 1,655 Cr)30%13%(31%)(8%)FY 20FY 21FY 22Revenue growth driven by payments andlendingFY 20( 1,528 Cr)(59%) 51%marginFY 21FY 22(82%)FY 21FY 22Contribution Margin positive due to improvedpayments profitability and growth of highermargin productsFY 20Significant operating leverage in our fixedcostNotes:1. FY 20 excludes INR255 Cr Other Operating Revenue, which was a one-off item2. Contribution profit is a non-GAAP financial measure calculated as revenue from operations less payment processing charges, marketing and promotion charges, connectivity, content fees and logistics cost and contest,event and FASTag expenses9
On track to achieve operating profitability by Sep 2023 quarterRevenue 815 CrContribution Margin (% revenue) 891 Cr 1,086 Cr 1,456 Cr 1,541 Cr 174 Cr 245 Cr 261 Cr 454 Cr 14%margin89% 539 CrEBITDA before ESOP (% revenue)( 420 Cr)( 332 Cr)( 426 Cr)( 393 Cr)( 368 Cr)35%31%27%24%21%(27%)(37%)(39%) r EndingRevenue growth driven by payments andlendingMar-21Jun-21Sep-21Dec-21Mar-22Quarter EndingContribution Margin positive due to improvedpayments profitability and growth of highermargin productsMar-21Jun-21Sep-21(24%)Dec-21Mar-22Quarter EndingSignificant operating leverage in our fixedcostNotes:1. Contribution profit is a non-GAAP financial measure calculated as revenue from operations less payment processing charges, marketing and promotion charges, connectivity, content fees and logistics cost and contest,event and FASTag expenses10
F11
1.FY 20 excludes INR255 Cr Other Operating Revenue, which was a one-off item 2.Contribution profit is a non-GAAP financial measure calculated as revenue from operations less payment processing charges, marketing and promotion charges, connectivity, content fees and logistics cost and contest,