Transcription
Linking Data Collection,Stormwater Modeling, andCapital ImprovementsFSA 2018 Annual ConferenceFriday, June 15th 10:05 – 10:50 am
AuthorsRares Petrica,City of Fort LauderdaleLucia Medina,Hazen and SawyerStephanie Dunham,Collective Water Resources
City of Fort Lauderdale
Water, Water EverywhereRAINEverglades RegionalDrainage SystemSea LevelRiseGroundwaterTable
Stormwater Challengesand LimitationsExtreme rain event High groundwater table with verylittle available soil storage Low-lying residential streets Extreme weather such as king tidesand heavy precipitation Low and deteriorating seawalls Aging and/or absence ofstormwater infrastructure Lack of green spaceStorm SurgeSunny Day Flooding
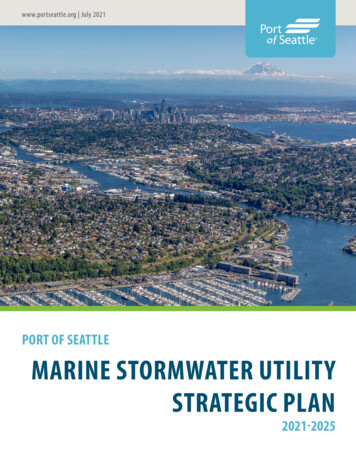
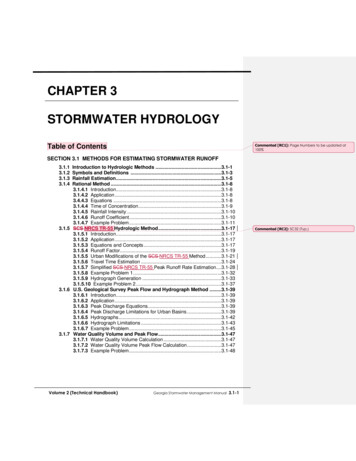
2015 Unified Sea Level Rise (SLR)Projection for SE FL 3” SLR since1992Possible61”Likely 2030: 6-10” SLR 2060: 14-26”31” “Possible”orange line forlong termprojects with lowrisk tolerance(2060: 34”)
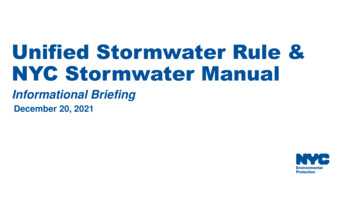
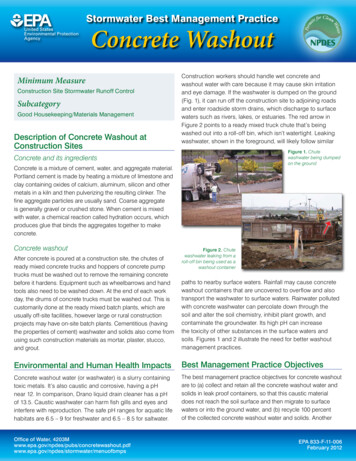
City of FortLauderdaleLand ElevationMap* Red represents areasbelow 5 feet elevation.* Quick glance at longterm vulnerabilities
Sea Level Rise Impacts: Tidal lResidential/Community
Drainage Under Average Tidal ConditionsStorm drainRoadStorm drainYardSeaWallSaltwater
Drainage Challenge with Sea Level RiseStorm drainYardRoadStorm drain SeaWallSaltwater
YardRoadStorm drainYardSeaWallHigh tide Tidal ValveTidal ValveYardRoadStorm drainLow tide RoadStorm drainSeaWall SeaWallStorm drainHigh Tide saltwater
2011 Halloween StormRainfall during an extremehightide caused coastal flooding.FreshwaterStormwater cannot drainYardRoadStorm drainSeaWallPumpHigh Tide
Stormwater UtilityStormwater Master Plan (FY 2014- FY2024) Phase I - (FY 2014 –FY2019) 37 CIP Projects Phase II – (FY 2015 –FY 2018) Modeling & Design of 7Neighborhoods Phase III – (FY2017 – FY 2024) Construction of Phase IIprojects and adoption ofhigher level of services
Testing New and Emerging TechnologiesBIOSWALESPERVIOUSPAVERS &PAVEDRAIN RECHARGEDRAINAGE WELLSEAWALL REPAIRS& UPGRADESEXFILTRATIONTRENCHSTORMWATERPRESERVESTIDAL CONTROLVALVESPUMPING STATIONS
Retrofitting to Reduce Tidal Flooding147 Tidal Valves InstalledThrough April 2018Cost12” Valve - 3,400Installation cost - 2,700Basin Retrofit - 1,500 to 20,000Annual Maintenance - 500 to 1,000
Tidal Valve Improvements: DelmarKing TideSeptember 28, 2015New Tidal ValveKing TideSeptember 29, 2015
Tidal Valve Improvements: NE 11th CourtKing TideSeptember, 2015New Tidal ValveKing TideOctober, 2016
Improvements in RivieraIsles – Raised ElectricalPanels for PumpsTidal Flooding onFlamingo Drive 2015
Phase I ImprovementsLas Olas BlvdPink indicates Cityowned seawallsCity-installed bermreduces impacts oftidal flooding comingover the seawalls
Adopted Seawall OrdinanceULDR Section 47-19.3Required extensive Stakeholderengagement efforts Sets minimum and maximumseawall elevations (min. 3.90NAVD) Requires maintaining seawallsin good repair Requires owners to prevent tidalwaters entering their propertyfrom impacting others
Stormwater UtilityStormwater Master Plan Phase I - (FY 2014 –FY2019) 37 CIP Projects Phase II – (FY 2015 –FY 2018) Modeling & Design of 7Neighborhoods Phase III – (FY2017 – FY 2024) Construction of Phase II projects Modeling & Design of additionalneighborhoods Adoption of higher level ofservice
Project ElementsData CollectionModelingDesignPublic Outreach
DataCollection
We collected new aerial LiDARspecifically for Fort Lauderdale. High Density Flown in two directions Vertical elevations accurate to within 0.15 ft.
Additional stormwater asset data werecollected to aid model development.Attributes field surveyed for over5,000 stormwater features
Outside of the City, availabledata were leveraged. Environmental ResourcePermits from Broward Countyand SFWMD; State and County roadwayplans (from FDOT, BrowardCounty); The City of Oakland ParkStormwater Atlas; and The City of Pompano BeachStormwater Atlas.
Modeling
Integrated Surface and Groundwater ModelingICPR 1D:Basins, Nodes and LinksICPR 2DOverland RegionGroundwater Region
Topography 2016 LiDAR in City 2007 FDEM LiDAR outside Hydro-corrected withavailable bathymetric data
Primary watershedswere identified Cypress CreekICW NorthICW SouthMiddle RiverNorth Fork New RiverNew RiverProspect RechargeS 36S 37ASouth Fork New RiverProspectRechargeS 37ACypressCreekICW NorthS 36Middle RiverNFNRNew RiverICWSouthICW SouthSFNR
1D and 2D OverlandFlow Areas weredefined.
Overland Hydrologic and Hydraulic Parameterswere developed to a high level of detail within the city limits.
2D Overland Parameterizationutilized extensive array of feature types.ExtrusionsBreaklines & BreakpointsPond & Channel ControlVolumes
1D Interface Nodesconnect 1D model elements to 2D elements.1D Interface Nodeswith overflow weirsconnect 1D basinoverland flow with2D overland flow1D Interface Nodesconnect 2Doverland flow with1D pipes
Groundwater Regionswere established forcomputationalefficiencies.
Hydrogeologic Parametersdefined from multiple sources. Unsaturated: Green-Amptparameters established fromNRCS SSURGO data Saturated: USGS/BrowardCounty 2016 SEAWATSaltwater Intrusion model
ConductivityModel Layers within SEAWAT model (USGS, 2016)PorosityAverage: Porosity, ConductivityBottom of SurficialAquiferBottom ofSurficial Aquifer
Wet Season Water Table established by Broward County
Groundwater Features developed to improve the surfaceand groundwater interaction.Groundwater RegionsBoundary Stage LineBreaklineDrain Line
Overland and Groundwater meshes allow for complexcomputational network.Overland Basins and HoneycombGroundwater Honeycomb
A suite of storm events, time horizons, and sealevel rise conditions were modeled.Storm Events5 Year 24 Hour10 Year 24 Hour25 Year 24 Hour25 Year 72 Hour100 Year 72 HourTimelineExisting20352060Sea Level Rise Projections
This required associatedboundary condition inputsto be generated.653214
Design
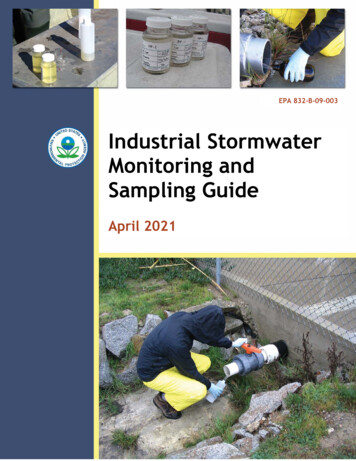
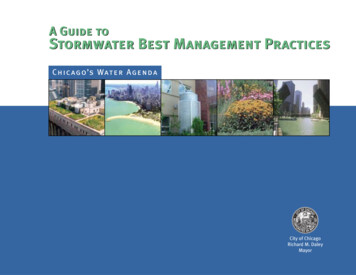
Design Team Assignments were madeto tackle the 7 neighborhoods.NeighborhoodWatershed(s)Design ConsultantDorsey RiverbendMiddle River, North Fork New RiverHDRDurrsNorth Fork New RiverCraven Thompson & AssociatesEdgewoodSouth Fork New RiverHazenProgressoNew RiverHDRRiver OaksSouth Fork New RiverCraven Thompson & AssociatesSoutheast IslesICW South, New RiverHazenVictoria ParkNew River, ICW SouthChen-Moore & Associates
The stormwater modelswere used to evaluateand inform design effortsin 7 initial neighborhoods.DurrsProgressoVictoria ParkDorsey RiverbendSoutheast IslesRiver OaksEdgewood
Each neighborhood has specific flooding vulnerabilities.Directly tidally influencedIndirectly tidallyinfluenced
Each neighborhood has specific flooding vulnerabilities.Primarily aged andundersized infrastructureVery low elevationssubject to tidal floodingand rainfall coincidentwith high tidesCertain underserved areasLimited stormwaterinfrastructure
Proposed investments in the 7 neighborhoodsexpected to range from 150- 200M in totalconstruction costs.ImprovementNew Storm SewerReplaced Storm SewerExfiltration TrenchNew/Restored SwaleDrainage WellsWater Quality StructuresPump StationsBackflow PreventersPermeable PavementCreated WetlandsSeawall ReplacementCanal/Creek Maintenance*Note: Based on March 6732,100UnitLFLFLFSY####SYACLFLF
Stormwater UtilityStormwater Master Plan Phase I - (FY 2014 –FY2019) 37 CIP Projects Phase II – (FY 2015 –FY 2018) Modeling & Design of 7Neighborhoods Phase III – (FY2017 – FY 2024) Construction of Phase II projects Modeling & Design of additionalneighborhoods Adoption of higher level ofservice
Thank you for your timeand attention.
3D Visualization3D visualization toolsincrease theunderstanding ofcomplex model dataand information.Provides a sense ofrealism.
63 [ ]UNIFIED SEA LEVEL RISE PROJECTION SOUTHEAST FLORIDA REGIONAL CLIMATE CHANGE COMPACT, 2015
64 [ ]TIDAL FLOW CONTROL REQUIREMENTS “Holding out the Tide” – requires public and private property modificationsHigh TideBackflowInstall Tidal ValvesSeawallBreachingTidal FlowControlRaise Seawalls
Revisit and Update Regulatory Permitting Criteria toIncorporate Climate Resilience The primary purpose for choosing a LOS criteria is to protectpublic safety/property and enhance quality of life Roads need to be passable for emergency and evacuation traffic A higher LOS will result in increased public safety, enhancedquality of life, and decreased property damage and land erosionPROPERTY LINE Existing LOS5-year 24-hour Storm 3 Inches25 yr El.100 yr El. 1’Recommended LOS10-year 24-hour StormDry Street25 yr El.100 yr El. 1’10 yr El.5 yr El.10 yr El.5 yr El.
Existing LOS Road CrownBased on the 5 Year 24 Hour Storm Event 7.5 inches of Rainfall The standard for the City’s current Ordinance 5 Year 24 Hour – probability of occurrence in a given year is 1 in every 5storm events Criteria has been used since the 1970s Insufficient for intense rainfall events over 7.5 inches of rain in a 24 hourtimeframe Existing neighborhoods in the City do not meet the existing LOS due to theabsence of stormwater infrastructure 3 inches over road crown 6 inches over edge of pavementduring rainy season 25 yr El.10 yr El.5 yr El.100 yr El.
Recommended LOS10 Year 24 Hour Storm Event 9 inches of Rainfall 10 Year 24 Hour – probability of occurrence in a given year is 1 in every10 storm events Adopted by many surrounding communities such as Pompano Beach andCoral Springs Higher and less flooded roads for emergency vehicles Sufficient for 5 Year 24 Hour storm events and variation in rainfall whichare occurring more oftenMostly Dry Streets 1 inch over road crownduring rainy season peak days10 yr El.5 yr El.25 yr El.100 yr El. 1’
Likely . Possible 3" SLR since 1992 2030: 6-10" SLR 2060: 14-26" "Possible" orange line for long term projects with low