Transcription
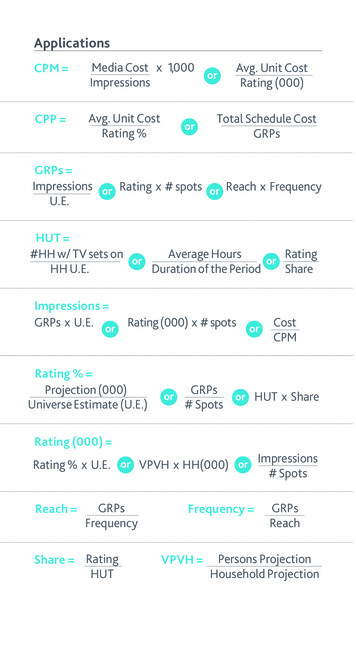
ApplicationsCPM Media Cost x 1,000orImpressionsCPP Avg. Unit CostRating %orAvg. Unit CostRating (000)Total Schedule CostGRPsGRPs Impressions or Rating x # spots or Reach x FrequencyU.E.HUT #HH w/ TV sets onAverage HoursRatingororHH U.E.Duration of the PeriodShareImpressions GRPs x U.E. or Rating (000) x # spotsRating % Projection (000)Universe Estimate (U.E.)ororCostCPMGRPsor HUT x Share# SpotsRating (000) ImpressionsRating % x U.E. or VPVH x HH(000) or# SpotsReach GRPsFrequencyShare RatingHUTFrequency VPVH GRPsReachPersons ProjectionHousehold Projection
Audience DerivationsTo DeriveComputationage 2–512–2418–2418–5418–64male teens25–3425–4925–6425 35–4935–54(2–11) minus (6–11)(teens) plus (18–24*)(18 ) minus [(25–54) plus (55 *)](18–24) plus (25–54)(18–34) plus (35–64)(total teens) minus (female teens)(18–34) minus (18–24*)(18–49) minus (18–24*)(25–54) plus (55–64*)(25–54) plus (55 *)(18–49) minus (18–34)(25–54) minus (25–34*) or(18 ) minus (18–34) minus (55 *)(18 ) minus (18–34)(25–54) minus (25–49*) or(18 ) minus (18–49) minus (55 *)(35–64) minus (35–49*)(18 ) minus (18–49)(35–64) minus (35–54*) or(55 ) minus (65 )(18 ) minus (18–24*) minus (25–54)(18 ) minus (18–64*)35 50–5450–6450 55–6455 65 *derivablewww.nielsen.comCopyright 2008 The Nielsen Company. All rights reserved.Nielsen and the Nielsen logo are trademarks orregistered trademarks of CZT/ACN Trademarks, L.L.C.
Pocket Guideto TV Terms
Audience Measurement andAbbreviations in Common UseAverage Audience Projection /Impression /(000) Theaudience expressed in numeric rather than percent format.Projection Rating x UniverseAverage Commercial Minute ratings show the AverageAudience to those minutes within a specific program thatcontain national commercial content.Average Hours of Viewing HUT/PUT converted to theaverage hours of viewing per home or per person. The twomeasurements are simply different ways to express thesame statistic.Avg. Hrs. Duration of the period x HUT %For example, the Mon–Sun 7-11pm duration is7 days x 4 hours or 28 hoursIf we assume a 70% HUT 28 hours x .70 19.6 hours/weekAverage Hours:Minutes would be:19 (.6 x 60 min) 19 hours, 36 minutesCoverage The percent of TV households that could receivea program. It’s the ability to view, not actual viewing.Coverage Area Rating % Average Audience in percentof homes able to receive an individual cable network orsyndicated program.Cable% Avg. Aud (000) Syndication% Avg Aud %Covg Area U.E.Pgm Covg %Gross Average Audience (GAA Rating) The sum of thepercent of households or persons tuning or viewing duringthe average minute of each telecast of the program,including repeat telecasts during the report interval.Note: Duplicated tuning and viewing to the same program(or its repeat telecast) by the same household, during thereport period is counted each time.Gross Impressions (IMP) The GRPs expressed in numericrather than percent format.Gross Rating Points (GRPs) The sum of all ratings for allprograms in a schedule.Nielsen Pocket Guide to TV Terms
PUT % # Persons viewing TVTotal Persons UniverseProjection Rating x UniverseRating % (Average Audience) The percent of the universeof households or persons tuned to a TV program during theaverage minute for national data and during the averagequarter hour for local market data.Share (of Audience) The percent of TV sets in use, orpersons tuned to a program.Station Count The number of stations carrying a program.Time-Shifted Viewing shows how viewers use Digital VideoRecorders (DVRs) or other time-shifting devices to recordand watch television programs on their own schedule.Nielsen currently releases national program ratings to thepress based on three standard streams of data, and localprogram ratings based on two streams as follows: National Time-Shifted Ratings for Programs and TimePeriods are reported on three time intervals:– Live, or programs that are watched at the timeof telecast.– Live Same Day, or programs watched at the time oftelecast as well as watched in DVR playback that takesplace during the same day until 3am of the followingmorning, at which time Nielsen’s meters transmit theday’s viewing data for processing.– Live 7 includes incremental viewing to programswatched at the time of telecast as well as watchedin DVR playback that occurs within 7 days of theoriginal telecast.Note: National clients are able to create additionalanalyses on other time-shifted intervals with custom tools. Local Time-Shifted ratings are reported based on twotime intervals:– Live, or programs that are watched at the timeof telecast.
– Live 7 (for metered samples) includes incrementalviewing to programs watched at the time of telecastas well as watched in DVR playback within 7 days ofthe original telecast.– Live 1 (for diary samples) includes incrementalviewing to programs watched at the time of telecastand within 1 day of the original telecast.Total U.S. Rating % Average Audience in percent of totalU.S. TV households.TV Usage Households Using Television (HUT) andPersons Using Television (PUT).Universe Estimate (U.E.) Total persons or homes in a givenpopulation, e.g., TV households in the U.S.Viewers Per Viewing Household (VPVH) The number ofviewing persons per tuning household. Usually reported as“per 1,000 viewing households”.Weighted Average Calculated by multiplying eachprogram’s rating by its duration, summing these productsand dividing the total by the sum of the duration.Schedule TermsAverage Frequency The average number of times ahome/person is exposed to programs or commercials.Cost Per Rating Point (CPP) The cost to deliver a singlerating point.Cost Per Thousand (CPM) The cost to deliver 1,000 peopleor homes.Frequency Distribution An array of reach according to thelevel of frequency delivered to each group.Reach The number of different homes/people exposed atleast once to a program or commercial across a statedperiod of time. Also called the cumulative (cume) orunduplicated audience.Copyright 2008 The Nielsen Company. All rights reserved.Nielsen and the Nielsen logo are trademarks orregistered trademarks of CZT/ACN Trademarks, L.L.C.
Coverage The percent of TV households that could receive a program. It's the abilityto view, not actual viewing. Coverage Area Rating % Average Audience in percent of homes able to receive an individual cable network or syndicated program. Cable% Avg. Aud (000) Syndication% Avg Aud % Covg Area U.E. Pgm Covg %