Transcription
J.P. MorganWorking CapitalIndex 2021Helping companiesbenchmark for success
Table of contents1. Introduction 2Calculation Methodology 22. Key Findings43. Post-pandemic Recovery Outlook Across Industries 11Oil and Gas upstream 13Apparel and Accessories 14Auto and Auto parts 15Semiconductor 164. Managing Liquidity Risks 175. Conclusion196. Summary of Findings 207. Authors 22
1 IntroductionThis edition of the Working Capital Index report captures the working capital trends of 2020— a year marked by the onset of the pandemic and the recovery outlook across industriesthat today continues to unfold and where its full impact on the global economy and businesslandscape will likely not be known until years from now.Despite vaccination programs being rolled out globally, many countries are still experiencingnew waves of infections, making it difficult to predict how much longer the pandemic will last,or when a full recovery will happen and how that might play out.For corporates, the key to growth during this period is the strategic shift from capitalpreservation to capital deployment, where efficient working capital management will play acritical role in sourcing for capital to fund business and expansion opportunities.Through insights derived from the analysis of working capital metrics, this report aims to helpfinance practitioners track the working capital trends and guide their initiatives to enhancetheir working capital management as they prepare for recovery in 2021.In this issue, we will: E xamine the performance of Working Capital Index, Cash Index and CashConversion Cycles (CCC) of the S&P 1500 companies in the past year P rovide industry insights and assess the impact of pandemic on working capital A nalyze the road to recovery and risks by industryCalculation MethodologyThere are three sets of data points analyzed in this report:I. T he Working Capital Index tracks the average net working capital/sales values across theS&P 1500 companies and is calculated as follows:II. T he Cash Index tracks the average cash/sales values across the S&P 1500 companies andis calculated as follows:WORKING CAPITAL INDEX 20212
We have established the base levels of 100 for both the Working Capital Index and the CashIndex, using 2011 as the base year.III. T he Cash Conversion Cycle (CCC) is the number of days it takes to convert inventorypurchases into cash flows from sales. The CCC is a metric that helps quantify the workingcapital efficiency of a company and is derived from three different components: D ays Sales Outstanding (DSO) or the number of days taken to collect cash fromcustomers D ays Inventory Outstanding (DIO) or the number of days the company holds itsinventory before selling it D ays Payable Outstanding (DPO) or the number of days from the time a companyprocures raw materials to payment to suppliers CCC DSO– DIODPOCompanies can improve their working capital by effectively managing the individualcomponents of their CCC via reducing inventory levels (decreasing DIO), extending paymentterms with suppliers (increasing DPO) and speeding up collections from customers (shorteningDSO). As a general rule, the lower the CCC, the better the working capital efficiency.Note:To avoid the distortion of data, financial services and real estate firms in the S&P 1500were excluded from the calculations due to their distinct business models and uniqueworking capital metrics in comparison to other industries. Companies with high volatilityin working capital and those with incomplete data were also removed, bringing the totalnumber of companies used for this analysis to over 900.All numbered data have been gathered from Capital IQ for the purpose of calculations.The trends extracted from our analysis were validated against insights from J.P. Morgan’sresearch team.WORKING CAPITAL INDEX 20213
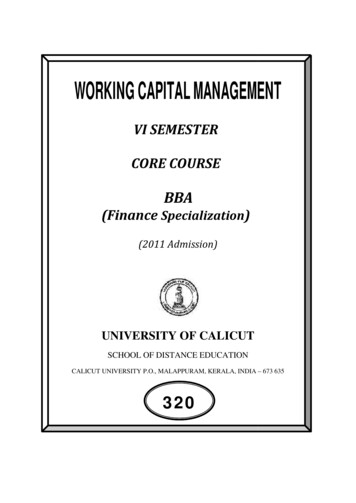
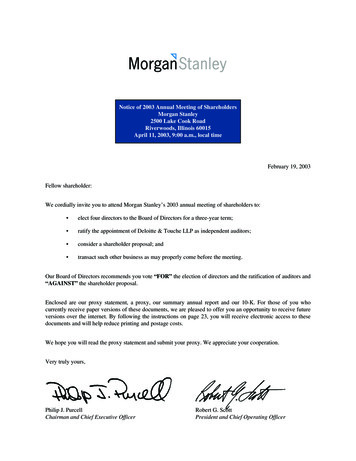
2 Key FindingsI. Working Capital Index rose to highest level in a 7107.1109.5106.6104.7102.6100.0U.S. Fed startsraising interest ratesSteep fall in oilpricesU.S.-China tradedisputeCOVID-19 20191H20202020Source: Capital IQIn 2020, the Working Capital Index rose to its highest level in 10 years, as the widespreadlockdowns that impacted supply chains as a result of the pandemic crisis, combined with thestalling of demand for products and services across multiple industries as the global economywent into recession, left corporates with high levels of excess inventories. The situationwas exacerbated as companies stocked up on inventories to mitigate further supply chaindisruptions.As business sentiment recovered towards the end of the year, sales in some industriesimproved and receivables levels subsequently rose, further contributing to the increase inworking capital levels.With the global economy expected to recover this year, working capital levels in 2021 will likelytrend lower as consumer confidence rebounds and demand for goods and services returns.Takeaway:Treasurers should continue to focus on enhancing their working capital management.Significant amounts of liquidity currently trapped in working capital if released in a timelymanner can provide the much-needed capital to fund future growth.WORKING CAPITAL INDEX 20214
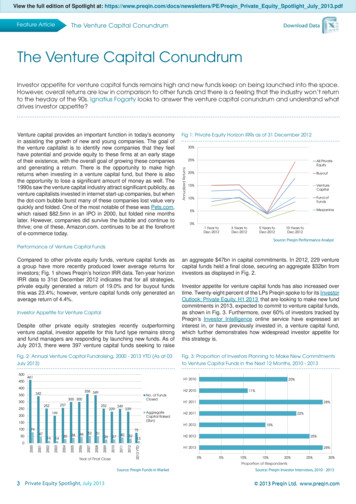
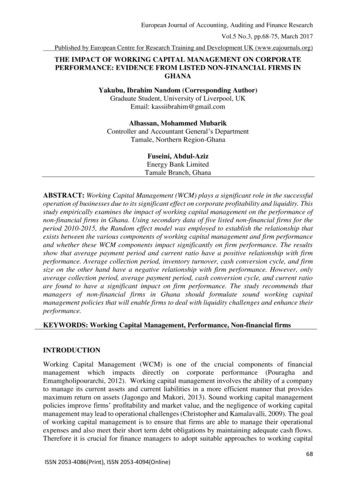
II. Cash index rose significantly on fortified liquidity buffers110US Fed startsraising .898.2U.S. tax reformsBrexit Referendum9594.8EurozoneCrisis8593.5Fears of a hardlanding in c91.6201720181H201920191H20202020Source: Capital IQThe Cash Index also rose in 2020 to levels not seen in seven years as corporates turned to fundraising initiatives and cash preservation measures to shore up their liquidity buffers amid thepandemic.Cash preservation initiatives employed included putting a pause on share repurchases,cutting back capital expenditure and reducing external spending. The record low interest rateenvironment coupled with the massive stimulus from the U.S. government further made iteasier for companies to boost their cash holdings,With a recovery taking shape in 2021, we expect corporates to start deploying the excess cashthrough capital investments, share buybacks, dividends payout, debt repayments or M&As,reducing their cash holdings.Takeaway:As corporates prepare for a recovery in their businesses, treasurers should revisit theircash management strategies and shift focus from cash preservation to cash deployment tosupport the business growth.WORKING CAPITAL INDEX 20215
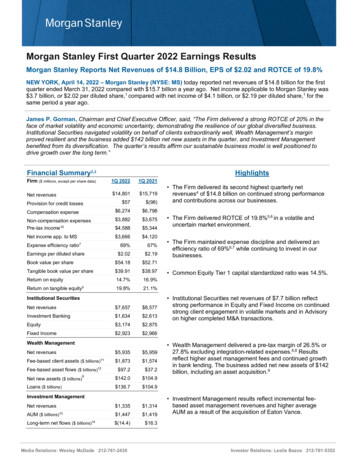
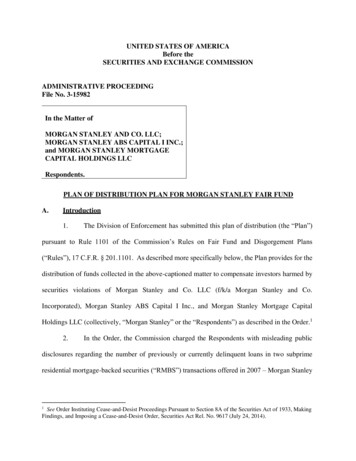
BigIII.companiesvs smallWideninggapcompaniesin cashsmall and big companieslevels betweenCash levelsCash-to-Sales ratio for big companies and small companiesLarge firms20.5%Small 15.9%14.8%201520162017201820192020Source: Capital IQSource: Capital IQNote: Historical rations restated according to 2020 S&P1500 constituentsNote:Historical ratios restated according to latest S&P 1500 constituents as of 2020.Values for big companies are derived by calculating the averages across the top 50percent of companies (by revenue) of every industry. For small companies, the valueis calculated using the averages of the bottom 50 percent of companies (by revenue)across each industry.The pandemic crisis posed unique challenges in the ability to procure funding, resulting ina widening gap in cash levels between small and big companies.Small companies generally maintain higher cash levels than their larger counterparts,as bigger companies tend to have more efficient cash management practices and betteraccess to external capital. During the pandemic, the propensity for lenders to providecapital to small companies relative to big companies reduced, prompting smallercompanies to beef up their cash buffers.For this reason, 2020 saw an increase of 4.7 percent in cash levels for small companiesvis-a-vis a 4.0 percent rise for their bigger counterparts.Takeaway:Corporates should assess and create cash management strategies best suited forthem, keeping the balance between managing the risks arising from the pandemiccrisis and supporting business growth as recovery takes shape.WORKING CAPITAL INDEX 20216
IV. Cash Conversion Cycle lengthened the most in nine yearsAverage working capital performance parameters across the S&P 1500 companies 2012–2020(in average number of days) 201220132014Source: Capital IQThe Cash Conversion Cycle (CCC) of the S&P 1500 companies lengthened by 6.3 days in 2020,representing the biggest increase in nine years, largely due to a rise in inventory levels.Weakened demand and supply chain disruptions resulted in the inventory buildup, promptingthe days inventory outstanding (DIO) to reach a new high where companies were carryinginventories for 6.1 more days on average.The days payable outstanding (DPO) and days sales outstanding (DSO) also showed sharpincreases last year as some companies extended payment terms with their suppliers,customers and leveraged solutions like supply chain finance to manage working capitalchallenges.Takeaway:The pandemic exposed the vulnerabilities of global supply chains, where companiesare now focused on reviewing their end-to-end supply chains. By understanding theinherent risks, they need to develop sustainable action plans to build resiliency in theirsupply chains that can withstand future shocks and mitigate any negative impact onworking capital. In addition, the increased interest from investors and corporates onthe importance of environmental, social and governance (ESG) will require treasury andfinance teams to focus on digitization and sustainable supply chain solutions.WORKING CAPITAL INDEX 20217
V. Majority of industries experienced deterioration of CCCChangesin Cash Conversion Cycle by sector (days) 2019-2020Changes in cash conversion cycle by sector (days) 2019 sUtilitiesConsumerStaplesMediaApparel uto &Auto parts(3.2)TechnologyHardware(0.2)Oil & Gasdownstream3.2IndustrialMachinery3.5Apparels 1Aerospace &DefenseChange inInventory8.6Oil & Gasupstream11.4Source: Capital IQSource: Capital IQIn terms of the CCC performance across sectors, 15 of the 19 industries saw deterioration, orlonger CCCs, due to accumulated inventories.Among the industries, the CCC of the oil & gas upstream lengthened the most as inventorypiled up as a result of reduced demand for oil. The CCC of the aerospace & defense sectoralso increased significantly amid cancellations of aircraft orders and a drop in demand foraviation parts.On the other hand, the semiconductor industry experienced the biggest improvement intheir CCC due to leaner inventories as a result of strong demand for data storage firms andpersonal computer manufacturers with the majority of the global workforce pivoting toremote work arrangements.Takeaway:The pandemic caused significant challenges in working capital management, wheresome treasurers resorted to tactical short-term measures like delaying their paymentsto suppliers. For the longer term, treasurers should reassess the levers driving theirCCC and devise a more sustainable strategy to manage working capital.WORKING CAPITAL INDEX 20218
VI. More than 500 billion estimated in potential working capitalThere remains significant amount of liquidity tied up in supply chains across the S&P 1500companies observed in the DSO, DIO and DPO metrics, as well as the cash levels within industries(see chart below).Snapshot of the average working capital performances between the top and bottom performersacross 19 industries in 2020 (in number of days)Source: Capital IQSnapshot of the average cash levels between top and bottom performers across 19 industries in2020 (in percentage of revenue)Source: Capital IQWORKING CAPITAL INDEX 20219
Assuming every organization improved its working capital and moved into the nextperformance quartile1 in their respective industries across the DSO, the DPO and the DIOmetrics, an estimated 507 billion in working capital could have been released as of yearend 2020, up from 497 billion in 2019.1 For every working capital parameter we have split the companies within each industry into four performancequartiles (with the first quartile representing the performance of the top 25 percent companies within theindustry and the fourth quartile corresponding to the bottom 25 percent). The free cash flow release calculationassumes that a company moves from its existing performance quartile to the next best performance quartile andquartile one companies remain at their current levelsTakeaway:The increase in trapped working capital implies a widening gap between the leadersand laggards in working capital management. Companies with less efficient workingcapital management should look at industry best practices and measure theirperformance on a continuous basis to identify and release some of this trapped capitalas they plan for recovery.WORKING CAPITAL INDEX 202110
3 Post-pandemic RecoveryOutlook Across IndustriesAs a result of the pandemic crisis, the global economy in 2020 suffered its worstdownturn since World War II, with widespread impact to the business landscapeworldwide. However, the extent of the impact varied significantly across industries withsectors like technology and healthcare flourishing and airlines and hospitality severelychallenged.Likewise, the speed of recovery across the industries in 2021 is also expected to beuneven, with growth in some sectors rebounding quickly while others likely to takeyears before returning to pre-pandemic levels.To quantify the recovery pace and the inherent risk (measured by debt levels) acrossindustries, we compared the percentage change in revenues of S&P 1500 companies in2019 (pre-pandemic) versus 2021 estimates1, against the extent of indebtedness (or netdebt to total capital levels) in 2020.The chart below categorizes findings into four zones: Z one 1: Quick recovery, low risk Z one 2: Quick recovery, medium risk Z one 3: Slow recovery, medium to high risk Z one 4: Slow recovery, very high riskCOVID-19 2021 OutlookMagnitude of riskLow risk45%High riskZone 1SemiconductorZone 2e-commerce25%PharmaHealthcareAuto & Auto partsTechnology SoftwareMediaAerospace & DefenseLogisticsTechnology Hardware5%Apparels & Accessories(5%)Industrial MachineryConstruction & EngineeringO&G downstreamTelecomRecovery Speed15%QuickConsumer StaplesChemicalsUtilitiesMaterialsApparel RetailEntertainment(15%)O&G upstreamSlow% change in Revenue 2019 vs 2021E35%(25%)(35%)Zone 3(45%)(20%)(10%)0%10%Zone 420%Airlines30%40%50%60%Net Debt/Total Capital 2020Source: Capital IQ2021 Revenue estimates as of March 25, 20211WORKING CAPITAL INDEX 202111
Industries that lie within Zone 1, such as e-commerce, semiconductor and technologysoftware, were either positively or minimally impacted by the pandemic. With low debtlevels, these industries are expected to experience revenue growth this year and willhave little need to preserve excess cash. They are likely to initiate aggressive cashdeployment towards expansionary measures like capital expenditure and M&A to drivegrowth in the next few years.Sectors in Zone 2 like media, auto & auto parts, and consumer staples will also likelysee business rebound this year but they have stretched balance sheet positions due tohigh net debt levels. Companies in this zone should be cautious with their growth plans,and focus on enhancing working capital and liquidity efficiencies to fund expansion frominternal sources without impacting their leverage positions.Industries within Zone 3 suffered a steep fall in revenues, but their relatively strongbalance sheets provide them room to take on further debt. As these industries couldexperience slower recovery this year, they may have to play a waiting game and continueto focus on building their liquidity reserves to fund growth when the opportunities arise.Sectors with Zone 4 – including airlines, oil & gas, and entertainment — were the hardesthit and recovery will take some time. With high leverage levels and having sufferedadverse impacts to cash flows and liquidity, these industries will find themselves onthe defensive with no room to stretch their balance sheets further. Cash deploymentwill be subdued and companies in this zone should maintain focus on preserving cash,enhancing liquidity management and generating working capital efficiencies.Key industry insightsTo illustrate the extent of pandemic impact on different industries, we examined foursectors representing the different zones: O il & Gas upstream A uto & Auto parts A pparel & Accessories S emiconductorThe analysis also breaks down the working capital parameters into four performancequartiles (with the first quartile representing the performance of the top 25 percentcompanies within the industry and the fourth quartile corresponding to the bottom 25percent) to enable finance practitioners to identify industry averages and benchmarktheir organizations’ working capital performances against peers.WORKING CAPITAL INDEX 202112
I. Oil and Gas upstreamRecovery speedRecovery speedDaysComparisonPayable OutstandingInventoryOutstandingCash ConversionCycleof working capitalDaysparameterswithinthe oil and gas upstreamsector 2011–2020(in average number of days)Days Sales 88.888.571.367.086.270.665.187.467.250.7104.1’11 ’12 ’13 ’14 ’15 ’16 ’17 ’18 ’19 850.542.220.617.646.313.714.686.8’11 ’12 ’13 ’14 ’15 ’16 ’17 ’18 ’19 ’20Source: Capital IQ21.160.551.628.537.2’11 ’12 ’13 ’14 ’15 ’16 ’17 ’18 ’19 ’20Days Sales OutstandingDays PayableOutstanding63.655.553.650.788.888.560.5 CycleCash Conversion51.637.2103.986.8’11 ’12 ’13 ’14 ’15 ’16 ’17 ’18 ’19 ’2022.921.1 17.628.514.913.714.6’11 ’12 ’13 ’14 ’15 ’16 ’17 ’18 ’19 ’20’11 ’12 ’13 ’14 ’15 ’16 ’17 ’18 ’19 ’2020.622.914.9’11 ’12 ’13 ’14 ’15 ’16 ’17 ’18 ’19 ’20Days Payable OutstandingDays Inventory OutstandingCash conversion cycleDays Inventory OutstandingCash conversioncycle2020 was a year of disruption for the oil and gas upstream sector with the CCC deteriorating112831125278by 40 days. The industry was already experiencing headwinds prior to the66pandemic as Recovery speeda result of the global trade tensions and oil price wars between global oil producers. Theonset of pandemic caused global demand to slump, driving down oil prices to levels not seen104since the aftermathofThe64oversupplyled to excess 61158141 September26 11 terrorist attacks in 2001.208487daysdaysdays CycleDaysSales Conversionoil inventorylevels, resultinga riseOutstandingof approximatelydays indaysDIO on averageCashfor theQuartile 1 (340-99)Quartile 2 (99-67)Quartile 1 (0-27)Quartile 2 (27-46)Quartile 1 (-206-(-9))Quartile 2 ((-9)-67)Quartile 1 (43-64)sector.Quartile 2 (64-73)upstreamQuartile 3 (67-40)Quartile 4 (40-25)Quartile 3 (46-77)Quartile 4 (77-283)Quartile 3 (67-112)Quartile 4 (112-481)8383103635463.6DaysInventory OutstandingDays Payable Outstanding55.553.645.7103.91412525387Quartile 3 artile 4 5Thein the ed53.625 companies3400 faced severe283-206481 .7(340-99)Quartile 2 (99-67)Quartile1 (0-27) by theirQuartile2(27-46)Quartile1(-206-(-9))Quartile2 Quartile3 (67-40) of70.6Quartile4in(40-25)Quartile3 (46-77)Quartile 4 (77-283)Quartile 3 (67-112)Quartile 4 667.067.2’1186.287.486.822.9Working capital parameters within the oil and gas upstream industry 2020 (in14.6average13.7number’12’13 ’14 ’15of’16days)’17 ’18 ’19 ’20’11 ’12 ’13 ’14 ’15 ’16 ’17 ’18 ’19 ’20’11 ’12 ’13 ’14 ’15 ’16 ’17 ’18 ’19 ’20 ’11 ’12 ’13 ’14 ’15Days Sales Outstanding83Days Payable Outstanding10363831235214184Quartile 1 (43-64)Quartile 3 (73-97)11254253Quartile 2 (64-73)Quartile 4 (97-253)25daysQuartile 1 (340-99)Quartile 3 (67-40)Cash conversion cycle782015864340Quartile 2 (99-67)Quartile 4 (40-25)0Quartile 1 (0-27)Quartile 3 (46-77)days112661042687days43Days Inventory Outstanding14.9’16 ’17 ’18 ’19 ’2061283Quartile 2 (27-46)Quartile 4 (77-283)-206daysQuartile 1 (-206-(-9))Quartile 3 (67-112)481Quartile 2 ((-9)-67)Quartile 4 (112-481)Source: Capital IQIn 2020, upstream companies took an average of 87 days to pay its suppliers while cashfrom sales was realized in 84 days. On average, companies maintained 64 days’ worth ofinventory.WORKING CAPITAL INDEX 202113
II. Apparel and AccessoriesRecovery speedRecovery speedDaysComparisonPayable OutstandingInventoryOutstandingCash Conversionof working capitalDaysparameterswithinthe apparel and accessoriessector Cycle2011–2020 (in average number of days)Days Sales Outstanding86.749.935.737.154.535.435.2 34.3121.8’11 ’12 ’13 ’14 ’15 ’16 ’17 ’18 ’19 ’2055.9107.6136.4131.5123.7131.7130.6121.8’11 ’12 ’13 ’14 ’15 ’16 ’17 ’18 ’19 ’20Source: Capital 07.6102.9’11 ’12 ’13 ’14 ’15 ’16 ’17 ’18 ’19 ’20’11 ’12 ’13 ’14 ’15 ’16 ’17 ’18 ’19 ’20’11 ’12 ’13 ’14 ’15 ’16 ’17 ’18 ’19 ’20DaysPayableOutstandingDays Inventory OutstandingCashcycleconversion cycleDaysInventoryOutstandingCash conversion8753117148193The87 apparel andoneof its most challengingyears in 123117 accessories industry experienced14819397recent memory as the widespread lockdowns due to pandemic kept stores shut anddisrupted supply ��11 ’12 ’13 ’14 ’15 ’16 ’17 ’18 ’19 ’20Days SalesOutstandingOutstandingDays Payable35130.654.547.3131.762.9 130.8122.5Cash Conversion ’11 ’12 ’13 ’14 ’15 ’16 ’17 ’18 ’19 ’20112.886.762.937.2Days Inventory Outstanding164.8116.0112.359.3 44.435.355.935.835.847.355.754.551.7Days Payable Outstanding577014612397238104Recovery speed70150While consumerstookplatforms for shopping,helping238146 to e-commerce10470 to reduce inventory1504487165123daysincrease of 28days nversionstill sawanPayableaveragedaysin DIOdaysfrom 2019 alsoledto an increasein theQuartileDSO1 (59-131)by 7 dayson2 (131-166)average.Quartile 1 ((-109)-92) Quartile 2 (92-115)Quartile1 (346-98)Quartile 2 (98-72)Quartile1 (0-27)2 288787Quartile 3 (42-62)346Quartile 3 (72-57)Quartile 4 (62-87)59165Quartile 4 (57-28)282Quartile 3 (166-207)-109Quartile 4 (207-282)309123Quartile 3 (115-147)Quartile 4 (147-309)122.5daysdaysdays86.744.4164.8 rose 116.0However,a largewasoffset282by increase in DPO thatby 30928346 part of the CCC increase59-109114.4112.8 113.5112.327137.1(346-98)days35.4on averagecompaniesdelayedtheirvendororQuartileused 1supplychain59.335.3QuartileQuartile2 as(98-72)Quartile1 (59-131)Quartile 2payments(131-166)((-109)-92)Quartile 2 109.4(92-115)35.755.754.5131.5 134.2 Quartile112.5130.551.7theirQuartilefinancing3 (72-57)Quartile37.24to(57-28)Quartile3 (166-207)Quartile 4 (207-282)3 (115-147)Quartile 4 (147-309)solutionsmanageliquidity35.849.962.9 needs.35.835.2 3 within the apparel and121.8Working capital parametersaccessories industry 2020 (in averagenumberofdays)’12 ’13 ’14 ’15 ’16 ’17 ’18 ’19 ’20’11 ’12 ’13 ’14 ’15 ’16 ’17 ’18 ’19 ’20’11 ’12 ’13 ’14 ’15 ’16 ’17 ’18 ’19 ’20 ’11 ’12 ’13 ’14 ’15Days Sales Outstanding35Days Payable Outstanding5318877014814644Quartile 1 (0-27)Quartile 3 (42-62)1175787Quartile 2 (27-42)Quartile 4 (62-87)28days238Quartile 1 (346-98)Quartile 3 (72-57)Quartile 2 (98-72)Quartile 4 (57-28)59daysQuartile 1 (59-131)Quartile 3 (166-207)1239770150165346’16 ’17 ’18 ’19 ’20Cash conversion cycle19310487days0Days Inventory Outstanding102.9123282Quartile 2 (131-166)Quartile 4 (207-282)-109daysQuartile 1 ((-109)-92)Quartile 3 (115-147)309Quartile 2 (92-115)Quartile 4 (147-309)Source: Capital IQIn 2020, companies within the apparel and accessories industry took an average of 44days for to turn sales into cash proceeds. The sector held 165 days’ worth of inventory,and payments to suppliers were generally made within an average of 87 days.WORKING CAPITAL INDEX 202114
III. Auto and Auto partsRecovery speedRecovery speedDaysComparisonPayable OutstandingInventoryOutstandingCash sectorConversionCycleof working capitalDaysparameterswithinthe auto and auto parts2011–2020(in average number of days)Days Sales 743.4’11 ’12 ’13 ’14 ’15 ’16 ’17 ’18 ’19 ’2050.150.237.4’11 ’12 ’13 ’14 ’15 ’16 ’17 ’18 ’19 ’2072.370.049.2Days Inventory 062.2’11 ’12 ’13 ’14 ’15 ’16 ’17 ’18 ’19 ’20Source: Capital .9’11 ’12 ’13 ’14 ’15 ’16 ’17 ’18 ’19 ’20Days SalesOutstandingOutstandingDays PayableCash Conversion 3.451.750.149.246.7Days Payable Outstanding58.7’11 ’12 ’13 ’14 ’15 ’16 ’17 ’18 ’19 ’20’11 ’12 ’13 ’14 ’15 ’16 ’17 ’18 ’19 ’20’11 ’12 ’13 ’14 ’15 ’16 ’17 ’18 ’19 ’20DaysPayableOutstandingDays Inventory OutstandingCashcycleconversion cycleDaysInventoryOutstandingCash conversionThe55 auto and autoparts industry was oneof the hardesthit sectors at the38onset of pandemic64805578as widespread factory closures, slumping car sales and massive layoffs led to supply and Recovery speeddemand shocks for both auto suppliers and automakers. Inventory levels rose significantly inthe first half of 2020 as demand 8564381290129066days of 2020 helped to reducedaysdaysA rebounddaysin demand in the second halfinventories from the highsDays Sales OutstandingDays Payable OutstandingDays Inventory OutstandingCash Conversion CycleofQuartilefirst1 (3-16)half 5)Quartile2(45-66)Quartile1((-14)-33)Quartile 2 (33-53)Quartile 2 (16-29)3514259Quartile 3 (29-62)249Quartile 3 (53-21)Quartile 4 (62-142)1185Quartile 4 (21-5)296Quartile 3 (66-84)-14Quartile 4 (84-296)23966 Quartile 3 (53-81)Quartile 4 (81-239)daysdaysdaysTheDPOrose byaverage of 7 days11as companiesnegotiated for temporaryextensions5249 an39.7296-14239 of58.785.266.133.6 with suppliers and service providers in response to the pandemic. The 4 daysterms32.5Quartilepayments1 45-66)Quartile1((-14)-33)Quartile2 935.555.1Quartileon3 averagerise in the DSO was reflectiveofthe increase in receivables in77.2the 5.155.055.0when demand for auto parts43.4 rebounded.44.252.862.249.9Working capital parameters within the auto and auto parts industry 2020 (in average number’11 ’12 ’13 ’14 ’15 ’16 ’17 ’18 ’19 ’20’11 ’12 ’13 ’14 ’15 ’16 ’17 ’18 ’19 ’20 ’11 ’12 ’13 ’14 ’15 ’16 ’17of days)’11 ’12 ’13 ’14 ’15 ’16 ’17 ’18 ’19 ’20Days Sales Outstanding42Days Payable Outstanding556122805510540Quartile 1 (3-16)Quartile 3 (29-62)8030142Quartile 2 (16-29)Quartile 4 (62-142)5daysQuartile 1 (249-70)Quartile 3 (53-21)Cash conversion cycle78129085249Quartile 2 (70-53)Quartile 4 (21-5)11Quartile 1 (11-45)Quartile 3 (66-84)days64381003359days3Days Inventory Outstanding’18 ’19 ’2066296Quartile 2 (45-66)Quartile 4 (84-296)-14daysQuartile 1 ((-14)-33)Quartile 3 (53-81)239Quartile 2 (33-53)Quartile 4 (81-239)Source: Capital IQAs of 2020, auto and auto parts companies took an average of 59 days to pay off supplierinvoices. They maintained an average of 85 days’ worth of inventory and took 40 days toconvert sales into cash proceeds.WORKING CAPITAL INDEX 202115
IV. SemiconductorRecovery speedRecovery speedDaysComparisonPayable OutstandingInventoryOutstandingof working capitalDaysparameterswithinthe semiconductorCashsectorConversion2011–2020 Cycle(in average number of days)48.745.9 Days Sales 98.099.8103.3’11 ’12 ’13 ’14 ’15 ’16 ’17 ’18 ’19 ’20106.5120.2106.5101.499.4’11 ’12 ’13 ’14 ’15 ’16 ’17 ’18 ’19 ’20CapitalIQDaysSource:PayableOutstandingDays Sales Outstanding4645.891.242.7’11 ’12 ’13 ’14 ’15 ’16 ’17 ’18 ’19 ’20’11 ’12 ’13 ’14 ’15 ’16 ’17 ’18 ’19 ’20103.342.7Cash s Inventory OutstandingDays Payable 106.0105.198.0131.6116.7120.9102.7’11 ’12 ’13 ’14 ’15 ’16 ’17 ’18 ’19 ’20’11 ’12 ’13 ’14 ’15 ’16 ’17 ’18 ’19 ’20’11 ’12 ’13 ’14 ’15 ’16 ’17 ’18 ’19 ’20Days Inventory OutstandingCash conversioncycleDays Inventory OutstandingCash conversion cycleDays Payable Outstanding46556855113113158158140105140105As majority of the global working population pivoted to remote work arrangements as aresult of movement restrictions and lockdowns, the sem
finance practitioners track the working capital trends and guide their initiatives to enhance their working capital management as they prepare for recovery in 2021. In this issue, we will: Examine the performance of Working Capital Index, Cash Index and Cash Conversion Cycles (CCC) of the S&P 1500 companies in the past year