Transcription
and Hines (1967), Broom and Lyford (1981), andLuckey (1985). Transmissivity ranges from 8,500 to50,000 ft2/d, and storage coefficient for the deeper,more confined part of the aquifer ranges from 1 x 10⁻⁴to 4 x 10⁻² (table 2). No values of aquifer hydrauliccharacteristics of alluvium at other locations in theMemphis area have been reported.Water from the alluvium is hard and has relatively high concentrations of iron, dissolved solids,and barium (Brahana and others, 1987, tables 2 and 3).Lenses of clay rich in organic matter and associatedgeomicrobial activity are thought to be the source ofhigh concentrations of hydrogen sulfide, carbon dioxide, and iron in this formation (Wells, 1933).Fluvial DepositsFluvial deposits occur at land surface in theuplands east of the bluffs (fig. 4). Although at one timethe fluvial deposits were an important source ofdomestic water, present pumpage from this formationis negligible. Since about 1950, when the city of Memphis expanded its municipal supplies to serve outlyingareas, few wells have been drilled into the fluvialdeposits. Many of the wells that existed in 1950 havenot remained operational and have been abandoned,plugged, or destroyed. Wells in the fluvial deposits arecapable of large yields, greater than 100 gal/min, signifying a potentially large source of water in the studyarea.Fluvial deposits range in thickness from 0 to100 feet (table 1). Thickness is highly variable,because of surfaces at both top and base (Graham andParks, 1986). Locally, the fluvial deposits may beabsent. The lithology of fluvial deposits is primarilysand and gravel, with minor layers of ferruginoussandstone.Fluvial deposits are separated from the Memphis aquifer by sediments of the Jackson Formationand the upper part of the Claiborne Group (fig. 5). Aswith the alluvium, if the underlying confining unit isthin or sandy, leakage between water-table aquifersand the Memphis aquifer may be substantial.Wells (1933), Graham (1982), and Graham andParks (1986, fig. 8) reported seasonal water-level fluctuations in the fluvial deposits in the range of from 2 to10 feet. Long-term declines of water levels within thefluvial deposits have not been documented, except inone location in the southern part of Sheahan well field(fig. 4). During the period 1943 to 1955, pumpage fromthe Memphis aquifer in the south Sheahan area dewa-tered the fluvial deposits around the southern part ofthe well field (Graham and Parks, 1986, figs. 7 and 8).Before pumping began in 1933 from the Sheahan wellfield, the fluvial deposits in the southern part of thewell field supplied small domestic wells, but thesewells were reported to be dry in 1985 (W.S. Parks, U.S.Geological Survey, written commun., 1985).No measurements of aquifer hydraulic characteristics have been reported for the fluvial deposits inthe Memphis area. Based on lithology, saturated thickness, and mode of occurrence, transmissivity probablyis within the range of 5,000 to 10,000 ft2/d, and storage coefficient probably is in the range of 0.1 to 0.2(Freeze and Cherry, 1979).Water quality in the fluvial deposits is highlyvariable. The distribution of dissolved-solids concentrations, which ranges from 76 mg/L iron to 440 mg/L,shows more variation in these deposits than in anyother aquifer in the area (Brahana and others, 1987,tables 2 and 3). Some of the variation may be relatedto the thickness of overlying loess, which may contribute much of the dissolved solids in the aquifer (Wells,1933). Dissolved-solids concentrations are lowest inthe east-central part of the Memphis area, between theLoosahatchie and Wolf Rivers (Brahana and others,1987, fig. 5).Memphis AquiferThe Memphis aquifer is the most productiveaquifer in the study area, providing approximately98 percent of total pumpage (188 Mgal/d) to the cityof Memphis in 1980 (Graham, 1982). Total pumpagesince 1886 is calculated to be more than 3.2 trilliongallons, using published pumping values (Criner andParks, 1976, fig. 2; Graham, 1982, table 2).The Memphis aquifer is a fine- to coarsegrained sand interbedded with layers of clay andminor amounts of lignite. The formation occurs atdepths ranging from 0 to 600 feet (table 2) and variesin thickness from 500 to 890 feet (table 1) based oninterpretations of geophysical logs. Generalized thickness of the Memphis aquifer in the Memphis area,based on work by Parks and Carmichael (1989a), hasbeen extrapolated to a slightly wider range from lessthan 500 to more than 900 feet (fig. 6).The Memphis aquifer is separated from theunderlying Fort Pillow aquifer by 140 to 310 feet ofclay of the Flour Island Formation, and from the overlying alluvium and terrace deposits by 0 to 370 feet ofclay and sandy clay of the Jackson Formation andHydrologic Setting13
14Hydrogeology and Ground-Water Flow in the Memphis andFort Pillow Aquifers in the Memphis Area, Tennessee
upper part of the Claiborne Group. The effectivenessof the Jackson Formation and upper part of the Claiborne Group as a confining unit appears to varybecause of areal differences in sand content and layerthickness (Graham and Parks, 1986). Due to this variability, rates of leakage from surficial aquifers are spatially heterogeneous.Water levels in the Memphis aquifer arestrongly influenced by pumping (fig. 7). Water levelswithin the outcrop area, which occurs in the southeastern part of the Memphis area, range from about 280 to290 feet above sea level (Graham, 1982, plate 1; Parksand Carmichael, 1989a, fig. 7). Recharge to the Memphis aquifer occurs primarily in the outcrop area(fig. 7). The deepest pumping cone of depression inthe Memphis aquifer is less than 100 feet above sealevel; the water levels at most other pumping centersare in the range of 120 to 170 feet above sea level(Graham, 1982, plate 1; Parks and Carmichael, 1989a,fig. 7). The widespread and irregular distribution ofpumping centers in the Memphis aquifer in the Memphis area causes a complex flow pattern as groundwater flows inward from all directions to severalpumping centers (fig. 7).Long-term water-level declines in the Memphisaquifer are greater than 120 feet in the area of maximum drawdown near the Mallory well field. East ofthe pumping centers near the areas of outcrop, longterm declines have not been detected (Parks and Carmichael, 1989a, fig. 10). Seasonal variations in waterlevels are commonly less than 2 feet in areas unaffected by pumping.Data from 23 representative aquifer tests in theMemphis aquifer (table 3; fig. 8) from throughout thenorthern Mississippi embayment show transmissivityranges from 2,700 to 45,000 ft2/d, and storage coefficients range from 1 x 10⁻⁴ to 6 x 10⁻⁴. Confined conditions are typical for the Memphis aquifer, except inareas of outcrop.The Memphis aquifer in the Memphis area(table 2) is reported to have a range of transmissivityfrom 6,700 to 54,000 ft2/d, and a range of storagecoefficients from 1 x 10⁻⁴ to 2 x 10⁻¹ (Criner and others, 1964; Moore, 1965; Hosman and others, 1968;Brahana, 1982a; Arthur and Taylor, 1990; Parks andCarmichael, 1989a, p. 27).Ground water in the Memphis aquifer is a calcium-magnesium-sodium bicarbonate type (Hosmanand others, 1968; Brahana and others, 1987, table 2).In the study area, water in the Memphis aquifer ischaracterized by a pH generally less than 7, and exceptfor a limited area in the northwestern part of the studyarea, the dissolved-solids concentration is generallyless than 100 mg/L.Fort Pillow AquiferThe Fort Pillow aquifer is a major regional aquifer throughout much of the northern Mississippiembayment (Hosman and others, 1968; Arthur andTaylor, 1990; Parks and Carmichael, 1989b). In theMemphis study area, the Fort Pillow aquifer currently(1989) provides water to supplement supplies at Millington, Tenn., the U.S. Naval Air Station near Millington, one industrial user in Memphis, and the Shawwell field east of Memphis (fig. 9). The Fort Pillowaquifer is the sole source of water for West Memphis,Marion, and other small towns in eastern Arkansas,and for the town of Walls in Mississippi (fig. 9). In1984, pumpage from the Fort Pillow aquifer averagedabout 10 Mgal/d (Graham and Parks, 1986). Althoughthe Fort Pillow aquifer is much deeper in the subsurface than the Memphis aquifer, the Fort Pillow is thepreferred aquifer in eastern Arkansas for municipaland domestic supplies because it provides water thatrequires less treatment than water from the Memphisaquifer.The Fort Pillow aquifer is characteristically afine- to medium-grained sand containing clay lensesand minor amounts of lignite. Thickness of the aquiferis commonly about 250 feet and ranges from about125 to 305 feet (table 1). The generalized thickness ofthe Fort Pillow aquifer in the Memphis area, based onwork of Parks and Carmichael (1989b), is shown infigure 10.The Fort Pillow aquifer is confined above by140 to 310 feet of clay of the Flour Island Formation,as defined by interpretation of geophysical logs(table 1). The Flour Island Formation is thought to bea leaky confining unit. Generalized thickness of theFlour Island confining unit in the Memphis area isbased on the work of Graham and Parks (1986, fig. 5)and E. Mahoney, Vanderbilt University (written commun., 1989) (fig. 11). Head differences between theMemphis aquifer and Fort Pillow aquifer (Graham andParks, 1986) occur as a result of pumping and areaffected by the vertical hydraulic characteristics andthickness of the Flour Island Formation.Water levels in the Fort Pillow aquifer (fig. 9) in1980 were from slightly less than 160 to more than240 feet above sea level. Water levels are highest inHydrologic Setting15
16Hydrogeology and Ground-Water Flow in the Memphis andFort Pillow Aquifers in the Memphis Area, Tennessee
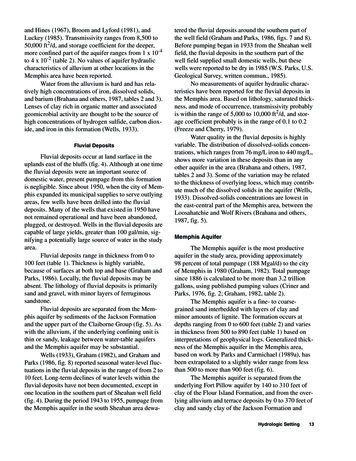
Table 3. Results of selected aquifer tests[Data source: 1, Davis and others (1973); 2, Moore (1965); 3, Newcome (1971); 4, Hosman and others (1968); 5, Luckey (1985); 6, Broom and Lyford(1981); 7, Albin and Hines (1967); 8, Halberg and Reed (1964); --, not reported; ft2/d, square feet per day; ft/d, feet per day]Test no.(keyed tofig. 930313233343536373839404142LocationMayfleld, Ky.Union City, Tenn.Tiptonville, Tenn.Dresden, Tenn.Kenton, Tenn.Dyersburg, Tenn.Milan, Tenn.Ripley, Tenn.Bells, Tenn.Covington, Tenn.Stanton, Tenn.Arlington, Tenn.Memphis, Tenn.Somerville, Tenn.Memphis (McCord), Tenn.Memphis (Mallory), Tenn.Memphis, Tenn.Memphis (Sheahan), Tenn.Memphis (Allen), Tenn.Memphis (Lichterman), Tenn.Germantown, Tenn.Collierville, Tenn.Clarksdale, Miss.Blytheville, Ark.Memphis (Mallory), Tenn.Madison Co., Tenn.Marks, Miss.Stoddard Co., Mo.Stoddard Co., Mo.Wayne Co., Mo.Butler Co., Mo.Clay Co., Ark.Jackson Co., Ark.Craighead Co., Ark.Jackson Co., Ark.Jackson Co., Ark.Poinsett Co., Ark.St. Francis Co., Ark.Lee Co., Ark.Monroe Co., Ark.Monroe Co., Ark.Phillips Co., Ark.Transmissivities 0-19,00024,00032,00034,000Hydraulicconductivity(K) -.0004--.0005-.0001Memphis SandMemphis SandMemphis SandMemphis SandMemphis SandMemphis SandMemphis SandMemphis SandMemphis SandMemphis SandMemphis SandMemphis SandMemphis SandMemphis SandMemphis SandMemphis SandMemphis SandMemphis SandMemphis SandMemphis SandMemphis SandMemphis SandMemphis SandFort Pillow SandFort Pillow SandFort Pillow SandFort Pillow 3-.0004.0001Hydrologic Setting17
18Hydrogeology and Ground-Water Flow in the Memphis andFort Pillow Aquifers in the Memphis Area, Tennessee
Hydrologic Setting19
20Hydrogeology and Ground-Water Flow in the Memphis andFort Pillow Aquifers in the Memphis Area, Tennessee
Hydrologic Setting21
the eastern part of the area, nearest the outcrop, andlowest in the west near the centers of pumping. Theregional movement of ground water in the Fort Pillowaquifer is toward the axis of the Mississippi embayment (Hosman and others, 1968).The hydrograph for well Fa:R-1 (location onfig. 9), which taps the Fort Pillow aquifer about27 miles east of the center of pumping at Memphis,shows a long-term decline of about 0.4 foot per year(ft/yr) (Graham, 1982). Regionally, declines of about1 ft/yr are not uncommon (Hosman and others, 1968;Brahana and Mesko, 1988, fig. 13). Graham (1982)noted that the hydrograph of well Sh:O-170 (locationon fig. 9) near the center of historic pumping in Memphis showed approximately 20 feet of recovery whenall municipal (MLGW) pumpage from the Fort Pillowaquifer ceased in the early 1970's. Seasonal variationsof nonstressed water levels are commonly less than2 feet (Graham, 1982, fig. 4).Hydraulic conductivity of the Fort Pillow aquifer throughout its area of occurrence in the northernMississippi embayment is reported to range from 25 to470 ft/d. This corresponds to a range of transmissivityfrom about 670 to 85,000 ft2/d. Storage coefficient isreported to range from 2 x 10⁻⁴ to 1.5 x 10⁻² (Hosmanand others, 1968; Boswell, 1976; Parks and Carmichael, 1989b). Data from aquifer tests of the FortPillow aquifer (table 3, fig. 8) indicate that transmissivity ranges from 2,700 to 21,000 ft2/d, and storagecoefficients range from 2 x 10⁻⁴ to 2.0 x 10⁻³.Within the Memphis area, hydraulic characteristics have a narrower range (table 2) than describedpreviously for the entire embayment. In the Memphisarea, transmissivity of the Fort Pillow aquifer isreported to range from 12,000 to 19,000 ft2/d, andstorage coefficient is reported to range from 1.2 x 10⁻⁴to 6.1 x 10⁻⁴ (Criner and others, 1964).Water from the Fort Pillow aquifer is a soft,sodium bicarbonate type with a median dissolvedsolids concentration of 116 mg/L (Brahana and others,1987). Iron concentrations range from 170 to1,900 micrograms per liter, and pH typically is about7.4.McNairy-Nacatoch AquiferThe McNairy-Nacatoch aquifer, which encompasses sands of the Ripley Formation, McNairy Sand(table 1), and equivalent Upper Cretaceous NacatochSand in Arkansas, is the basal freshwater aquifer in thestudy area. The McNairy-Nacatoch aquifer has not22Hydrogeology and Ground-Water Flow in the Memphis andFort Pillow Aquifers in the Memphis Area, Tennesseebeen used as a source of water supply in Memphis, butit has the potential for such use; north and east of thestudy area, it is a major regional aquifer (Brahana andMesko, 1988).The McNairy-Nacatoch aquifer ranges in thickness from 360 to 570 feet and is fine- to coarsegrained, glauconitic sand. The McNairy-Nacatochaquifer occurs deeper than 2,500 feet below land surface at Memphis, and is confined and hydraulicallyseparated from the overlying Fort Pillow Sand byabout 750 feet of clays of the Midway and lower Wilcox Groups (table 1). These confining clays, hereincalled the Midway confining unit, are a major hydrologic boundary in the northern Mississippi embayment. Arthur and Taylor (1990) simulated the Midwayconfining unit as a lower no-flow boundary. Brahanaand Mesko (1988) used flow modeling to evaluateleakage across the Midway confining unit; they foundless than 0.5 ft3/s moved across this confining unit inthe study area.Hydrogeologic evaluation of the McNairyNacatoch aquifer in the Memphis area is based onunpublished data from a single observation well in theMallory well field and on extrapolation of regionaldata (Boswell and others, 1965; Davis and others,1973; Luckey and Fuller, 1980; Edds, 1983; Brahanaand Mesko, 1988). The static water level in this well isapproximately 350 feet above sea level, which is about100 feet above land surface (W.S. Parks, U.S. Geological Survey, written commun., 1985). Seasonal variation in water level is about 2 feet, and no long-termdecline is evident. Head values in the McMairyNacatoch aquifer are approximately 180 feet higherthan heads measured in the overlying Fort Pillow aquifer (Brahana and Mesko, 1988, figs. 10 and 11).Water-level declines in the McNairy-Nacatoch aquiferdue to pumping in the overlying Fort Pillow aquiferhave not been observed.In addition to head differences, significant differences in water quality exist between the McNairyNacatoch aquifer and the Fort Pillow aquifer. Concentrations of dissolved solids, for example, are 10 timesgreater in the McNairy-Nacatoch aquifer than in theFort Pillow aquifer.Although the data from the McNairy-Nacatochaquifer are sparse, they are consistent on both a localand regional scale. These differences in hydrology andwater chemistry strongly support the contention thatclays in the Midway confining unit (Porters CreekClay, Clayton Formation, and Owl Creek Formation,
table 2) act as an effective confining unit (figs. 2and 3), and isolate the Fort Pillow aquifer from deeperaquifers.CONCEPTUALIZATION OF THEGROUND-WATER FLOW SYSTEMThe hydrogeologic information presented in theprevious section forms the basis for a conceptualmodel of ground-water flow in the Memphis area. Thisconceptualization accounts for the ability of eachmajor unit to store and transmit water, as indicated byits lithology and stratigraphy, and by hydrologic data.Water-quality data are also used to lend credence tohypotheses regarding the hydrologic isolation or communication between aquifers. The conceptual modelrepresents a simplification of reality but preserves andemphasizes the major elements controlling groundwater flow in the study area. This conceptual modelcan be tested quantitatively by depicting each of itselements mathematically in a digital model of groundwater flow. The relation between the hydrogeologicframework, the conceptual model, and the digitalground-water flow model is shown in figure 12.The alluvium and fluvial deposits form theuppermost water-table aquifers in the conceptualmodel. Water levels respond seasonally to recharge,evapotranspiration, and minor pumping, but on thetime scale of interest to this investigation, the watertable aquifers are at steady state. The one documentedexception to steady state occurred about 1943 in thesouthern area of the Sheahan well field. Conceptually,the water-table aquifers serve the important functionof providing a potentially large reservoir of verticalleakage to the underlying confined aquifers. Horizontal flow in the water-table aquifers are defined by thewater-level map (fig. 4), but are of incidental interestin this investigation. Recharge to the aquifer is primarily from the infiltration of rainfall on the outcrop. Discharge from these aquifers is primarily to streams, asbaseflow, and vertically to deeper aquifers as downward leakage.The Jackson-upper Claiborne confining unit isconceptualized as a leaky confining unit with variablethickness (fig. 5) and lithology. Leakance values forthis confining unit were poorly defined by aquifer testdata (table 2), and much quantitative testing of alternative leakance parameters and distributions were undertaken. In general, pumping from the Memphis aquiferhas induced flow from the shallow water-table aqui-fers downward to the Memphis aquifer through theJackson-upper Claiborne confining unit. Leakage hasincreased with time as the head difference between thewater-table aquifers and the Memphis aquifer hasincreased.Flow in the Memphis aquifer has been transientsince the onset of pumping in 1886. Recharge occursin the outcrop area in the southeastern and easternparts of the study area (fig. 13), and flow is predominantly into the centers of pumping from all directions(fig. 7). An increasing component of recharge isderived from leakage through time from the super andsubjacent aquifers across nonhomogeneous confiningunits. Pumping represents the major source of discharge from the system, and the areal and temporalvariation of pumping through time is the major reasonthis aquifer is not at steady state. Prior to pumping,discharge was westward to the subcrop of the Memphis aquifer beneath the alluvium, and upward beneaththe Mississippi River alluvial plain. Up dip pinch outof the Memphis Sand defines the limit of occurrenceof the Memphis aquifer, and no-flow boundariesaround the eastern, northern, and western boundariesconceptually represent ground-water conditions wherethe pinch out occurs. A major effort of quantitativetesting was focused on the Memphis aquifer and itsrelated hydrogeology, including its transmissivity,storage, boundary configuration, and pumping.The Flour Island confining unit is conceptualized as a confining unit that is less variable in thickness (fig. 11) and less leaky than the Jackson-upperClaiborne confining unit. Flow directions across theFlour Island confining unit are in response to dynamically changing heads in the overlying Memphis aquifer and underlying Fort Pillow aquifer. Quantitativetesting of the vertical hydraulic conductivity of thisunit was a specific focus of this investigation.Flow in the Fort Pillow aquifer has been transient since about 1924, not only in response to pumping from this aquifer in the study area, but to majorregional pumping in Arkansas. Recharge to the FortPillow aquifer occurs primarily in the outcrop areaseast and north of the study area. Vertical leakage provides some recharge at locations where heads in theoverlying Memphis aquifer are higher than heads inthe Fort Pillow aquifer. Discharge from the system isprimarily to a temporally and areally varying pumpingdistribution particularly in Arkansas (Arthur andTaylor, 1990). Some discharge from the Fort Pillowaquifer occurs as horizontal flow southward, and someConceptualization of the Ground-Water Flow System23
24Hydrogeology and Ground-Water Flow in the Memphis andFort Pillow Aquifers in the Memphis Area, Tennessee
Conceptualization of the Ground-Water Flow System25
Memphis aquifer (table 3; fig. 8) from throughout the northern Mississippi embayment show transmissivity ranges from 2,700 to 45,000 ft2/d, and storage coeffi-cients range from 1 x 10⁻⁴ to 6 x 10⁻⁴. Confined condi-tions are typical for the Memphis aquifer, except in areas of outcrop.