Transcription
1IS FREE CASH FLOW VALUE RELEVANT?THE CASE OF THE U.S. CONSUMER STAPLES INDUSTRY SECTORMostafa M. MaksyKutztown University of PennsylvaniaThe purpose of this study is to identify the accounting definition of free cash flow (FCF) that is the mostrelevant to investors in the consumer staples companies. Using correlations and multiple regressionanalysis on a sample of 9,971 observations covering the 25-year period from 1988 to 2012, the authorconcludes that the FCF that has the most significant association with stock price changes of consumerstaples companies, after controlling for many factors that may affect stock prices, is the one defined ascash flow from operations less cash flow for capital expenditures less cash outflow for preferred stockdividends. The author recommends that investors contemplating investing in consumer staples companieschoose companies with high FCF computed using this definition. The author further recommends thatconsumer staples companies that wish to voluntarily disclose FCF in their annual report should use thisdefinition of FCF.IntroductionFree Cash Flow (FCF) is a useful piece of information for investors to make investing or divestingdecisions because it is difficult to manipulate whereas net income (NI) may be manipulated. Also,companies cannot pay their bills (for example for salaries, construction of a new factory, or dividends)with NI. All these have to be paid in cash. Thus, it may be argued that a business's ability to generate cashis what really matters. NI, earnings per share (EPS), and return on investment (ROI), which are computedbased on accrual accounting, are important metrics of measuring a company’s profitability and are usedby many to make investment decisions. However, the income statement (I/S), which reports NI and EPS,spreads out the cash spent on long-term investments over time. So, if a company like Apple buys 1billion in computer equipment, the expense is spread out over 3-5 years on its I/S in the form ofdepreciation. However, unless Apple gets the equipment and pays for it in bonds or stocks (i.e., a noncash transaction) it will have to pay for the computer equipment. Even if Apple is able to get a bank loanthat will be paid over 3-5 years, it will still have to pay for the computer equipment up front, and in cash,which reduces its cash flow from operations (CFO) and, hence, its FCF. Thus, while the I/S smooths out abusiness's use of cash over time, the Statement of Cash Flows (SCF), from which FCF is calculated,offers no such smoothing benefit.Prior research is not conclusive as to whether FCF is associated with stock prices, i.e., whether it isrelevant to equity valuation (Maksy and Chen, 2013). Maksy and Chen noted that the accountingliterature has a wide variety of FCF definitions and they used a sample, comprising the energy industrysector over 25 years, to identify which FCF definition is value relevant to that sector. They concluded thatthe FCF computed as net CFO less Cash Flow for Investing Activities (CFI) less Preferred StockDividends (PSD) is the most significantly associated with stock price changes. A year later, Maksy andChen (2014) wanted to know if this FCF definition will be the same for all companies in the U.S. So, theycollected a large sample comprising all 10 industry sectors and reported that the FCF computed as CFOless Cash Flow for Capital Expenditures (CFCE) less PSD is the most significantly associated with stockprice changes for all companies. While CFCE represents most (and sometimes all) CFI for many
2companies, some companies’ CFI is much larger than CFCE. Given that industry sectors varysignificantly in terms of their CFCE and CFI activities, the aim in this paper is to identify which FCFdefinition, if any, is the most value-relevant for the consumer staples industry sector (CSIS) companies. Isit the same as the one that is most value-relevant for the energy companies? Or the one that is most valuerelevant for all industry sectors combined? Or is it a totally different definition from the above two?This study aims to provide two contributions to the literature. First, if FCF is value relevant for CSIScompanies, knowing which definition is the most value relevant for these companies would help investorsin that sector make better decisions as they would use that definition of FCF in making their investmentdecisions. If none of the FCF definitions is value-relevant, then investors may not need to waste their timeto include FCF in their decision making process. Second, if there is a specific definition of FCF that ismost value-relevant to CSIS companies, there are implications for financial accounting standard setters.While the Financial Accounting Standards Board (FASB) requires companies [in Statement of FinancialAccounting Standard (SFAS) No. 95 as originally issued in 1987 and as converted to Topic 230 in theFASB Codification Project], to report CFO on the SCF, it has so far discouraged companies fromreporting CFO per share. The FASB is concerned that requiring, or even encouraging, companies toreport CFO per share may be construed by some that it is moving away from accrual-basis accountingtoward cash-basis accounting. Thus, it requires companies to report EPS, which is based on accrualaccounting, on the face of the I/S but discourages companies from reporting CFO per share on the face ofthe SCF or anywhere else in the annual report. The results of this study might be considered by the FASBif it wants to engage in a project to decide whether to require CSIS companies to report a specificdefinition of FCF (but not FCF per share) in the body of the SCF or in the supplementary disclosures atthe bottom of the SCF, together with cash paid for income taxes and cash paid for interest expense. Or theFASB might just consider whether to prohibit CSIS companies from voluntarily disclosing FCF ofwhatever definition they prefer or require those companies to use a specific definition of FCF to enhancecomparability. Companies that voluntarily disclose FCF information use a wide variety of definitions ofFCF (apparently, each company is using the definition that shows the highest amount of FCF). Thesecompanies, on average, are less profitable and more leveraged than other firms in their own industries(Adhikari and Duru, 2006). Having all companies, in a given industry sector, reporting FCF that iscalculated in the same way would enhance comparability of accounting information across firms in thatsector (Maksy and Chen, 2013 and 2014).The CSIS comprises companies whose businesses are less sensitive to economic cycles. It includesmanufacturers and distributors of food, beverages, tobacco, and non-durable household goods andpersonal products. It also includes food & drug retailing companies as well as hypermarkets andconsumer super centers. Thus, consumer staples are goods that people are unable or unwilling to cut outof their budgets regardless of their financial situation. Also, people tend to demand consumer staples at arelatively constant level, regardless of their price. This sector is selected for the study because, asdescribed above, it represents a major part of the economy. Furthermore, comparability in one specificsector is one of the enhancing qualitative characteristics of useful financial information as stated inFASB’s Statement of Financial Accounting Concepts (SFAC) No. 8 (Maksy and Chen (2013). Theremaining sections of the paper cover the literature review, sample, statistical results, and conclusions ofthe study, respectively. The final section provides study limitations and some suggestions for furtherresearch.Literature ReviewThe accounting literature has many definitions of FCF (Maksy and Chen, 2013). FCF is defineddifferently from textbook to textbook, professional article to professional article, academic article toacademic article, from company to company (and some companies change their definition of FCF fromtime to time), and from all these to the popular press. A case in point, Mandalay Resort (formerly known
3as Circus Circus) was one of the first companies to report FCF information in its 1988 annual report. Overthe years, it has changed its FCF definition. In 1988 it defined it as Operating Income (OI), but in 2000, itadded back pre-opening expenses, abandonment loss, depreciation and amortization expense (D&A),interest, dividend, and other income, as well as proceeds from disposal of equipment and other assets.Coca-Cola defined FCF as CFO less CFI prior to 1999, but in 1999 it changed the definition to CFO less“acquisitions and investments.” That change in definition increased its FCF in 1999 by almost 2 billion.Different definitions of FCF are reported by popular magazines and investment advisory serviceorganizations such as Money, Forbes, the Motley Fool, Value Line, and InvestLinks (Mills, et. al, 2002).Maksy and Chen (2013 and 2014) reported different definitions of FCF in textbooks such asSubramanyam and Wild (2009) and Kieso, Weygandt, and Warfield (2013). The FCF definition in Kieso,Weygandt, and Warfield (2016) remains the same (CFO - CFCE – Total Dividends) as in the 2013edition of that most adopted Intermediate Accounting book by U. S. colleges and universities.A search for “free cash flow definition” on Google produced about 3.46 million entries for this title,the first of which is “Definitions of Free Cash Flow on the Web” (Maksy and Chen, 2013). Table 1presents the 15 definitions under this title, together with the web address associated with each definition.It is interesting to note that every definition is different. Adhikari and Duru (2006) report that of 548firms of their sample that voluntarily reported FCF information, 283 (or 51.6%) defined FCF as CFO –CFCE; 117 (or 21.4%) defined FCF as CFO – CFCE – Total Dividends; and 64 (or 11.7%) defined FCFas CFO – CFI. The remaining 84 firms (or 15.3%) defined FCF in four different other ways.Previous research studies about FCF present conflicting results as to whether FCF is positivelyassociated with stock prices. Some studies report no significant association or even negative associationand some report significant positive association. For example, Penman and Yehuda (2009), using adefinition of FCF as CFO less cash investments, find negative association and state that “a dollar more ofFCF is, on average, associated with approximately a dollar less in the market value of the business.” Theyalso find that this FCF definition has no association with changes in the market value of the equity.Moreover, after they controlled for the cash investment component of FCF, they find that CFO alsoreduces the market value of the business dollar-for-dollar and is unrelated to the changes in market valueof the equity. Additionally, GuruFocus.com, a website that tracks market insights and news of investmentgurus, published two research studies, Gurufocus (2013a and 2013b), concluding that earnings and bookvalues are significantly correlated with stock prices but FCF, defined as CFO – CFCE and acquisitions, isnot. On the other hand, companies with greater FCF, defined as CFO less CFCE, and greater growthopportunities, have higher value prices and their FCF is positively associated with stock returns (Habib,2011). Furthermore, Shahmoradi, (2013), using the same definition of FCF (CFO – CFCE) and a sampleof listed companies on Tehran Stock Exchange between 2002 and 2011, reported a relationship(significant at the .05 level) between FCF and stock returns.The literature review presented above, especially the accounting literature, indicates that FCF isdefined in so many different ways. The objective of this study is to determine which one of thesedefinitions, if any, is most correlated with (and, thus, is hypothesized to be the best predictor of) stockprice changes for the CSIS of the U.S.Maksy and Chen (2013 and 2014) proposed their own definition of FCF which is CFO less CapitalExpenditure required to Maintain Productive Capacity (CEMPC) less PSD. However, they used eightother most commonly used definitions of FCF to determine which one is most significantly associatedwith stock price changes. To identify which FCF definition is most significantly associated with stockprice changes of CSIS companies, the author will use the same nine definitions used in Maksy and Chen(2013 and 2014) as listed below:FCF1 CFO - CEMPCFCF2 CFO - CFCE
4FCF3 CFO - CFIFCF4 CFO - CEMPC - PSDFCF5 CFO - CFCE - PSDFCF6 CFO - CFI – PSDFCF7 CFO – CEMPC - TDFCF8 CFO – CFCE – TDFCF9 CFO – CFI - TDWhere: TD Total Dividends paid on common and preferred stock, and the other abbreviations are asdescribed previously.FCF2 is the most commonly used FCF definition in the financial press and the web, and FCF8 isStandard & Poors’ definition and is reported directly in its COMPUSTAT database from which the studysample was collected. Also note that the second three FCF definitions (FCF4 to FCF6) are the same as thefirst three FCF definitions (FCF1 to FCF3) except that PSD is subtracted in each definition. Similarly, thethird three FCF definitions (FCF7 to FCF9) are the same as the first three FCF definitions (FCF1 toFCF3) except that TD is subtracted in each definition.The change in the stock price per share ( SPPS) may be affected by changes in sales per share( SPS), earnings per share ( EPS), dividend per share ( DPS), and book value per share ( BVPS). Forthis reason, all these variables are included in the model so they can be controlled for to show the effect ofchange in FCF per share ( FCFPS) on SPPS. Moreover, to control for the size of the firm, the naturallogarithm of total assets (lnta) and the natural logarithm of total sales (lnsale) are included in the model.Furthermore, the author controls for year-end fixed effects. Thus, the proposed model as reported inMaksy and Chen (2013 and 2014) is as follows:ΔSPPS B0 B1ΔSPS B2ΔEPS B3ΔDPS B4ΔBVPS B5ΔFCFPS1-9 B6lnsale B7lnat .ΔFCFPS is computed as follows: FCFPSt – FCFPS t – 1 where FCFPS1t FCF1/weighted average numberof common shares outstanding during year t. This weighted average number of common shares iscomputed by dividing (NI – PSD) by EPS for year t. The same rule applies to all nine definitions ofFCFPS (FCFPS1 through FCFPS9). Appendix A provides full definitions of the model variables.The Study SampleAll CSIS companies listed in COMPUSTAT for the 25-year period 1988 to 2012 are included in thesample. All firm year observations that have missing variables are eliminated which resulted in a finalsample of 9,971 observations. The study period starts from 1988 because SFAS 95 was issued in 1987(however, all FASB SFASs, including SFAS 95, have been superseded in 2009 when the FASBCodification project became effective and the SCF is now under Topic 230 in the FASB Codification),which requires companies to disclose CFO. Since the model uses the changes from year to year, 1988observations will represent the changes from 1987 to 1988 data and all other years observations arederived in a similar manner. The study period ends in 2012 because this is the last year with available dataon COMPUSTAT at the time of collection. As Maksy and Chen (2013 & 2014) noted, one of the years ofthe study period, 2008, was a very abnormal year as total market indexes took a big dive because of theworld’s financial crisis that started during that year. During 2008, the Dow Jones Industrial average lost31 percent of its value (but at one point, in November of that year, it was down 39 percent). Also, theNASDAQ index lost 39 percent (but in November 2008 it was down 46 percent). Similarly, the S&P 500Cash Index lost 36 percent (but in November 2008 it was down 43 percent). It is possible that, because ofthat abnormality, the change in stock prices during 1988 was affected by psychological factors muchmore so than by financial factors. Because of that possibility, the author ran the model using a sample ofobservations ending in 2007 and ran it another time using a sample that excludes 2008 observations. Theresults from these different samples were not significantly different from the results based on the studyentire sample from 1988 to 2012.
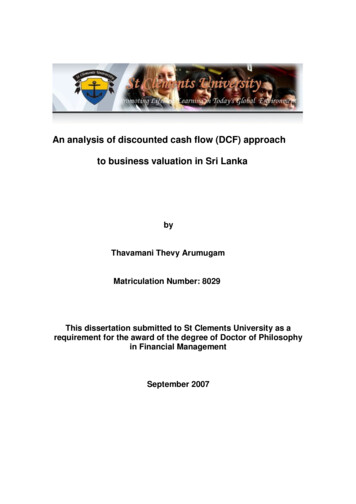
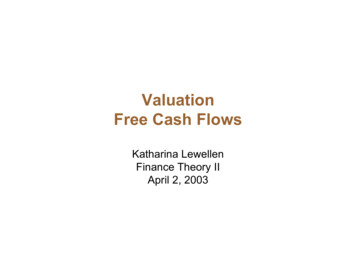
5Statistical ResultsPearson correlation coefficients for all the study and control variables are presented in TABLE 2.As TABLE 2 indicates, all FCF definitions have positive associations with changes in stock price (Δspps)at the 5% significance level. Among the control variables, Δspps is positively associated with changes insales per share (Δsps), changes in earnings per share (Δeps), and changes in book value per share (Δbvps),and these associations are statistically significant at the 5% level. Changes in dividends per share (Δdps),natural log of sales (lnsale) and natural log of total assets (lnat) are not significantly associated withΔspps. However, Δeps, and Δdps, are statistically and significantly associated with all definitions of FCF.On the other hand, Δsps is negatively and significantly associated with all definitions of FCF. Δbvps isnegatively associated with six FCF definitions (FCF1, FCF2, FCF4, FCF5, FCF7 and FCF8) andpositively association with the other three definitions (FCF3, FCF6 and FCF9). lnsale and lnat are notsignificantly associated with any of the FCF definitions suggesting that these variables would beappropriate controls.TABLE 2 correlations presented some interesting results which is further validated in amultivariate framework shown in TABLE 3 presenting regression coefficients for nine models byincluding one FCF definition at a time in the model. Besides the control variables specified in the model,the author also includes year fixed effects. These fixed effects control for heterogeneity at the year levelthat may not be captured by the set of controls. As TABLE 3 indicates, all FCF definitions have positiveassociations with Δspps at the 1% significance level after controlling for other determinants of changes instock price. Among the control variables, Δsps and Δeps are positively associated and Δbvps arenegatively associated with Δspps, and these associations are statistically significant at the 1% level acrossall FCF definitions. Δdps is negatively associated with Δspps, at the .10 level of significance, under FCF1and FCF4. However, it is positively associated with Δspps, at the .05 level of significance, under FCF7and at the .01 level of significance under FCF8. Δdps is not associated with Δspps under the remainingfive definitions of FCF (FCF2, FCF3, FCF5, FCF6 and FCF9). As under the univariate correlations,lnsale and lnat are also not statistically significantly associated with any of the FCF definitions suggestingthat these variables would be appropriate controls.In general, TABLE 3 confirms the results of the univariate correlations in TABLE 2 that all FCFdefinitions are significantly associated with Δspps at the .05 and .01 levels of significance. However, thecoefficients of association (under both the univariate and multivariate tests) are highest under three of thenine definitions of FCF (FCF2, FCF5 and FCF8). These three definitions of FCF that have the highestassociations with changes in stock prices have one thing in common: they all include CFCE as adeduction from CFO. That is the case whether CFCE alone is deducted (FCF2), CFCE and PSD arededucted (FCF5), or CFCE and TD are deducted (FCF8). This seems to suggest that PSD and TD havevery negligible effect, if any, on stock price changes. Of these three FCF definitions, FCF5 (CFO – CFCE–PSD) has a little bit more significant association (according to the t-statistic) with stock price changesthan the other two.ConclusionsIn light of the above statistical results, the author concludes that FCF5 (CFO – CFCE – PSD) is themost value-relevant definition of FCF for CSIS companies. While other definitions of FCF (including themost commonly used definition in the financial press and the web and Standard & Poors’ definitionreported directly in its COMPUSTAT database) are also significantly associated with stock price changes,FCF5 was the one that had the most significant association after controlling for year fixed effects and fortotal assets and total sales. The author does not want to go as far as to recommend that the standardssetters, particularly the FASB, should require CSIS companies to disclose FCF5 definition in the body of
6the SCF, or at its bottom, before a more extensive body of research is produced in support of this idea. Atthis time, the author recommends that CSIS companies (that voluntarily disclose FCF in their annualreports) should, at the very least, use only the FCF definition identified by this study.Limitations And Suggestions For Further ResearchMost research studies are subject to some limitations and this study is no exception. By far, the mostimportant limitation of this study is the possibility that the study model did not include other variablesthat could have affected stock price changes. When a statistical model does not include all possiblevariables, the combined effect of those other possible variables is represented by the error term in themodel. While the author added year fixed effects, which should help mitigate some concerns, they do noteliminate all concerns regarding unobservable explanatory variables. One other limitation of the study isthe possibility of other definitions for FCF which may be value-relevant. The author tried to develop ascomprehensive a list of FCF definitions as possible, however, other FCF definitions may possibly exist.For future research, the author suggests that the study be replicated using other variables that couldpossibly have some effect on stock price changes in addition to the variables included in this study model.A second suggestion is to include other definitions of FCF that are not tested in this study. A thirdsuggestion is to investigate whether a trading strategy could be developed shorting stocks of CSIScompanies which have the greatest negative change in one or more measures of FCF over the prior year.ReferencesAdhikari, A. and A. Duru 2006. Voluntary Disclosure of Free Cash Flow Information. AccountingHorizons 20 (4), December, pp. 311–332.Financial Accounting Standards Board. SFAC No.8 Conceptual Framework for Financial Reporting,Chapter 1, The objective of General Purpose Financial Reporting, and Chapter 3, QualitativeCharacteristics of Useful Financial Information. FASB (September 2010).Financial Accounting Standards Board. SFAS No. 95: Statement of Cash Flows. FASB (November1987).Financial Accounting Standards Board. FASB Codification, Topic 230: Statement of Cash Flows. FASB(2009).GuruFocus.com. 2013a. Earnings, Free Cash Flow, and Book Value? Which Parameters are Stock PricesMore Correlated To? ices-most-correlated-to-. August 2, 2013.GuruFocus.com. 2013b. Is Free Cash Flow Overrated for its Importance in Stock ockvaluation. August 8, 2013.Habib, A. 2011. Growth Opportunities, Earnings Permanence and the Valuation of FreeCash Flow. Australasian Accounting Business & Finance Journal, Vol. 5, No. 4, pp. 101-122.Kieso, D., J. Weygandt, and T. Warfield 2013. Intermediate Accounting, 15th Ed., New York, NY: JohnWiley & Sons.
7Kieso, D., J. Weygandt, and T. Warfield 2016. Intermediate Accounting, 16th Ed., New York, NY: JohnWiley & Sons.Maksy, M.M. and G.T. Chen 2013. “Which Free Cash Flow is Value Relevant? The Case of the EnergyIndustry,” Journal of Finance and Accountancy, Vol. 14, (Fall 2013), pp. 20-31.Maksy, M.M. and G.T. Chen 2014. “Which Free Cash Flow is Value Relevant? An EmpiricalInvestigations.” Journal of Accounting and Finance, Vol. 14 (6), 2014, pp. 189-200.Mills J., L. Bible, and R. Mason 2002. Rough Waters for Comparability: Defining Free Cash Flow. CPAJournal (January): 37–41.Penman, S. and N. Yehuda 2009. The Pricing of Earnings and Cash Flows and an Affirmation of AccrualAccounting." Review of Accounting Studies 14, no. 4, pp.: 453-479.Shahmoradi, N. 2013. The Effect of Growth Opportunities and Stable Profitability on Market Value ofFree Cash Flows of Listed Companies in Tehran Stock Exchange. Journal of Basic and Applied ScientificResearch, 3 (8), pp. 495-501.Subramanyam, K. R. and J. J. Wild 2009. Financial Statement Analysis, 10th Ed., Burr Ridge, IL:McGraw-Hill/Irwin.
8APPENDIX AVARIABLE DEFINITIONSΔsppsChange in stock price between the end of the current fiscal year and the end of the priorfiscal year.Δfcfps1Change in the difference between cash flow from operations (CFO) and depreciation andamortization expense (D & A) over the current fiscal year.Δfcfps2Change in the difference between CFO and cash flow for capital expenditures (CFCE)over the current fiscal year.Δfcfps3Change in the difference between CFO and cash flow for investing activities (CFI) overthe current fiscal year.Δfcfps4Change in CFO minus D & A minus preferred stock dividends (PSD) over the currentfiscal year.Δfcfps5Change in CFO minus CFCE minus PSD over the current fiscal year.Δfcfps6Change in CFO minus CFI minus PSD over the current fiscal year.Δfcfps7Change in CFO minus D & A minus total dividends (TD) over the current fiscal year.Δfcfps8Change in CFO minus CFCE minus TD over the current fiscal year.Δfcfps9Change in CFO minus CFI minus TD over the current fiscal year.ΔspsChanges in total sales per share over the current fiscal year.ΔepsChange in earnings per share over the current fiscal year.ΔdpsChange in dividends per share over the current fiscal year.ΔbvpsChange in book value per share over the current fiscal year.lnsaleNatural logarithm of total sales for the current fiscal year.lnatNatural logarithm of total assets at the current fiscal year end.
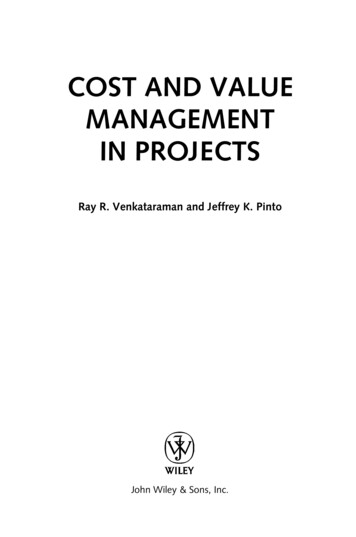
9TABLE 1DEFINITIONS OF FREE CASH FLOW ON THE WEB1. In corporate finance, free cash flow (FCF) is cash flow available for distribution among all thesecurities holders of an organization. They include equity holders, debt holders, preferred stockholders, convertible security holders, and so on. en.wikipedia.org/wiki/Free cash flow.2. Net income plus depreciation and amortization, less changes in working capital, less capitalexpenditure. en.wiktionary.org/wiki/free cash flow.3. Adjusted operating cash flow less interest and tax paid, prior to distributions to shareholders. This isthe cash flow available for payments of dividends and share buybacks as well as repayments ofcapital on /Pages/Home.aspx4. Cash flow from operating activities, investments, financial items and tax and the effect ofrestructuring measures on cash flow. www.investor.rezidor.com/phoenix.zhtml.5. EBITDA minus net interest expense, capital expenditures, change in working capital, taxes paid, andother cash items (net other expenses less proceeds from the disposal of obsolete and/or substantiallydepleted operating fixed assets that are no longer in operation). www.cemex.com/ic/ic glossary.asp.6. This item on the cash flow statement represents the sum of cash flows generated by operating andinvesting activities. investors.benettongroup.com/phoenix.zhtml.7. How much money a company could pay shareholders out of profits without expanding, but withoutrunning down its existing operations either. moneyterms.co.uk/d/8. Represents a common measure of internally generated cash and is defined as cash from operationsless fixed asset t/aboutacs/financial/WPCP 012234.9. Cash available after financing operations and investments, available to pay down . A stock analyst's term with a definition that varies somewhat depending on the particular analyst. Itusually approximates operating cash flow minus necessary capital expenditures.www.jackadamo.com/glossary.htm.11. The amount of money that a business has at its disposal at any given time after paying out operatingcosts, interest payments on bank loans and bonds, salaries, research and development and other fixedcosts. www.premierfoods.co.uk/investors/shareholder- services/Glossary.cfm.12. Net Operating Profit After Tax minus Year-to-Year change in Net Capital.www.intrinsicvalue.com/glossary.htm13. The increase in cash from one period to the h/GlossaryMain.htm.14. Cash flow after operating expenses; a good indicator of profit orphysicians/.15. The surplus cash generated from operating activities recognised in the profit and loss account. Thisexpresses a company's internal financing power, which can be used for investments, the repayment ofdebt, dividend payments and to meet funding 004/glossar e.php
10TABLE 2PEARSON CORRELATION 50.00-0.011.00-0.050.260.430.04-0.01-0.01Variables are defined in Appendix A. Numbers in bold indicate significance at the 5% 20.02lnsale1.000.95lnat1.00
11TABLE 3ASSOCIATION BETWEEN VAR
report CFO per share may be construed by some that it is moving away from accrual-basis accounting toward cash-basis accounting. Thus, it requires companies to report EPS, which is based on accrual accounting, on the face of the I/S but discourages companies from reporting CFO per share on the face of the SCF or anywhere else in the annual report.