Transcription
MAKE DATA MATTER .SEVENTH EDITION: PDF FORMAT2021 PV ModuleReliability ScorecardSEE MORE ONLINE AT MODULESCORECARD.PVEL.COM
PV EVOLUTION LABSAuthorsTara DoyleChief Commercial OfficerRyan DesharnaisChief Technical OfficerTristan Erion-LoricoHead of PV Module BusinessContributorsDavid DeLongLee MalmgrenMax MacphersonTori CliffordVictor SamuelAbout PV Evolution LabsPV Evolution Labs (PVEL) is the leading reliability and performance testing lab for downstream solar project developers,financiers, and asset owners and operators around the world and a member of the Kiwa Group. With over ten years ofexperience and accumulated data, PVEL conducts testing that demonstrates solar technology bankability. Its trusted,independent reports replace assumptions about solar equipment performance with data-driven, quantifiable metricsthat enable efficient solar project development and financing.The PVEL network connects all major PV and storage manufacturers with 400 global Downstream Partnersrepresenting 30 gigawatts of annual buying power. PVEL’s mission is to support the worldwide PV downstream buyercommunity by generating data that accelerates adoption of solar technology. Learn more online at pvel.com.
Table of ContentsIntroduction .4Solar Quality by the Numbers. 6Reliability in the Field. 8Test Results .7Methodology. 8Factory Witness. 9PVEL’s PV Module Product Qualification Program (PQP).10Results Overview.11Thermal Cycling.12Damp Heat.14Mechanical Stress Sequence.16Potential-Induced Degradation (PID).18Light-Induced Degradation (LID) and Light and Elevated Temperature-Induced Degradation (LETID).20PAN Performance.22Backsheet Durability Sequence.24PQP Failures.25Historical Scorecard.26Why Testing Matters . . . 42Conclusion. 30Next Steps. 313
IntroductionThere is no shortage of data today. But in a world of fake news, the challenge is finding the right data– the data that matters.PVEL’s 2021 PV Module Reliability Scorecard recognizes manufacturers with exemplary test results in our ProductQualification Program (PQP). But that is not the only data that matters for reliable solar power. This Scorecard extendsbeyond prior editions with more field data that connects lab testing to real-world project applications.Our findings reflect the resilience of the solar industry. Despite a global pandemic, demand for solar power is increasing.Manufacturers are rising to the challenge. Exawatt, a market intelligence provider and PVEL partner, predicts that over100 GW of new module production capacity will come online by the end of 2021.Manufacturers are also innovating to overcome supply constraints for key components such as glass, silver, evenpolysilicon. Technical advances are driving power classes past 500W in commercial PV modules. When buyers purchasebrand-new products, their modules will almost certainly be produced in brand-new factories. Deploying these unprovenbills of materials (BOMs) in the field can have profound financial implications and safety consequences.Product quality should not be sacrificed for growth when vital infrastructure is at stake, but it does occur.Twenty-six percent of the BOMs tested for this year’s Scorecard had at least one failure – an absolute increaseof six percent over last year. One in three manufacturers experienced a junction box failure, and the majorityof failures occurred before testing even began. Troubling junction box issues were first noted by PVEL in 2018.Fortunately, PV module buyers are not forced to choose between scale and quality. From the lab to the field, independenttesting provides data that developers, investors and asset owners can leverage as safeguards against projectunderperformance.The 7th edition of PVEL’s PV Module Reliability Scorecard is a compilation of trusted data that informs the developmentof reliable, financeable solar projects. Our goal is to drive deployment of solar assets that will operate as expected, evenin an uncertain world.JENYA MEYDBRAYCEOPV EVOLUTION LABS (PVEL)4
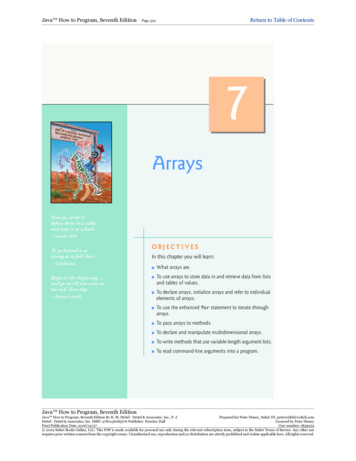
Solar Quality by the NumbersUnprecedented Growth BringsUnprecedented Challenges100 million solar cells are soldered every day to meet PV moduledemand. PVEL has observed degradation rates 15% in testing.More Growth ComingTo address climate change, we will need to reach at least1,000,000,000 cells soldered per day.Quality cannot be sacrificed for scale.PV Module FailuresReliable PV module performance depends on stringent manufacturing process controls and well-made components.When manufacturers overlook quality assurance and quality control steps or use substandard materials, prematurefailure in modules is likely to occur. An overview of common failure modes is shown below.Power (%)LID 0.5-5%LETID 0-10%PnominalGlass anti-reflectivecoating degradation EVA discoloring Delamination,cracked cell isolation 3% 10%Infant-failureMidlife-failureWarrantyContact failure j-box/string interconnectGlass breakageLoose framePIDDiode failureCell interconnectbreakageBacksheet failureCorrosion ofcell & interconnectWear-out FailureTimeSource: IEA PVPS 2014; LETID and backsheet failure added by PVEL, 20195
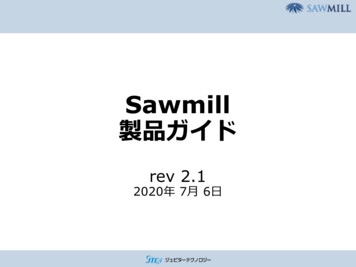
Reliability in the Field35 Years of Field Exposure Proves that BOM MattersA recent study of Europe’s first grid-connected solar project, the TISO-10-kW plant in Switzerland, demonstrates theprofound impact of material selection on long-term field performance. The use of quality materials in some modulesresulted in 20% higher power output after 35 years of field operation.Researchers determined that the use of different encapsulant formulations was the primary cause of degradation ratevariability. While modules with one type of encapsulant degraded just 4.9% on average after 35 years, modules with twoother encapsulant formulations exhibited much higher mean degradation rates of 19.1% and 26.1%.-4.9%-19.1%-26.1%PV modules with different encapsulant formulationswere exposed to the exact same field conditions forthirty-five years. One type of encapsulant remainstransparent with minimal signs of aging, but one isaging severely, and one is aging moderately.Sources: Virtuani A, Caccivio M, Annigoni E, Friesen G, Chianese D, Ballif C, Sample T, 35 years of photovoltaics: Analysisof the TISO‐10‐kW solar plant, lessons learnt in safety and performance — Part 1, Prog Photovolt Res Appl. 2019;27:328–339, DOI: 10.1002/pip.3104 Annigoni, E, Virtuani, A, Caccivio, M, Friesen, G, Chianese, D, Ballif, C. 35 years of photovoltaics: Analysis of the TISO-10-kW solar plant, lessons learnt in safety and performance—Part 2. Prog Photovolt Res Appl.2019; 27: 760– 778. https://doi.org/10.1002/pip.3146Higher Degradation Rates in New ModulesIn-depth studies of 36 solar projects in India show that modules with less than five years of field operation have higher averagedegradation rates than older modules, especially in hot climates. Across all sites, an average LID-discounted annual degradationrate of 1.47% was observed, which is higher than the 0.7% specified in most manufacturers’ linear performance warranties.Degradation was typically much higher in hot areas than in colder, mountainous regions where rates of 0.7% were observed.According to the researchers,the use of substandardmaterial components andinsufficient quality controlsas the industry expands mustbe considered as potentialcauses when newer solarprojects underperform.The findings may undermine thefinancial viability of 40-year modeledlifetimes for modern solar powerplants that assume aggressive annualdegradation rates, particularly ifrigorous due diligence that includesBOM specification is not conducted.Sources: Yogeswara Rao Golive, Sachin Zachariah, Rajiv Dubey, Shashwata Chattopadhyay, Sonali Bhaduri, Hemant K. Singh, Anil Kottantharayil, Birinchi Bora, Sanjay Kumar, Tripathi A.K., VasiJuzer, Narendra Shiradkar, “Analysis of Field Degradation Rates Observed in the All India Survey of PV Module Reliability 2018”, IEEE Journal of Photovoltaics, Vol. 10, Issue 2, pp. 560-567, Mar. 2020.Yogeswara Rao Golive et al., “All-India Survey of Photovoltaic Module Reliability: 2018”, A Report by the National Centre for Photovoltaic Research and Education (NCPRE), IIT Bombay.6
“We find evidence in this one system that the system degrades at a rate comparablewith the worst modules, implying that systems will degrade faster than the averagemodule rate when the modules show a spread of degradation rates. The performanceappears to be limited by the worst performing module and string.”Source: D. C. Jordan, B . Sekulic, B . Marion and S. R. Kurtz, “Performance and Aging of a 20-Year-Old Silicon PV System,” in IEEE Journal of Photovoltaics, vol. 5, no. 3, pp. 744-751, May 2015, doi:10.1109/JPHOTOV.2015.2396360.Test Results7
MethodologyScorecard rankings are based on results from PVEL’s Product Qualification Program (PQP) for PVmodules. The program, established in 2012, provides independent reliability and performance dataand recognition for manufacturers who excel in testing.PQP starts with PVEL’s factory witness, where auditors monitorproduction and record the bill of materials of every modulesubmitted for testing. Following shipping, PVEL measures poweroutput and assesses the physical condition of each modulebefore conducting extended reliability and performance testing.The test program is detailed in the PQP diagram on page 10.The PQP supports solar equipment buyers, investors and assetowners with a methodical test program that enables objectivesupplier evaluations and rigorous due diligence.Four Principles Guide the PQPEmpirical dataThe PQP provides empirical metrics for revenue and energy yieldmodeling.No hand-picked samplesAuditors witness production of all test samples and record billsof materials (BOMs).Standard processesThe PQP tests all BOMs in the same way with calibratedequipment and in consistent test environments.Regular program updatesTest sequence updates provide data on new technologies andmanufacturing techniques.Industry Perspective:PQP Benefitsfor Manufacturers“Since Boviet began PQP testingwith PVEL in 2018 our saleshave increased by over 100%.The PVEL PQP quickly becameinstrumental to our long-termgrowth strategy: PVEL’s trustedand independent productvalidation is now fundamentalin Boviet’s go to market strategyfor all of our products.”Sienna Cen,President – Boviet Solar USADevelopers and investors around the world now require PQPfor procurement risk mitigation. Click here to join PVEL’sDownstream Partner Network. Members receive free access toPQP reports.8
Factory WitnessPVEL auditors follow an eight-step process to inspect PV module factories and verify the BOM.1.2.3.4.5.6.7.8.Conduct a high-level process audit of the factory.Photograph BOM components as materials are removed from original packaging.Observe and record over 100 technical details about the BOM.Strictly track each BOM component through every step of production.Collect backsheet, encapsulant and connector samples.Document recipes for soldering and laminating.Sign each module and seal pallets with tamperproof tape.Ship pallets directly to PVEL for PQP testing.Buyers should specify approved BOMs in supply agreements to make sure they procure modules thatperformed well in PQP testing. Click here to ask PVEL for free, detailed BOM listings to accompanysupply agreements.Industry Perspective:Factory AuditsClean Energy Associates (CEA) has completedmore than 45 GW of quality assurance (QA) auditsat 350 factories worldwide. PVEL recommends QAaudits to buyers as a procurement best practiceand includes several important QA audit protocolsin PQP factory witnesses. CEA’s quality controlengineers regularly encounter issues such as: Cell ribbon misalignmentPoor/cold solderingPoor pottant curingInaccurate electrical test resultsOverlooked defects in EL imagesPoor/cold soldering is one of the most commonlyobserved problems. It can lead to hotspots, lowmodule power or even module failure in the field.Poor soldering occurs on automated lines if thetabbing/stringing machine operates outside of theset specifications or the wrong settings were input.On manual production lines, the cause isoperator error.Poor soldering can be identified with a visual paper gaptest. Photo courtesy of CEA.Poor soldering can be mitigated byregularly ensuring that tabbing/stringingmachines are set to correct specifications andby performing quality checks such as visualinspection, EL imaging and gap tests.Contributed by:Morgan OatsMarketing ManagerClean Energy Associates9
PVEL’s PV Module Product QualificationProgram (PQP)Factory WitnessIntake CharacterizationsLight Soaking for Light-Induced DegradationPost-Light Soaking nducedDegradationTC 200DH 1000DH 1000CharacterizationCharacterization85 C, 85%RHMSV ( and/or –)96 ivityTC 200DH 1000UV65 calLoad85 C, 85%RHMSV ( and/or –)96 hrsTC 200Stabilization85 C, Isc, 48 hrsTC 50 HF N File& IAM ProfileFieldExposureLeTID 162 hrs(75 C, Isc-Imp)PAN FileCharacterizationIAM ProfileFieldExposure6 MonthsLeTID 162 hrs(75 C, Isc-Imp)CharacterizationLeTID 162 hrs(75 C, Isc-Imp)CharacterizationFieldExposure6 MonthsCharacterizationCharacterizationTC 50UV65 kWh/m2CharacterizationCharacterizationTC 50 HF 10HF 10CharacterizationCharacterizationUV65 kWh/m2CharacterizationTC 50 HF 10UV6.5 kWh/m2CharacterizationFor bifacial modules, PVEL conducts additional rear side characterizations and field exposure over two albedos. 2021 PVEL LLC.10
Results OverviewThe 2021 PV Module Reliability Scorecard shows Top Performers for six PQP test categories.Each set of results shows Top Performers by modeltype in alphabetical order by manufacturer. Anexample of a module with high levels of degradationis provided for each reliability test, complete withelectroluminescence (EL) images and flash testresults. Results also show a chart of average powerdegradation for each module model that includescurrent and historical data.To be eligible for the Scorecard, manufacturersmust have: Completed the factory witness within 18 monthsof 2021 Submitted BOMs to all test sequences in the PQP1 Submitted at least two factory-witnessed PV modulesamples per test sequence.Top Performers are determined by averaging results ofevery BOM tested by PVEL that is sold under the samemodel type. While individual BOMs are not marketedto buyers, PQP reports make it possible to procureBOMs that performed well in testing.Top Performers must have less than 2% degradationfollowing each reliability test sequence. PANperformance is determined using PVsyst simulations;Top Performers must finish in the top quartile ofenergy yield.Not all products or model types are represented inevery test. Manufacturers with top results can choosenot to be listed in the Scorecard. In some cases, testresults were not available at the time of publication.Only characterizations for PAN files and IAM profilesare optional.1Industry Perspective:Models, BOMs and the PV Module Supply ChainPV modules sold under the exact same modeltype can have completely different BOMs. Aslong as all materials are listed in the model’sIEC certification report, manufacturers can mixand match key components, including cells andbacksheets. As an ISO/IEC 17020:2012-accreditedinspection body specialized in photovoltaics andenergy storage, Senergy Technical Services (STS)inspectors have witnessed these BOM variationsin factories all over the world, for more than10 years.While the practice of supplying one BOM forcertification testing and another BOM to themarket raises quality concerns, supply chaindiversification is necessary for a dependableglobal supply of PV modules. Through the pastyear, market turmoil caused by wide-rangingfactors including COVID-related factory closures,new trade policies, new environmental or socialresponsibility requirements, and even shortages ofglass or polysilicon, have highlighted the fragilityof the PV module supply chain.STS completed GWs of PV module inspectionsin Q1 2021 and found that nearly a third of theprojects exhibited at least one BOM-relatednon-conformity.Contributed by:Frédéric Dross, Vice President,Strategic Development, STSSTS inspector examines a module during a productionaudit. Photo courtesy of STS.11
Thermal Cycling OverviewKey TakeawaysThermal Cycling Top Performers Strong thermal cycling (TC) results continued to be a trendin the 2021 Scorecard test population with a median powerdegradation of -0.86% after TC600, though not all moduleswere Top Performers.MANUFACTURERMODEL TYPESAdani/MundraASB-7-AAA-n (ASB-6-AAA-n) ; Compared to PVEL’s historic PQP results, monocrystallinewafers and Passivated Emitter and Rear Contact (PERC) cellsexhibit stronger TC performance than multicrystalline wafersand Aluminum Back Surface Field (Al-BSF) cells. For all the advantages of multi-busbar (MBB) modules, e.g.,reduced power loss from microcracks and higher outputpower, improper soldering can lead to poor TC results.Three-, four- and five-busbar modules have thus far onaverage performed better in TC than MBB modules. Modules can meet the requirements for IEC 61215 aftercompleting 200 thermal cycles but then exhibit significantdegradation following the PQP’s more rigorous TC600benchmark. Bifacial TC results showed both glass//glass and glass//backsheet bifacial modules achieving Top Performerstatus, with the amounts of front-side and rear-side powerdegradation aligned.ASB-7-AAA-p M(DG)/F-BH-xxx) ;CHSM72M-HC-xxx (CHSM60M-HC-xxx)BovietBVM6612M-xxxL-H-BF-DG (BVM6610MxxxL-H-BF-DG) )ET SolarET-M672BHxxxTW (ET-M660BHxxxTW)GCLGCL-M3/72DH (GCL-M3/60DH) ;GCL-M3/72GDF (GCL-M3/60GDF) ;GCL-M3/72H (GCL-M3/60H) ;GCL-M6/72GDF (GCL-M6/60GDF)HyundaiHiS-SxxxGIJinkoJKMxxxM-72H-TV (JKMxxxM-72HL-TV,JKMxxxM-60H-TV, JKMxxxM-60HL-TV)LONGiLR4-72HBD-xxxM (LR4-60HBD-xxxM) ;LR4-72HIBD-xxxM (LR4-60HIBD-xxxM) ;LR4-72HIH-xxxM (LR4-60HIB-xxxM) ;LR4-72HPH-xxxM (LR4-60HPH-xxxM,Test BackgroundAs fielded module temperatures rise and fall, the componentsexpand and contract. With different thermal expansioncoefficients, components can expand and contract at differentrates in the same environmental conditions. This stresses thebonds between each PV module layer. Solder bond fatigue,for example, increases voltage drop in the module as currentpasses through a higher-resistance internal circuit, thusdiminishing performance when the sun is at its brightest.Test ProcedureThe thermal cycling test sequence subjects modules to extremetemperature swings in an environmental chamber wheremodules are chilled to -40 C, dwelled, then heated to 85 C,and dwelled again. While the temperature is increased, themodules are also subjected to maximum power current. Thecycle repeats 200 times over three periods for a total of 600cycles. IEC 61215 testing, by comparison, requires 200 cyclesoverall.LR4-60HPB-xxxM) ;LR6-72HPH-xxxM Axxx-G-AC (SPR-MAX5-xxx-E3-AC,SPR-Axxx-BLK-G-AC, SPR-MAX5-xxxBLK-E3-AC, SPR-Axxx, SPR-MAX5-xxx,SPR-Axxx-BLK, SPR-MAX5-xxx-BLK) ;SPR-P3-xxx-COM-1500 (SPR-P3-xxx-BLK)Phono SolarPSxxxM4GFH-24/THQ CELLSQ.PEAK DUO L-G5.2 (Q.PEAK DUO G5,Q.PEAK DUO BLK-G5) ;Q.PEAK DUO BLK-G6 /SC (Q.PEAK DUOBLK-G6 , Q.PEAK DUO-G6 ) ;Q.PEAK DUO-G7 (Q.PEAK DUO BLK-G7) ;Q.PEAK DUO L-G8.3 (Q.PEAK DUOBLK-G8 , Q.PEAK DUO-G8 ) ;Q.PEAK DUO L-G8.3/BFGREC GroupTP3M BlackSeraphimSRP-xxx-BMA-BGSilfabSIL-xxxBLNote for Top Performers:Manufacturers are listed in alphabetical order. The tested product is listed first.Variants for which the test results are representative are listed in parentheses. Insome cases, test results were not available at the time of publication.12
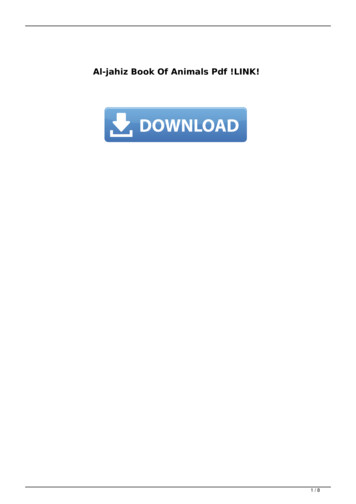
Thermal Cycling Test ResultsPOWER DEGRADATION FROM TC TEST SEQUENCE FOR EACH MODULE MODEL0.0%TOPPERFORMERSABOVE THIS LINEPower Degradation2.0%4.0%6.0%8.0%Historical2021 TC10.0%An Example from the CTC6002.0%Deviation from Prestress4.0%PMAXFF0.0%Deviation from PrestressLessons learnedfrom Failure TC4002.0%Deviation from PrestressExample fromthe Field 0.0%ISCSee more %10.0%12.0%12.0%12.0%13
Damp Heat OverviewKey TakeawaysDamp Heat Top Performers PVEL’s latest test results indicate that damp heat (DH) remainscritical for identifying modules susceptible to moistureingress, even though the industry has yet to reach consensuson the field relevancy of boron-oxygen (BO) destabilizationthat is observed in many PERC modules.MANUFACTURERMODEL TYPESAdani/MundraASB-7-AAA-p* (ASB-6-AAA-p*)BovietBVM6612M-xxxL-H-BF-DG (BVM6610M- 30% of the Top Performers achieved less than 2% degradationbefore the 48-hour high-heat, high-current BO stabilizationtreatment after DH2000. The remaining Top Performersachieved less than 2% degradation after power loss recoveryfrom BO stabilization. Pre- and post-stabilization results areprovided in PQP reports to delineate reversible BO-induceddegradation from irreversible DH-induced degradation. In the provided lab example, a module completed the 1,000hour DH test duration with less than 5% power degradation,a result that passes IEC 61215. After another 1,000 hours,power loss soared to 11.7% and did not fully recover after BOstabilization. DH results for glass//glass modules are comparable toglass//backsheet designs, showing that manufacturers havegenerally overcome early issues with glass//glass designs.For bifacial modules, the amounts of front-side and rear-sidepower degradation are similar.Test BackgroundxxxL-H-BF-DG) G*)ET SolarET-M672BHxxxTW (ET-M660BHxxxTW)GCLGCL-M3/72DH* (GCL-M3/60DH*) ;GCL-M3/72GDF* I*JA SolarJAM72S09-xxx/PR (JAM60S09-xxx/PR) ;JAM72S10-xxx/MR (JAM78S10-xxx/MR,JAM60S10-xxx/MR)LG ElectronicsLGxxxN1C-N5* ;LGxxxN1C-V5*LONGiLR4-72HBD-xxxM* (LR4-60HBD-xxxM*)Maxeon/SunPowerSPR-Axxx-G-AC (SPR-MAX5-xxx-E3-AC,SPR-Axxx, SPR-MAX5-xxx) ;SPR-Axxx-COM (SPR-MAX5-xxx-COM) ;SPR-P3-xxx-COM-1500*Q CELLSPV modules experience periods of high temperature andhumidity not only in tropical and subtropical regions but alsoin moderate climates. In these conditions, inferior qualitycomponents or substandard lamination procedures can lead todegradation or premature failure. The damp heat test replicatesdegradation and failure mechanisms that can occur in the field.Q.PEAK DUO BLK-G5* ;Q.PLUS DUO L-G5.2* (Q.PLUS DUO-G5*) ;Q.PEAK DUO L-G5.2* (Q.PEAK DUO-G5*) ;Q.PEAK DUO BLK-G6 /SC* (Q.PEAK DUOBLK-G6 *, Q.PEAK DUO L-G6.2*) ;Q.PEAK DUO-G7* (Q.PEAK DUO L-G7*) ;Q.PEAK DUO L-G8.3* (Q.PEAKDUO-G8 *)Test ProcedureThe damp heat test subjects modules to a constant 85 C and85% relative humidity in an environmental chamber for twoperiods of 1,000 hours—twice the duration required for IECcertification. The combination of high heat and intense moisturestresses the PV module layers. An environment with hightemperature and no current can lead to destabilizing passivatedBO complexes within some PERC cells. In the current PQP,to explore this phenomenon PVEL added a post-DH2000 BOstabilization process.A Note for Top Performers:Manufacturers are listed in alphabetical order. The tested product is listed first.Variants for which the test results are representative are listed in parentheses. Insome cases, test results were not available at the time of publication.REC GroupAlpha* ;Alpha Black* ;TP3M nTD6G72M-xxx (TD6G60M-xxx)VSUNVSUNxxx-72MH* (VSUNxxx-60MH*)*Top-performing result achieved after BO stabilization.PVEL contacted six industry experts for opinionson the field relevancy of BO destabilization. Theyagreed BO destabilization will not occur in the fieldwithin the first 10 years. Opinions on the long-termimpacts were mixed. Go online to learn more.14
Damp Heat Test ResultsPOWER DEGRADATION FROM DH TEST SEQUENCE FOR EACH MODULE MODEL0.0%TOPPERFORMERSABOVE THIS LINEPower Degradation2.0%4.0%6.0%8.0%Historical DH20002021 DH2000Historical Post-BO Stabilization2021 Post-BO Stabilization10.0%An Example from the %Deviation from Prestress6.0%PMAXFF0.0%Deviation from PrestressLessons learnedfrom Failure 4.0%Post BODH20002.0%Deviation from PrestressExample fromthe Field 0.0%ISCSee more 0%10.0%12.0%12.0%12.0%15
Mechanical Stress Sequence OverviewKey TakeawaysMSS Top Performers Module susceptibility to cell cracking depends on many factorsand results are nuanced. In general, PVEL has found that:MANUFACTURERMODEL TYPESBovietBVM6612M-xxxL-H-BF (BVM6610M- half-cut cells perform better than full cells; 120-cell designs perform better than 144-cell designs; monocrystalline cells perform better than multicrystallinecells; multi-busbar cells perform better than 3BB, 4BB or 5BB cells; interdigitated back contact (IBC), cadmium telluride (CdTe)thin film, and glass//glass module technologies have alsoshown minimal degradation. Modules can experience significant cell cracking during MSStesting using the ideal mounting: rails running the width ofthe module in one-quarter segments on either end. For thesemodules alternative configurations used in trackers and roofmounts are very likely to exhibit a greater degree of cellcracking. The installation manuals for select modules do not includePVEL’s standard MSS mounting configuration. These modulesachieved Top Performer results when tested according to themanufacturer’s manual. PVEL encourages review of PQP testreports and installation manuals for mounting guidance. Compared to PVEL’s historical database of DML TC50 HF10results, the results of median power loss from MSS, which addsSML to the start of the sequence, increased by almost 50%.Test BackgroundxxxL-H-BF) ;BVM6612M-xxxL-H-BF-DG(BVM6610M-xxxL-H-BF-DG) )ET SolarET-M672BHxxxTW (ET-M660BHxxxTW)First SolarFS-6xxxAJinkoJKMxxxM-7RL3-VLG ElectronicsLGxxxN1C-N5 (LGxxxN1C-V5) ;LONGiLR4-60HPB-xxxM ;LR4-72HBD-xxxM (LR4-60HBD-xxxM) ;LR4-72HPH-xxxM (LR4-60HPH-xxxM)Maxeon/SunPowerSPR-Axxx-G-AC (SPR-MAX5-xxx-E
Product quality should not be sacrificed for growth when vital infrastructure is at stake, but it does occur. . The 7th edition of PVEL's PV Module Reliability Scorecard is a compilation of trusted data that informs the development of reliable, financeable solar projects. Our goal is to drive deployment of solar assets that will operate as .