Transcription
Electricity Generation BaselineReportJeffrey Logan, Cara Marcy, James McCall,Francisco Flores-Espino, Aaron Bloom,Jørn Aabakken, Wesley Cole, Thomas Jenkin,Gian Porro, and Chang LiuNational Renewable Energy LaboratoryFrancesco GandaArgonne National LaboratoryRichard BoardmanIdaho National LaboratoryThomas Tarka, John Brewer, and Travis SchultzNational Energy Technology LaboratoryNREL is a national laboratory of the U.S. Department of EnergyOffice of Energy Efficiency & Renewable EnergyOperated by the Alliance for Sustainable Energy, LLCThis report is available at no cost from the National Renewable EnergyLaboratory (NREL) at www.nrel.gov/publications.Technical ReportNREL/TP-6A20-67645January 2017Contract No. DE-AC36-08GO28308
Electricity Generation BaselineReportJeffrey Logan, Cara Marcy, James McCall,Francisco Flores-Espino, Aaron Bloom,Jørn Aabakken, Wesley Cole, Thomas Jenkin,Gian Porro, and Chang LiuNational Renewable Energy LaboratoryFrancesco GandaArgonne National LaboratoryRichard BoardmanIdaho National LaboratoryThomas Tarka, John Brewer, and Travis SchultzNational Energy Technology LaboratoryPrepared under Task No. EP42.0401NREL is a national laboratory of the U.S. Department of EnergyOffice of Energy Efficiency & Renewable EnergyOperated by the Alliance for Sustainable Energy, LLCThis report is available at no cost from the National Renewable EnergyLaboratory (NREL) at www.nrel.gov/publications.National Renewable Energy Laboratory15013 Denver West ParkwayGolden, CO 80401303-275-3000 www.nrel.govTechnical ReportNREL/TP-6A20-67645January 2017Contract No. DE-AC36-08GO28308
NOTICEThis report was prepared as an account of work sponsored by an agency of the United States government.Neither the United States government nor any agency thereof, nor any of their employees, makes any warranty,express or implied, or assumes any legal liability or responsibility for the accuracy, completeness, or usefulness ofany information, apparatus, product, or process disclosed, or represents that its use would not infringe privatelyowned rights. Reference herein to any specific commercial product, process, or service by trade name,trademark, manufacturer, or otherwise does not necessarily constitute or imply its endorsement, recommendation,or favoring by the United States government or any agency thereof. The views and opinions of authorsexpressed herein do not necessarily state or reflect those of the United States government or any agency thereof.This report is available at no cost from the National Renewable EnergyLaboratory (NREL) at www.nrel.gov/publications.Available electronically at SciTech Connect http:/www.osti.gov/scitechAvailable for a processing fee to U.S. Department of Energyand its contractors, in paper, from:U.S. Department of EnergyOffice of Scientific and Technical InformationP.O. Box 62Oak Ridge, TN 37831-0062OSTI http://www.osti.govPhone: 865.576.8401Fax: 865.576.5728Email: reports@osti.govAvailable for sale to the public, in paper, from:U.S. Department of CommerceNational Technical Information Service5301 Shawnee RoadAlexandria, VA 22312NTIS http://www.ntis.govPhone: 800.553.6847 or 703.605.6000Fax: 703.605.6900Email: orders@ntis.govCover Photos by Dennis Schroeder: (left to right) NREL 26173, NREL 18302, NREL 19758, NREL 29642, NREL 19795.NREL prints on paper that contains recycled content.
AcknowledgmentsThe authors wish to thank the Baseline Generation Team at the Office of Energy Policy andSystem Analysis (EPSA) in the U.S. Department of Energy (DOE) for the sponsorship andguidance on this work. Rob Anderson, Carol Battershell, Aaron Bergman, Erin Boyd, AlexBreckel, Hugh Chen, Christina Cody, Carla Frisch, Liz Hartman, Eric Hsieh, Emily Lewis, LarryMansueti, Josh Olazabal, Jeanette Pablo (team lead), Lara Pierpoint, John Richards, and RobertSchmitt provided helpful feedback and advice during the process of producing this report. Wealso thank Michelle Dallafior (Office of Electricity Delivery and Energy Reliability), PaulDonohoo-Vallet (Office of Energy Efficiency and Renewable Energy), Sarah Forbes (Office ofFossil Energy), Michael Goff (Office of Nuclear Energy), Lindsey Griffith (EPSA), Elke Hodson(EPSA), Jordan Kislear (Office of Fossil Energy), Steve Lindenberg (Office of EnergyEfficiency and Renewable Energy), Timothy Reinhardt (Office of Energy Efficiency andRenewable Energy), Margaret Schaus (Office of Fossil Energy), and Bradley Williams (Office ofNuclear Energy) for interim feedback and review.We also appreciate the critical reviews by the following individuals and organizations, whichimproved and informed the analysis contained herein: Michelle Melton (Center for Strategic andInternational Studies), Karl Hausker (World Resources Institute), Manuel Baritaud (InternationalEnergy Agency), Doug Smith and Sue Sheridan (Van Ness Feldman), and many individualsfrom the Electric Power Research Institute.Any remaining errors, omissions, or mischaracterizations are the responsibility of the authors.iiiThis report is available at no cost from the National Renewable Energy Laboratory (NREL) at www.nrel.gov/publications.
Scope and OrganizationThis report was developed by a team of national laboratory analysts over the period October2015 to May 2016 and is part of a series of studies that provide background material to informdevelopment of the second installment of the Quadrennial Energy Review (QER 1.2). The reportfocuses specifically on U.S. power sector generation. The report limits itself to the generationsector and does not address in detail parallel issues in electricity end use, transmission anddistribution, markets and policy design, and other important segments.Chapter 1 provides a brief introduction to the report.Chapter 2 of the report focuses on the main drivers of change, as well as future uncertainties, inthe U.S. generation sector. These include the impact of low natural gas prices; the rise ofrenewable and distributed generation; recent Federal and State policies impacting generation; thedecoupling of gross domestic product (GDP), electricity demand, and greenhouse gas (GHG)emissions; and the electrification of the transportation sector.Chapter 3 discusses crosscutting metrics and trends in the U.S. generation sector. Theseattributes include generation roles, capacity factors and heat rates, costs, sustainabilitycharacteristics, ownership types, and Federal policy.Chapter 4 describes recent trends in power generation, focusing on the national and regionallevels at the North American Electric Reliability Corporation (NERC) boundaries.Chapters 5 through 13 focus on individual generation technologies and provide information ontechnology cost and performance trends, fuel supply, environmental impacts, constraints,existing deployment metrics, and policy and regulatory drivers that have impacted deploymentand could affect future development.Appendix A contains additional information about each generation technology. Appendix Bcontains details on the levelized cost of electricity (LCOE) methodology used in chapter 3 andthroughout.ivThis report is available at no cost from the National Renewable Energy Laboratory (NREL) at www.nrel.gov/publications.
ELBNLLCOEalternating currentAnnual Energy Outlook 2015acid mine drainageBritish thermal unitboiling water reactorscombined cyclecarbon capture and storagecarbon dioxideClean Power Planconcentrating solar powercombustion turbineconstruction work in progressdirect currentU.S. Department of Energyenhanced geothermal systemsU.S. Energy Information Administration (DOE)enhanced oil recoveryU.S. Environmental Protection AgencyElectric Power Research InstituteOffice of Energy Policy and Systems Analysis(DOE)Electric Reliability Council of Texaselectric vehicleU.S. Federal Energy Regulatory CommissionFrontier Observatory for Research in GeothermalEnergyFlorida Reliability Coordinating Councilgross domestic productgreenhouse gasgigawattgigawatt-days per metric ton uraniumgigawatt electricalgigawatt-hourHigh Oil and Gas ResourceInternational Energy Agencyintegrated gasification combined cycleintegrated gasification combined cycle‒carboncapture and storageinvestor-owned utilityinvestment tax creditkilowattkilowatt-hourlevelized avoided cost of electricityLawrence Berkeley National Laboratorylevelized cost of electricityvThis report is available at no cost from the National Renewable Energy Laboratory (NREL) at www.nrel.gov/publications.
landfill gaslight water reactormarine and hydrokineticMid-Continent Independent System Operatormillion British thermal unitMidwest Reliability Organizationmunicipal solid wastemegawattmegawatt electricalmegawatt-hourNorth American Electric Reliability Corporationnatural gas combined cyclenatural gas combustion turbinenon-methane volatile organic compoundnitrogen oxidesNational Renewable Energy LaboratoryNortheast Power Coordinating CouncilNew York Independent System Operatoroperation and maintenanceOak Ridge National Laboratorypulverized coalplug-in electric vehiclePennsylvania, New Jersey, MarylandInterconnectionPower Marketing Administrationpower purchase agreementpumped storage hydroelectricproduction tax creditPublic Utilities Regulatory Policy Act of 1978photovoltaicspressurized water reactorQuadrennial Energy Reviewresearch and developmentReliabilityFirst Corporationresearch, development, demonstration, anddeploymentrenewable portfolio standardsRegional Transmission Organization/IndependentSystem OperatorSERC Reliability Corporationsmall modular reactorsulfur oxidesSouthwest Power Poolsteam turbinesynthesis gasTexas Reliability EntityviThis report is available at no cost from the National Renewable Energy Laboratory (NREL) at www.nrel.gov/publications.
TVATWhVERWECCWEOWWTPTennessee Valley Authorityterawatt-hourvariable energy resourceWestern Electricity Coordinating CouncilWorld Energy Outlookwaste water treatment plantviiThis report is available at no cost from the National Renewable Energy Laboratory (NREL) at www.nrel.gov/publications.
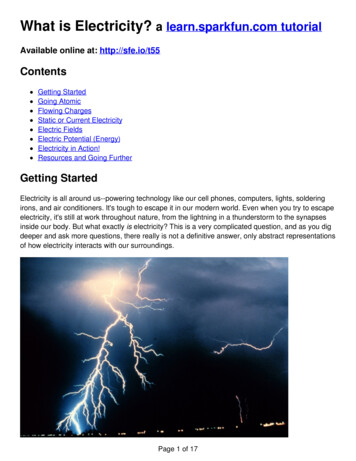
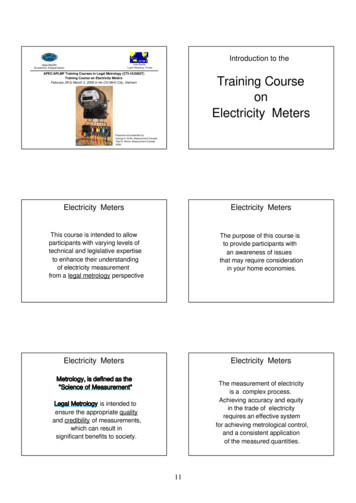
Executive SummaryThe share of electricity generation in the United States from different sources has arguablychanged more rapidly since 2007 than at any time since 1950. At least three trends are catalyzingthese changes: (1) the low price of natural gas; (2) the rise in renewable and distributedgeneration due to falling costs; and (3) recent Federal and State policies impacting generation.Understanding these trends and phenomena in the context of the history of generation, potentialfor additional generation, constraints, and comparative characteristics that drive generationinvestment is essential to identifying policies and measures that will facilitate the development ofa generation fleet that meets U.S. objectives for the 21st century. These objectives includereliability, resiliency, affordability, cleanliness, and climate goals as articulated by variousstakeholders including business as well as state and local governments.Figure ES-1. Net capacity additions (GW) by fuel type, 1950‒2015Capacity additions came in waves that were largely influenced by policy and technology. The 1930s and 1940sfostered the development of hydropower; nuclear power boomed in the 1960s and 1970s; natural gas additionspeaked in the 2000s; and non-hydro renewables have grown since 2005. Sources: EIA 1990 and EIA 2016 1.Set forth below are 15 key findings and supporting information derived from this report.viiiThis report is available at no cost from the National Renewable Energy Laboratory (NREL) at www.nrel.gov/publications.
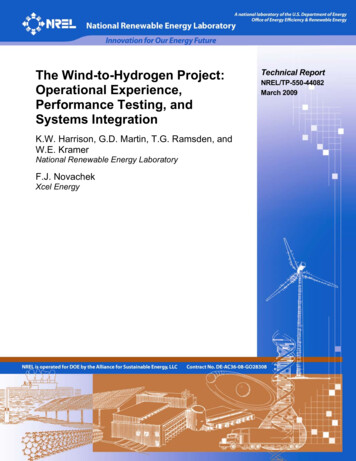
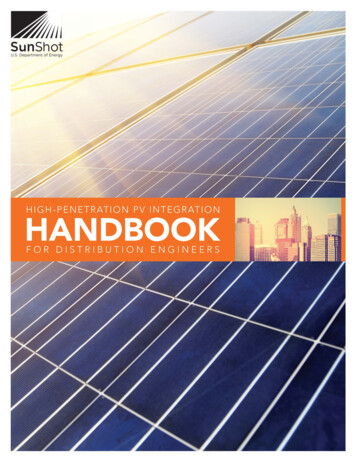
1. Diversity is a key attribute of electricity generation in the United States, but rather thanbeing the result of a deliberative, long-term national initiative, this diversity hasdeveloped through growth spurts of specific generation technologies at different times,often due to a confluence of policies, historic events, capital cost, fuel cost, andtechnological advancements 2.A. As shown in Figure ES-1, most generation sources have experienced eras ofsignificant capacity growth: hydro (1930‒1950, not shown); coal (1950-1985);nuclear (1960‒1980); natural gas (1990‒2010); and renewables (2005‒present).2. The national generation mix has transitioned over the past few decades, and continuingsignificant changes are projected. The U.S. generation fleet is transitioning from onedominated by centralized generators with high inertia and dispatchability to one that ismore hybridized, relying on a mixture of traditional, centralized generation and variableutility-scale and distributed renewable generation 3.A. From 2005 to 2015, the generation mix has changed significantly. In 2005, the topsix generation sources in descending order were coal, nuclear, gas, hydro,petroleum, and non-hydro renewables. By 2015, gas and coal were tied at the top,followed by nuclear, non-hydro renewables, hydro, and petroleum (Figure ES-2and Figure ES-3).2005Nuclear19%2015Non-hydro renewables 7%Non-hydro renewables 2%Hydropower 7%Hydropower 6%Nuclear19%Coal49%Naturalgas 19%Coal33%Natural gas33%Petroleum 1%Petroleum 3%Figure ES-2. Annual net generation from all sectorsNatural gas and non-hydro renewable generation grew from 2005 to 2015, while coal and petroleum generationdecline. Source: EIA 2016 4ixThis report is available at no cost from the National Renewable Energy Laboratory (NREL) at www.nrel.gov/publications.
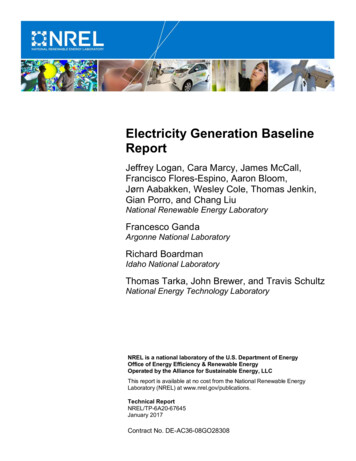
Figure ES-3. Annual generation from select technologies in the United States, 1950‒2015 (left),and generation from coal and natural gas (right-top) and non-hydro renewables (right-bottom),2008‒2015.Coal generation began to decline in 2007, and has largely been replaced by natural gas. Although solar i and windmake up a much smaller portion of total generation, these technologies have also seen significant growth since 2008.Sources: EIA 2016 5.3. Retail electricity prices have risen over time but have grown more slowly than prices forother essentials for quality of life (Figure ES-4). The costs of production, however, canvary significantly among generation sources.iNote that solar data started including generation from distributed PV resources in 2014.xThis report is available at no cost from the National Renewable Energy Laboratory (NREL) at www.nrel.gov/publications.
Figure ES-4. Comparison of electricity, natural gas, gasoline, medical care, and all commoditiesprices, 1970 – 2015 (1970 )Electricity prices have risen over time, but less in comparison to other commodities.6Source: EIA 2016 and BLS 20164. Ownership can be a factor in whether Federal and State policies drive capacity additionsbecause incentives and regulatory treatment vary depending on the type of ownership. Itshould be noted, however, that ownership itself is impacted by federal policy.A. Federal utilities are not subject to State law; municipally and cooperative-ownedutilities often receive different treatment than investor-owned utilities (IOUs) inFederal and State regulations, including eligibility for tax credits for solar andwind. As a result, these entities often use different financing mechanisms as well.B. Ownership impacts management, rate setting, financing, and tax status.C. The Federal Government owns 49% of hydropower capacity, but many of thehydropower dams are multipurpose.D. Examples of ownership created by Federal policy include The Tennessee ValleyAuthority Act of 1933 and the Public Utility Regulatory Policies Act.5. Regional generation mixes vary significantly from the national mix. Based on announcedadditions and retirements, there appears to be no trend toward declining regionalvariation 7.A. The Florida Reliability Coordinating Council (FRCC) and the Midwest ReliabilityOrganization (MRO) vary greatly from the national generation portfolio, withsignificant differences between them (Figure ES-5). In FRCC, 60% of generationxiThis report is available at no cost from the National Renewable Energy Laboratory (NREL) at www.nrel.gov/publications.
came from natural gas, 24% from coal, and 12% from nuclear in 2014. That sameyear, the MRO generated 60% of electricity from coal, 15% from wind, and 13%from nuclear. Nationally, the greatest contribution to the generation portfolio in2015 was from coal at 33%, a proportion significantly less than the largest sourcein these regions (Figure ES-2).B. The Western Electricity Coordinating Council (WECC) has the highest share ofrenewable capacity and generation among NERC regions. WECC has some of thehighest shares of hydro generation, at 22% (Figure ES-6). The region’s primaryfuel source is natural gas, which represented 30% of generation in 2014. WECChas the most diverse portfolio (measured by HH Index ii) at 0.22, with eightgeneration sources contributing 2% or greater to the portfolio. Nationally, the HHIndex of the generation portfolio is 0.26, where a lower number indicates a morediverse portfolio.C. The SERC Reliability Corporation (SERC) is the only region with new nuclearcapacity expected to come online in the near term (2016‒2020), with over 5gigawatts (GW) expected by roughly 2020 (Figure ES-7).Other Generation 1%Biomass 2%Petroleum 1%Nuclear12%Coal24%Wind15%Hydropower 5%Nuclear13%Natural Gas60%Coal60%Biomass 2%Natural Gas 5%Figure ES-5. Percentage of generation by fuel, 2014: FRCC (left); MRO (right)In FRCC, 60% of generation came from natural gas, while MRO generated 60% of electricity from coal. Nationally,the greatest contribution in 2014 was from coal at 39%, significantly less than the largest source in these regions.Source: SNL 2015 8.iiHH Index is a market concentration measure used by regulators such as the U.S. Department of Justice todetermine whether individual companies have a large enough market share to exert control over prices. It iscalculated as the sum of the squares of all of the markets shares of each company within a market.xiiThis report is available at no cost from the National Renewable Energy Laboratory (NREL) at www.nrel.gov/publications.
Figure ES-6. Percentage of generation by fuel in 2014 in the WECC regionIn 2014, WECC had the most diverse generation portfolio, with eight generation sources contributing 2% or greaterto the portfolio. Source: SNL 2015 9.20151050-52000200420082012201620202024-10Figure ES-7. SERC net capacity additions or retirements (GW) by fuel, 2000‒2024SERC is the only region the United States that has planned nuclear capacity additions. Historicaladditions/retirements as of 2014 are reported; future additions/retirements are announced. Source: SNL 2015 10.6. The forecasted shift in generation has positive and negative implications for greenhousegas (GHG) emissions because there are large variations in growth trends and GHGemissions among the generation sources 11.A. Nuclear power currently provides the largest share of GHG emission‒freeelectricity in the United States. In 2015, nuclear was providing 20% of U.S.electricity and 59% of its carbon-free electricity. However, more nuclear plantsare retiring than being constructed due to low prices in electricity markets andhigh capital costs.B. Hydroelectric power, another GHG emission‒free source of electricity, contributed6% of electricity generated in the United States in 2015 and is projected to haverelatively flat growth, despite significant potential for expansion.xiiiThis report is available at no cost from the National Renewable Energy Laboratory (NREL) at www.nrel.gov/publications.
C. Wind and solar generation—both GHG emission-free sources—are growingrapidly but still represented only about 6% of total generation as of 2015.D. Coal generation currently is responsible for the largest share of carbon dioxide(CO2) emissions from the electric power sector. Coal-fired capacity saw its lastnotable additions in 2010 as plants planned before the financial crisis of 2008came online. There were roughly 25 GW of coal retirements from 2012‒2014,and there were 13 GW of coal retirements in 2015. The coal units that wereretired in 2015 tended to be smaller and older (average age is 54 years, and therest of fleet that continues to operate has an average age of 38 years) 12.E. Natural gas generation has less than 50% of the burner-tip carbon emissionscompared to conventional coal generation. This has GHG implications forreplacing coal in the short run. Over the longer term, all emissions from naturalgas production and generation will become more important to consider givencarbon mitigation goals as articulated by various stakeholders, includingbusinesses as well as state and local governments.F. Natural gas and coal would need carbon capture and storage (CCS) to achievesignificantly lower GHG emissions, and the combined technologies needed toachieve CCS are in the first-of-its-kind deployment phase in the United States.7. There is significant variation among the states with regard to electricity imports andexports. Where sales to end users exceed generation, the state runs an electricity deficitand must import energy. Several states stand out as large net importers (measured ingigawatt-hours [GWh]): California, Virginia, Massachusetts, Tennessee, and Ohio.Massachusetts is particularly notable for its small size but large quantity of net imports.Proportional to its total end-use sales, Massachusetts exceeds any other state inpercentage of net imports. Idaho and Delaware, while not large net importers in terms oftotal energy, import high percentages of their total sales (Section 4.1).8. Changes in electricity markets, fleet composition, and usage patterns in recent years haveseen power plant operators and engineering, permitting, and construction vendors adaptboth coal and nuclear plants for more flexible operation. However, flexible operation cancome at a cost: reduced efficiency, higher marginal emissions, and increased wear andtear on the equipment, which increases maintenance costs 13.9. The national average capacity factor for the fleet of natural gas combined cycle (NGCC)plants has increased from approximately 40% in 2008 to over 55% in 2015, illustratingthe greater utilization of existing generation assets. The national average heat rate fornatural gas plants shows a significant decline (i.e., improved efficiency) since 2003;however, analysis shows the average heat rate for the fleet of NGCC plants has remainedsteady since 2007. For gas-fired combustion turbines (CTs), heat rate has declinedmodestly, and the overall decline is due to the increased deployment of NGCC plants,which are inherently more efficient than CTs 14.10. Wind and solar generation have recently been experiencing rapid growth due totechnological advances and reductions in cost, but their national market generation sharetotaled only 5.6% in 2015, and much of their projected growth is due to recently enactedtax credit extensions 15.xivThis report is available at no cost from the National Renewable Energy Laboratory (NREL) at www.nrel.gov/publications.
11. Although distributed solar accounted for less than 0.3% of the national generation mix in2015, it accounted for 31% of total photovoltaic (PV) generation, and in some states,such as California and Hawaii, deployment has been growing rapidly due to favorablemarket conditions and policies (see Figure ES-8).Figure ES-8. Distributed solar PV installed capacity (MW), top 10 states, as of September 2015California had more installed distributed PV capacity than the next six largest states as of September 2015.Source: EIA 2015 16.12. Wind generation represents the highest percentage of non-hydro renewables in thenational generation mix, and utility-scale wind represents the highest percentagecompared to utility-scale solar, distributed solar, and distributed wind 17.A. Wind generation increased from 18 terawatt-hours (TWh) in 2005 to 191 TWh in2015, a more than tenfold increase, but still only accounted for approximately4.7% of total net generation at the national level. At the end of 2015, windgeneration exceeded 15% of total in-state generation in eight states: Iowa, SouthDakota, Oklahoma, Kansas, North Dakota, Minnesota, Idaho, and Vermont. Theextension of the production tax credit (PTC), passed in December 2015, isexpected to further expand the deployment of wind energy in the United States.B. Distributed wind capacity (i.e., turbines of no more than 1 megawatt [MW])reached a cumulative capacity of almost 1 GW in 2015.13. Utility-scale solar and wind are experiencing substantial cost improvements and makinginroads against other utility-scale generation. While there are emerging opportunities toaddress variability, it can remain a significant challenge when shares of variablegeneration exceed a certain level 18.A. Utility-scale solar PV cost reductions have been significant, with organizationslike Lazard reporting a decline in levelized cost of electricity (LCOE) for utilityscale PV projects of 85% between 2009 and 2016 (right side of Figure ES-9).Wind generators have enjoyed similar cost reductions and technologyimprovements (left side of Figure ES-9), with Lazard estimating a 66% reductionin LCOE over the same time frame.xvThis report is available at no cost from the National Renewable Energy Laboratory (NREL) at www.nrel.gov/publications.
Figure ES-9. Change in U.S. LCOE for wind and PV, 2009–2016LCOE for wind and solar have decreased dramatically since 2009, which has increased their deployment across theUnited States. Source: Lazard 2016 19.14. While several low-GHG generation technologies have potential to contribute to the futuregeneration mix, barriers currently exist that could result in untapped resource potential,early closures, or unvalued grid services:A. As of May 2016, five new nuclear plants were under construction, while fourplants had retired before the end of their scheduled permitting lifetime and anadditional nine have announced that they will retire by 2020.B. Geothermal generators are dispatchable plants capable of providing valuableservices to the grid, such as generation flexibility. As more variable energyresources (VERs) are integrated to the electric system, the flexibility ofdispatchable capacity will grow in importance. The services a geothermal plantcan provide include regulation reserves, load following, spinning reserves,nonspinning reserves, and replacement or supplemental reserves. Currentancillary service compensation models in areas with the most geothermaldevelopment do not provide sufficient revenue to warrant the increasedoperational and control retrofitting expenses.C. Prior to 1980, geothermal generation remained below 5 TWh annually. Then,between 1980 and 1989, generation tripled to 15 TWh as new facilities cameonline. Much of the early growth in geothermal power was driven by PublicUtilities Regulatory Policy Act of 1978 (PURPA) incentives, although theinfluence of this policy has declined over time as the avoided costs of utilitygeneration have fallen (see Section 12, Figure 12-6). Challenges in exploring new‘blind’ hydrothermal resources and long drilling times for production wells haveled to increased uncertainty for investors in large geothermal projects.Additionally, expiration of tax credit horizons that do not allow enough time forxviThis report is available at no cost from the National Renewable Energy Laboratory (NREL) at www.nrel.gov/publications.
project development (e.g., commence construction clauses that do not take intoaccount the long lead time of geothermal project development), scarcity of powerpurchase agreement (PPA) opportunities, the need for transmission infrastructure,and low natural gas prices have likely contributed to modest growth in recentyears.D. Because the majority of hydropower facilities support multiple purposes such asrecreation, flood management, irrigation, navigation, and water supply,requirements for uses other than power generation—such as reservoir elevationrules upstream or dissolved oxygen or flow requirements downstream—canimpact when the plant is able to release or store water.E. An Oak Ridge National Laboratory (ORNL) report found that the technicalresource potential for new hydropower development was 65.5 GW of capacity,when excluding federally protected lands (see Section 8, Figure 8-5). AnotherORNL report found a technical resource potential of over 12 GW capacity at themore than 50,000 existing nonpowered dams in the United States (see Section 8,Figure 8-6).F. Hydropower provides a variety of ancillary services that are beneficial to theelectricity system. One example is output regulation and frequency response(including inertia), in which hydropower generators can quickly respond tosudden changes in system frequency. Other ancillary services include spinningand supplemental reserves enabled by high ramping capability, reactive powerand voltage support, and black start capability. There has been a renewed interestin the flexibility benefits that many hydropower projects can offer the grid giventhe growth in variable renewable sources like wind and solar. A recent reportnotes that about half of all installed hydropower capacity (39 GW) has highflexibility potential, and could play an important role in low-cost integration ofvariable renewable generators 20. Pumped storage hydroelectric (PSH) can also beused in peaking and balancing applications to maintain grid reliability in areaswith high penetrations of VERs.G. Over the next 10 years, existing U.S. Federal Energy Regulatory Commission(FERC) licenses will expire for nearly 250 hydropower plants, totaling more than16,000 MW of installed capacity. On average, it takes 8 to 10 years to relicense anexisting hydro project, with at least 5 years of pre-filing activity
The U.S. generation fleet is transitioning from one dominated by centralized generators with high inertia and dispatchability to one that is more hybridized, relying on a mixture of traditional, centralized generation and variable utility-scale and distributed renewable generation3. A. From 2005 to 2015, the generation mix has changed .