Transcription
GENDER EQUALITYHOW GLOBAL UNIVERSITIESARE PERFORMINGPART 1A partnership between
Contents123Executive summary3Analysis5n Introduction n Students n Research and academicsn University-wide policies and services23Case studiesn American University of Beirut, Lebanon n Amrita Vishwa Vidyapeetham, Indian University of Guadalajara, Mexico n Kenyatta University, Kenyan Trinity College Dublin, IrelandThis report is a joint collaboration between the UNESCO International Institute for HigherEducation in Latin America and the Caribbean (IESALC) and Times Higher Education.AcknowledgementsThank you to the followingpeople for their valuableinsights and contributions tothis report:Erika Loyo Beristáin, headof the Equality Unit at theUniversity of GuadalajaraEileen Drew, director of theTrinity Centre for GenderEquality and Leadership atTrinity College DublinKathryn Rebecca Maud,assistant professor ofwomen and gender studiesat the American Universityof BeirutBhavani Rao, director ofAMMACHI Labs at AmritaVishwa Vidyapeetham andthe UNESCO Chair in GenderEquality & Women’sEmpowermentJudith Waudo, director ofthe Center for Gender Equityand Empowerment atKenyatta UniversityEditorEllie Bothwell, rankings editor, THEAuthorsEllie Bothwell, rankings editor, THEJaime Félix Roser Chinchilla, juniorpolicy analyst, UNESCO-IESALCEmma Deraze, senior data scientist, THERosa Ellis, rankings reporter, THEVictoria Galán-Muros, chief of researchand analysis, UNESCO-IESALCGenesis Gallegos, junior policyanalyst, UNESCO-IESALCTakudzwa Mutize, junior policyanalyst, UNESCO-IESALCSub-editorIngrid Curl, associate editor, THEArt editorDan Sinclair, art editor, THEData sourceTHE Impact Rankings 2021Published in 2022 by Times Higher Education and the UNESCO International Institute of Higher Education in Latin America and the Caribbean (IESALC).This publication is available in Open Access under the Attribution-ShareAlike 3.0 IGO (CC-BY-SA 3.0 IGO) 3.0/igo/). By using the content of this publication, the users accept to be bound bythe terms of use of the UNESCO Open Access Repository a-en).The designations employed and the presentation of material throughout this publication do not imply the expression of any opinion whatsoever on the partof UNESCO concerning the legal status of any country, territory, city or area or of its authorities, or concerning the delimitation of its frontiers or boundaries.The ideas and opinions expressed in this publication are those of the authors; they are not necessarily those of UNESCO and do not commit the organisation.THE Report: Gender Equality: How Global Universities are Performing, March 20222
Executive summary1Gender equality has come a long way since International Women’s Day wasfounded 111 years ago. There are more women with access to education,and in senior leadership positions, and there is greater equality in civil andpolitical rights.But there is still far to go. Women and girls continue to suffer discriminationand violence. Women earn, on average, lower salaries than men and they areoften still not present in equal numbers in business or politics. In manylower-income countries and in rural areas, women still have lower levels ofaccess to education than men.The Covid-19 pandemic has both shone a spotlight on these inequalitiesand raised new barriers for girls and women, leading to concerns thatmost of the equity gains of recent years could be lost if there is notsufficient intervention.In this context, this report examines how well higher education institutionsacross the globe are performing when it comes to making progress towardsgender equality, with worldwide and country-level analysis on 18 differentindicators and detailed case studies from five universities that are leading onthis work in their regions.Universities hold a unique position in society that makes them criticalactors for change in this area.Through the education they provide, they can ensure that female studentshave equal chances when it comes to application, admission and completionrates; they can teach curricula where women are equally represented; andthey can educate students on gender equity.Through their research, they can expose the ways in which girls andwomen are discriminated against and they can ensure that datasets includethe perspectives of women.As organisations, they can ensure that female staff have equality when itcomes to recruitment, promotion, pay, funding and workload and that womenhave mentors and role models.And as pillars of their communities, they can help address gender inequality in wider society by engaging in outreach projects that support women witheducation, employment and empowerment.THE Report: Gender Equality: How Global Universities are Performing, March 20223
The report finds that: Universities in Oceania are furthest ahead in their commitment to genderequality Female students outnumber male students globally, particularly inmedicine and arts, humanities and social sciences (AHSS), but there arestill fewer women in science, technology, engineering and mathematics(STEM) Several Asian countries have high proportions of women in STEM subjects,and a higher share of women enrolled in a STEM degree than in AHSS African universities are the most equal when it comes to the shares offemale students across different subject areas Globally, universities are more focused on measuring women’s access tohigher education (about four in five universities track male and femaleapplication rates separately) than tracking their outcomes and successrates (less than two-thirds of them track women’s graduation rates andhave plans aimed at closing the gap) Less than two-fifths of senior academics are women globally, while lessthan a third of authors in research papers are women Most universities claim that they have various policies and services thatsupport women’s progress, but the share able to supply relevant evidencewas far lower. This suggests that many institutions are not beingtransparent about their progress towards gender equality and thatuniversity communities may be unaware of the existence of gender-equalpolicies or the availability of services aimed at supporting women Besides basic disaggregated data-gathering, common gender-relatedpolicies that universities reported include non-discrimination againstwomen (89 per cent), protection for those reporting discrimination (86 percent), tracking application, acceptance and completion rates for women(83 per cent) and women’s access schemes (81 per cent) Nine out of 10 universities support work-life conciliation for their staff andfaculty by adopting maternity and paternity policies, and seven out of 10have childcare facilities accessible for employees. Fewer universities(59 per cent) have these facilities also accessible for students Transgender rights are a new frontier in the fight for gender equality, withpolicies of non-discrimination against transgender people existing in 70 percent of reporting universities globally, but completely missing in severalcountries. Leading universities are going beyond non-discrimination and taking anactive role in the prevention and sanction of violence and harassmentagainst women, as well as in engaging with their communities for thepromotion of gender equity beyond the boundaries of their campuses.A second report on this topic will be published in May 2022, includinga literature review, more recent data, more in-depth analysis andrecommendations for universities.THE Report: Gender Equality: How Global Universities are Performing, March 20224
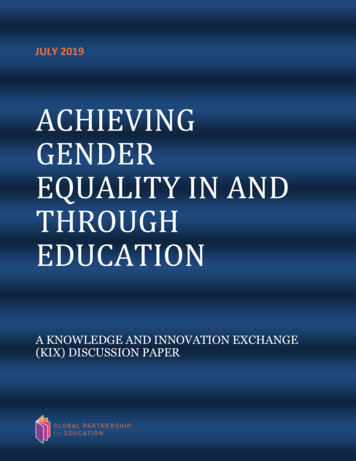
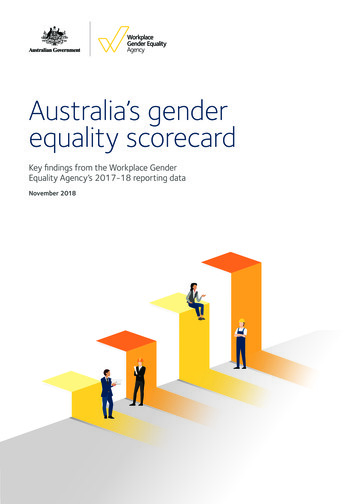
AnalysisINTRODUCTIONIn many ways, universities have been a positive force in the journey towardsgender equality. Academic research has exposed the ways in which girls andwomen are discriminated against, while the increasing enrolment and recruitment of female students and staff have led to more women in positions ofpower and more women with agency over their lives.But universities also have a wider role to drive forward gender equality intheir communities.As campaigners fight to ensure that progress on gender equality does notmove backwards, how is the higher education sector performing? Is it settinga leading example for other industries in terms of the recruitment of womenand the policies and services in place to tackle inequality and discrimination?Many countries have data on the number of female students and universitystaff. But information on universities’ own policies and services is much rarer.International comparisons also remain difficult.This is where Times Higher Education’s impact indicators can help to givea glimpse of the wider picture. These indicators are designed to assess howuniversities are tackling the global problems described in the United Nations’Sustainable Development Goals (SDGs).The institutional data for these impact indicators are provided directly byuniversities, which opt in to take part in the exercise. They can submit data onas many of the SDGs as they are able. The voluntary effort required in gathering and providing the data already suggests that they are committed to takingaction to achieve sustainable development in those areas.Several of the 17 SDGs incorporate elements that relate to gender equality,but SDG 5 – “achieving gender equality and empowering all women and girls”– explicitly addresses the issue. Although universities have opted to implementa range of policies, structures and activities in relation to SDG 5, the impact indicators are the only proxies to date that demonstrate universities’ contributionsto SDG 5 at a global scale. In total, 776 institutions provided data on their contributions to SDG 5 in 2021, out of more than 1,200 institutions participating overall, making it the fourth most popular SDG globally and also within most regionsin terms of participation. SDG 17 (partnerships for the goals) was the most popular SDG for methodological reasons, followed by SDG 4 (quality education) and2.1776institutions provideddata on theircontributions toSDG 5 in 2021THE Report: Gender Equality: How Global Universities are Performing, March 20225
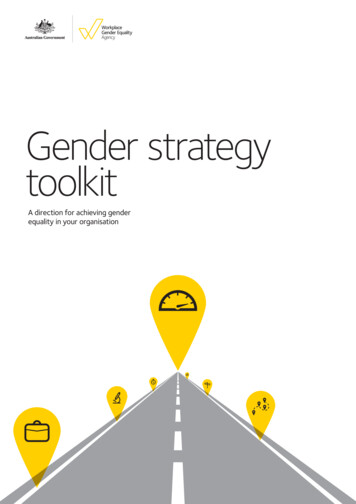
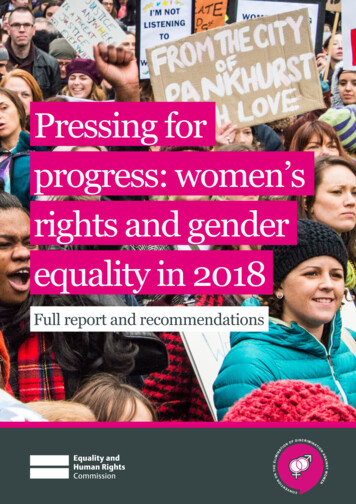
SDG 3 (good health and well-being). However, in Oceania, SDG 5 is the fifthmost-represented goal, whereas in South America it is sixth. In all other regions,it is fourth. Although these 776 universities represent a fraction of all highereducation institutions worldwide, they hail from 87 different countries or territories, and 26 of those have at least 10 institutions participating, providing a usefulinternational snapshot of how the sector is performing.Participation per SDG (N)W Figure 1. Number ofuniversities providingdata for each SDGSDG 6SDG 7SDG 8SDG 9SDG 10SDG 11SDG 12SDG 13SDG 14SDG 15SDG 16SDG 17SDG13SDG14SDG15SDG16SDG17SDG 5SDG12SDG 4SDG11SDG 3SDG10SDG5SDG9SDG4SDG8SDG3SDG7SDG2SDG6SDG100SDG 2500500SDG 1N universitiesNumberof universities1,0001000For SDG 5, each university participating was scored across six different areas,which address how universities are providing access to women and supportingtheir academic progression: research, including bibliometric indicators onresearch into gender equality, as well as the share of authors in research paperswho are women; the share of first-generation female students; measuresaddressing female student access; the share of senior female academics; theshare of women receiving degrees; and measures of women’s progress.SDG 5 explicitly focuses on supporting and uplifting women and girls, but ithas implications for achieving all SDGs, including quality education (SDG 4). Wecannot hope to develop world sustainability if the needs of more than half of ourpopulation are not addressed. In this spirit, the SDG 5 impact indicators rewardhigher shares of female students and academics (rather than rewarding parity).This method was selected based on the rationale that the long history of discrimination against and underrepresentation of women needs to be overcome withadditional counterbalancing efforts beyond the ideal balanced gender ratio.Issues relating to men being underrepresented in certain disciplines are coveredby SDG 10 (reduced inequalities), which is beyond the scope of this report.Significant limitations in the availability of comprehensive disaggregatedglobal data prevent us from taking a non-binary view of gender equality thatcovers the full spectrum of gender identities. Therefore, the analysis focuseson disparities between women and men.While performance across the world, and within nations, varied, the followingmap suggests that Sweden, Australia, New Zealand and South Africa had thehighest scores on SDG 5 (in descending order). However, the score for someTHE Report: Gender Equality: How Global Universities are Performing, March 20226
nations may be skewed if only a small number of universities from a countryvolunteered to participate; Sweden, for instance, has only one institution.The countries with the highest average overall scores and at least 10 participating institutions are (in descending order of score): Australia, the UK,Canada, Spain and the US. Those tend to be nations with abundant availabledocumentation of their activities in the area of gender equality, often in lineveragewithSDG5score perrequirementsfromcountrytheir respective governments.W Figure 2. AverageSDG 5 score per countryAverage SDG5 score per 40303040Source:30Times Higher EducationTurkeyPakistanIndiaRussian kistanIraqJapanAverageSDG 5 5.744.8Number gionAverageSDG 5 scoreAustraliaUnited KingdomCanadaSpainUnited ilandMexicoNumber ofinstitutionsCountry/regionWhile the average scores provide a useful overview of overall pockets ofexcellence in gender equality, in this report we will be drilling into performancein three areas: students, research and academics, and university-wide policiesand services. Country-level analysis will be restricted to the following 26countries or territories where at least 10 institutions submitted data on SDG .938.538.134.433.231.427.025.2W Figure 3. Countries/regions where atleast 10 institutionssubmitted dataon SDG 5Note: The maximum possibleaverage score is 100THE Report: Gender Equality: How Global Universities are Performing, March 20227
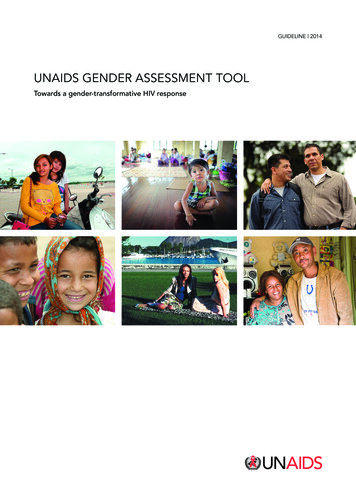
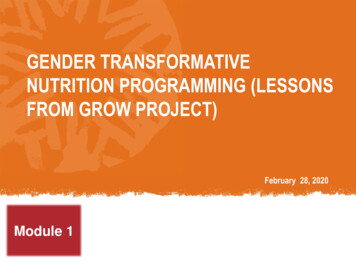
2.2STUDENTSEight of the 18 indicators measuring impact on SDG 5 relate to the studentpopulation. Two of these are quantitative: the proportion of women receivingdegrees and the proportion of first-generation female students. The remaining indicators are based on evidence of institution-level policies and initiatives. We ask whether universities track application, acceptance andcompletion rates for female students, and whether they have a policy toaddress these rates; whether there is provision of appropriate women’saccess schemes, such as mentoring or scholarships; whether universitiesencourage applications by women in subjects where they are underrepresented; whether there are women’s mentoring schemes in which atleast 10 per cent of female students participate; and whether universitiestrack women’s graduation rate compared with men’s and, if so, whether thereis a scheme in place to close any gap. The evidence is provided directly byuniversities but evaluated and scored by THE.W Figure 4. Globalresults for studentrelated indicators% of institutions that:% of:IndicatorAverage %Women receiving degrees54First-generation female students37Track application, acceptance and completion rates for female students83Have a policy to address application, acceptance, entry and69participation rates for female studentsHave women’s access schemes, such as mentoring or scholarships81Encourage applications by women in subjects where they are78underrepresentedHave women’s mentoring schemes in which at least6910 per cent of female students participateTrack women’s graduation rate compared with men’s and scheme to64close gapTHE Report: Gender Equality: How Global Universities are Performing, March 20228
For each qualitativeindicator in SDG 5, inaddition to askinguniversities whether ornot they provide theservice or fulfil thecondition, we ask them toprovide evidence of theiractivity in the form of adocument.Extra points are awardedin the scoring if thedocument is publiclyaccessible; this is importantbecause it enables theuniversity community andgeneral public to, in thecase of policies, hold theinstitution accountablefor their commitments,and in the case of services,be aware of what isoffered so they canaccess it. When we askabout the evidence of apolicy, we also assesswhether the policy isrecent (created or reviewedin the last five years); ifit is, we award an extrapoint.One caveat to theevidence-based datafor SDG 5 is that universitiesin English-speakingcountries tend to bemore likely to submitevidence; they provideevidence in 75 per centof cases versus 38 per centfor other nations.But as long as this isborne in mind whenanalysing the data bygeography, the resultsstill give interesting insightsinto the performance ofuniversities.Student-related SDG 5 scores per regionW How do we evaluateevidence?2.2.1Looking at the data breakdown by world region, as shown in Figure 5,Oceania (made up of 19 institutions in Australia and six in New Zealand forSDG 5) appears to be the furthest ahead based on institutions’ averagescores across all of the student-related indicators; its median score is arounddouble that of Africa, Asia, Europe and South America.indicatorsNorth America also achievesStudenta relativelystrong performance, with themajority of its institutions gaininga scoreof over50 out of 100.averagescoresby regionW Figure 5. Distribution ofscores per region forstudent-relatedindicators1001008075Note: The boxplots show the distributionof scores, with the middle line in eachbox representing the median score andthe ends of the whiskers showing themaximum and minimum scores, excludingany outliers. Outliers are represented bythe dots located outside the rth AmericaNorth AmericaNorth AmericaOceaniaOceaniaOceaniaSouth AmericaSouthTHE Report: Gender Equality: How Global Universities are Performing, March 20229
Share of female students receiving degrees overall and by field of study2.2.2Across the 776 institutions participating in SDG 5, 54 per cent of studentsawarded a degree in 2019 were female. One might assume that this meanswomen have gained true equality, at least in terms of representation.However, subject-level data tell a different story; on average, the share offemale students drops to 41 per cent for STEM subjects and rises to 66 percent for medicine and 61 per cent for arts, humanities and social sciences.The increasing number of female students at the overall enrolment level mayalso perversely reflect gender equality issues in broader society, includingthe fact that the gap between the average earnings of people who do and donot go to university is larger for women than for men, as well as other factors,such as that female-dominated careers such as nursing and teaching nowrequire a degree. Meanwhile, there are regions, such as many parts of theMiddle East, where traditionally women have been largely excluded from theworkforce; in these cases, there might be greater incentive for women totransition to university after school. Experts on this topic have also previouslyhighlighted that there is a “premium” placed on “the educated housewife” inthe Middle East.Africa is the continent with the least disparity between the proportion offemale graduates in the three subject areas, while Oceania shows thegreatest differences, with almost twice the share of women graduating frommedicine as STEM subjects (see Figure 6).ContinentAfricaAsiaEuropeNorth AmericaOceaniaSouth AmericaNumber ofuniversities49341231662564STEM (%)474142393841Medicine (%)606469737565Arts,Humanities,Social sciences(%)606063596260W Figure 6. Share ofwomen receivingdegrees per field ofstudy, per regionHowever, the six countries with the highest proportion of women in STEMare all in Asia, and in three of these nations this amounts to more than 50 percent: Thailand, Iran and Uzbekistan.THE Report: Gender Equality: How Global Universities are Performing, March 202210
W Figure 7. Countries withhighest share of womenreceiving degrees inSTEM qPakistanSpainBrazilRussian FederationIndonesia% women in STEM54.451.450.449.347.647.146.245.344.844.7Note: Only includes countries where atleast 10 institutions submitted dataThe data also allow us to determine, at the level of each institution, the splitbetween female graduates who followed a STEM degree versus an arts,humanities or social sciences (AHSS) degree. We have excluded medicinefrom the analysis in this case because it is not taught by all institutions.Among all female graduates at the 776 participating institutions in 2019,54 per cent undertook a degree in AHSS, compared with 30 per cent inSTEM. As a result, the average “humanities bias” – the difference betweenthe share of female graduates in AHSS versus in STEM – is 24 percentagepoints. Countries with the highest average “humanities bias” are (in descending order) Spain, Italy, the UK, Australia and Portugal. However, more than afifth of institutions – 171 in total – have a negative “humanities bias”, meaningthat a larger share of their female graduates was enrolled in a STEM degree,rather than one in AHSS. Six countries have, on average, a STEM bias: India,Iran, Pakistan, Uzbekistan, Indonesia and Thailand. India shows a particularlylarge STEM bias of 25 percentage points on average.This appears to back up previous research which has found that women incountries with low levels of gender equality overall are more likely than thosein more equal countries to gain STEM degrees. One potential explanation isthat the value of a STEM degree is higher in less developed countries.THE Report: Gender Equality: How Global Universities are Performing, March 202211
First-generation female students2.2.3Universities participating in SDG 5 are also asked to disclose the proportion offemale students who identify as being the first person in their immediate family toattend university. This shows the extent to which universities are supportingdisadvantaged female students, although national policies and economic environments may have an impact on this figure too. The average share across allparticipating institutions is 37 per cent, rising to 41 per cent at European universities and dropping to 26 per cent in North America. The countries with the highest average percentage of first-generation female students are Spain and Iraq,where the majority of female students identify as first-generation. However, somestudies have found that girls in low-income and rural areas have been particularlyvulnerable to missing out on education during the pandemic; this may have aknock-on effect on the share of first-generation female students enrolling inuniversity in future years in some parts of the world.ContinentAfricaAsiaEuropeNorth AmericaOceaniaSouth AmericaCountrySpainIraqBrazilPakistanIranAverage share offirst-generation femalestudents (%)363941264040Average share offirst-generation femalestudents (%)5551454343W Figure 8. Average shareof female studentswho identify as firstgeneration, per regionW Figure 9. Countrieswith the highest shareof female studentswho identify asfirst generationNote: Only includes countries where atleast 10 institutions submitted dataTHE Report: Gender Equality: How Global Universities are Performing, March 202212
University policies and services on access and women’s progress3003003002.2.4When it comes to the indicators on universities’ policies and services, themajority of institutions initially declare that they do have these measures ofaccess and women’s progress. But the proportion of universities able tosupply relevant documentation is often lower (see Figure 10). The questionswhere the fewest institutions shared relevant evidence are those regardingthe tracking of women’s graduation rate and the existence of women’smentoring schemes for existing students (in which at least 10 per cent of400500600700800female students participate); the latter are only provided by 59 per cent of400and less than500700 While almost800universitiesa third of those600provided evidence.400500600700800two-thirds (64 per cent) of institutions say they are tracking women’s graduation rates compared with men’s, less than half of those (37 per cent)provided evidence and, of those that did provide evidence, it was sufficientlydetailed and relevant in only 42 per cent of cases. The policies and serviceswhere the most institutions provided evidence were around tracking application, acceptance and completion rates for female students and providingappropriate women’s accessschemes,suchas mentoringor scholarships, forResponsesandevidenceprovisionprospective students.W Figure 10. Existencespecificofuniversity policiesprovided genericandservices on accessyes not providedandno women’s progress(student-relatedindicators only)Track women’s graduation rateentoringschemesWomen’s mentoring schemesplicationsubjectEncourage applications by women in underrepresented subjectsaccessschemesWomen’s access schemeslicationspolicyPolicy to address application, acceptance and participation rates for womenaccesstrackingTrack application, acceptance and completion rates for womenIndicatorw. gradtracking100200300400500esponsesand 200evidenceprovision00100300400500ResponsesNumber of universitiesesponses and evidenceprovisionesponses and evidence provision600600noyes not providednopolicy, but noHavenoprovided genericrelevantevidenceyes not providedprovidedyes not providedspecificprovided genericHavepolicy, providedprovided genericspecificgenericevidencespecificDo not have policyHave policy, providedspecific evidence700700800800However, there are significant regional variations for some of theindicators. In some countries, a large percentage of institutions say theyrun the programme or have the policy asked about, while in others veryfew do.The indicator with the highest variance across countries is the tracking(and comparing) of women’s graduation rate; just 29 per cent of Japaneseinstitutions do this, compared with 91 per cent of UK ones.The indicator with the least geographical variance is the tracking of femalestudents’ application, acceptance and completion rates, with countryTHE Report: Gender Equality: How Global Universities are Performing, March 202213
averages ranging from 63 per cent of institutions in Brazil to 100 per cent inChile, Egypt and Uzbekistan.Average % of "yes" by ionubjectoringemesgradckingTrack application, acceptance and completion rates for womenPolicy to address application, acceptance, entry and participation rates for womenWomen’s access schemesW Figure 11. Share ofinstitutions per countrywith policies andservices on access andwomen’s progressNote: Each dot represents a differentcountry. The level of geographicalvariation for each indicator wasmeasured by looking at the averagepercentage of institutions per countrythat answered “yes” to the questionand then calculating the standarddeviation of those per-country scores.Encourage applications by women in underrepresented subjectsWomen’s mentoring schemesTrack women’s graduation rate3030%4040%5050%607070%Percentage of universities60%8080%9090%100100%This discrepancy between two similar indicators – the tracking of femalestudents’ application, acceptance and completion rates and the tracking(and comparing) of women’s graduation rate – highlights a thorny and wellresearched issue in the subject of gender equality, and equality morebroadly: improving access is, of course, necessary but not sufficient in itself,and in the absence of schemes designed to ensure that targeted demographics (such as women) have comparable success rates and outcomes asothers, improving access cannot fully solve the problem. While there is broadworldwide consensus on the necessity of ensuring equal access to femalestudents (83 per cent of all institutions have a policy on this), monitoring thesuccess of those female students is only done by 64 per cent of institutions.Some regional variations in the data also raise questions about thesuitability – and the potential limitations – of a global framework for measuring gender equality and whether some indicators are more or less relevant indifferent local contexts. For example, in Europe, just 48 per cent of institutionssay they run women’s mentoring schemes (compared with a global averageof 59 per cent). Many European countries perform well overall for genderequality, so it could be that in those nations women’s mentoring schemes areseen as less necessary than they are in other regions of the world. However,it is important that countries that have achieved strong progress towardsgender equality do not become complacent; there is still a lot more work tobe done, as highlighted in the next section of the report on research andacademics.THE Report: Gender Equality: How Global Universities are Performing, March 202214
2.3RESEARCH AND ACADEMICSThe SDG 5 impact indicators also include four measures that relate to researchand the academic population: the proportion of authors who are women; thenumber of publications on gender equality; the proportion of papers on genderequality in the top 10 per cent of journals as defined by Citescore; and theproportion of senior female academics. These indicators help us explore whetherfemale academics are given the same opport
Art editor Dan Sinclair, art editor, THE Data source THE Impact Rankings 2021 Published in 2022 by Times Higher Education and the UNESCO International Institute of Higher Education in Latin America and the Caribbean (IESALC). This publication is available in Open Access under the Attribution-ShareAlike 3.0 IGO (CC-BY-SA 3.0 IGO) licence