Transcription
12345678A systematic study on the use of short circuiting for the improvement of protonexchange membrane fuel cell performanceGaurav Gupta1,*, Billy Wu2, Simon Mylius3and Gregory J. Offer1Abstract9Proton exchange membrane fuel cells suffer from reversible performance loss during operation10caused by the oxidation of the Pt catalyst which in turn reduces the electrochemically active11surface area. Many fuel cell manufacturers recommend using short circuiting during the12operation of the fuel cell to improve the performance of the cells over time. However, there is13lack of understanding on how it improves the performance as well as on how to optimise the14short circuiting strategy for different fuel cell systems. We present a simple procedure to15develop an optimised short circuiting strategy by maximising the cumulative average power16density gain and minimising the time required to recover the energy loss during short circuiting.17We obtained average voltage improvement from 10 to 12 % at different current densities for18commercial H-100 system and our short circuiting strategy showed 2 % voltage improvement19in comparison to a commercial strategy. We also demonstrated that the minimum short20circuiting time is a function of double layer capacitance by the use of electrochemical21impedance spectroscopy.222324Keywords: Proton exchange membrane fuel cells, short circuit, Pt oxidation, degradation1Department of Mechanical Engineering, Imperial College London, UK2Dyson School of Engineering, Imperial College London, UK3Arcola Energy, London, UK*Corresponding authorDr. Gaurav GuptaDepartment of Mechanical Engineering,Imperial College London,South KensingtonUK- SW7 2AZEmail: g.gupta@imperial.ac.uk1
123Introduction4commercialisation has still yet to be achieved. The major factors that are hindering this are the5low cathodic catalytic activity, lower lifetime of the fuel cells and use of expensive Pt as6catalyst which makes it more expensive to compete in the current market [1-3]. A lot of7research has been focussed on discovering new catalyst materials ranging from Pt based alloys8to non Pt based alloys to improve the catalytic activity, lower the use of Pt to reduce the cost9of the system while at the same time trying to improve the lifetime of the fuel cell [4-13].10However, one of the major factors which is often overlooked is the performance loss of the11fuel cell during operation. This can increase the cost of the system as the system has to be12oversized to accommodate the performance loss. One cause of this performance loss is due to13the formation of oxide layers on the platinum (Pt) catalyst which reduces the current density at14a given potential. The oxidation of Pt occurs as a natural intermediate in the oxygen reduction15reaction (ORR) and hence cannot be avoided entirely, as it is why platinum is such a good fuel16cell catalyst. The reactions can be summarised below, although it should be noted there is a17wealth of detail and some controversy in the academic literature [2, 3, 13-16] as to the exact18reaction pathway in practice:19Adsorption2𝑃𝑡 𝑂2 𝑃𝑡2 𝑂2(1)20Dissociation𝑃𝑡2 𝑂2 2𝑃𝑡𝑂(2)21Reduction 1𝑃𝑡𝑂 𝐻 𝑒 𝑃𝑡𝑂𝐻22Reduction 2𝑃𝑡𝑂𝐻 𝐻 𝑒 𝑃𝑡𝐻2 𝑂 Eo 0.85-1.1 V vs SHE (4)23Desorption𝑃𝑡𝐻2 𝑂 𝑃𝑡 𝐻2 𝑂Proton exchange membrane fuel cells have been present for many decades however large scaleEo 1.1-1.4 V vs SHE (3)(5)24Each of the electrochemical reactions, (3) and (4) have an equilibrium potential, and so25there will be an equilibrium coverage of species on the surface that is a function of the operating26cathode potential. Hence at different potentials there are different equilibrium concentrations2
1of species, meaning that there are more or less free sites available for oxygen to adsorb on the2platinum (i.e. reaction (1)). Thus, the reaction intermediates can also be considered poisons to3the reaction, as if their concentration builds up too high they can limit the current density at a4given potential. Fortunately, because all the species adsorbed on the surface are in dynamic5equilibrium with each other, the equilibrium concentration for a given potential takes time to6be established, and therefore, it is possible to achieve a time averaged concentration of7intermediate species that is different from the equilibrium concentration for a given potential,8by periodic perturbation of the system (i.e. short circuiting).9There are various reports which highlight the formation of H2O2 as an intermediate10during the oxygen reduction reaction [2, 3, 13, 17, 18]. This H2O2 formation not only reduces11the efficiency of the fuel cell system but also accelerates degradation of the Nafion membrane12by the formation of free radicals [14, 17-22]. It may be possible to avoid the formation of the13peroxides if the average coverage of OH can be reduced by short circuiting, thereby reducing14the degradation due to low voltage idling conditions.15There are a very limited number of publications on the use of short circuiting as a16method to improve the performance of fuel cell systems. In early 2000, a patent by Fuglevand17et. al [23] was published on the use of short circuiting with fuel cells for the performance18improvement of the system and they attributed this performance increase to the increase in19proton conductivity of the membrane because of two reasons : 1) more water production and202) increase in temperature to evaporate water and increase air flow to the cathode. Koschany21et.al [24] also recommended the use of short circuiting to improve the performance of the fuel22cell by maintaining the water content. In contrast Pearson et.al [25, 26] secured a patent on the23method and apparatus for improving the performance of fuel cells by periodically short24circuiting. They believed the performance improvement was due to the stripping of oxides and25other adsorbed species from Pt. This patent led to the commercialisation of a short circuiting3
1controller by Ballard systems with their fuel cell stacks. Other fuel cell system suppliers, such2as Horizon fuel cells, also use a short circuiting controller which does a short circuit for 1003ms every 10 s of operation but does not vary with the condition of the stack. Some studies on4the use of short circuiting has been reported by researchers in academia as well where Kim5et.al [27] used this technique to humidify the stack for unmanned aerial vehicle and Zhan et.al6[28] reported improvement in performance and lifetime for use of fuel cell in hybrid7applications. Both studies reported the production of excess water during the short circuiting8as the reason for performance improvement and also the moisture evaporation from the GDL.9Despite the fact that it works, there is still a lack of clear evidence for the mechanism for10improving the performance and there are two competing theories. There is also no published11strategy on how frequently and how long the short circuiting should be done.12Examining the two theories for why short circuiting improves performance, it is easy13to quickly discard the water/thermal management theory. Consider that a typical short circuit14period might be 100 ms every 10 s, and that during the short circuit the current and therefore15amount of water produced during this time might double. However, the time during short16circuit represents only 1% of the total operating time. Thus only 1% more water in total will17be produced by the short circuit. We consider this to be highly unlikely to have a significant18effect on the water management of the fuel cell system, except perhaps the local concentration19of water in the catalyst layer. Secondly the argument that short-circuiting will increase the20temperature and hence evaporate water and increase air flow to the cathode, can also be21discarded. Consider that during the short circuit, the system runs at 0 V, and so it is true that22all energy generated will be dissipated as heat internally. This could indeed lead to a sudden23increase in temperature at localised points which could evaporate water at those points.24However, again the short circuit represents only 1% of the total operating time. In addition, the25purpose of the short circuit is that the average voltage increases, and hence the efficiency of4
1the fuel cell increases and the heat generated during the remaining 99% of the time is less. This2means less total heat overall will be produced, and thus the stack should be cooler, which could3increase the risk of flooding. Therefore by Occam’s razor [29, 30] we assume that the oxide4stripping mechanism, as the simplest theory , is correct.5It is very important to understand the relationship between the kinetics and6thermodynamics of oxide formation in order to predict the mechanism of oxide removal. Pt7oxidation is severe at the higher potentials and thus should need more frequent short circuiting8and less at lower potentials. The short circuiting time will depend on the discharging of the9double layer capacitance and thus the minimum short circuiting time should exceed the time10needed to discharge the double layer, but not too long to cause fuel or air starvation, and thus11there should be an optimum time depending on the performance enhancement as well as12application. There has been a recent study by Rinaldo et. al [31] wherein the relationship13between kinetics and thermodynamics of oxide formation and reduction was studied using14cyclic voltammetry. They used a potentiodynamic model to study the different stages of oxide15formation and reduction by including reaction rates that are dependent on the species and16adsorption energies. They were able to model the behaviour of Pt (111) and predict the17irreversibility of the CV and relate it to the two-site non-electrochemical surface reaction taking18place at high potential. However, the model was only validated for the Pt (111) surface and19failed to predict the behaviour in case of polycrystalline Pt which is normally the catalyst used20in fuel cell.21In summary the short circuiting method has been well known to industry for many years22and even commercialised by Ballard and Horizon, however there is a lack of understanding on23how it actually improves the performance. There have also been no studies on how to optimise24a short circuiting strategy for different fuel cell systems. This paper presents an experimental5
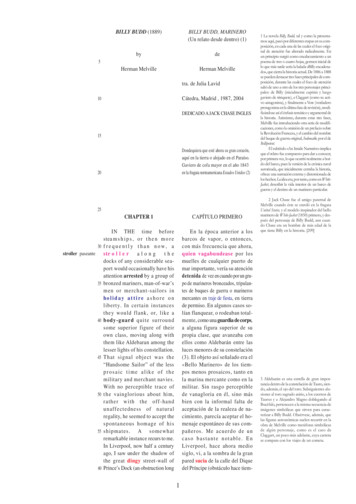
1study of the technique, and also the development of a methodology to establish the optimum2short-circuiting strategy for any system.3456Experimental MethodsThe short circuiting strategy was developed by testing on a 2 cell setup made from self-7humidifying cells provided by Arcola Energy. It is a closed cathode system with an active area8of 144 cm2, 3 channel serpentine and parallel flow channels were used for the anode and9cathode respectively. Stoichiometry of 1.3 and 3 were used for H2 and Air, respectively. None10of the gases were humidified and the relative humidity of H2 and air were 0 % and 10-15 %,11respectively. A simple block diagram for the test setup is given in Figure 1(a). The load bank12used was Scribner 850 e and Labview was used to control the short circuiting. The switching13between normal operation and short circuiting was done with the help of two switches shown14in block diagram as load switch (LS) and short circuit (SC). For normal operation of the fuel15cell, LS is closed while SC is open and to induce a short circuit first the LS switch is opened16and SC is closed. Cell voltage and current during short circuit was monitored using a National17Instruments (NI) compactRIO (cRIO) at 1 kHz with a 12 bit 10V analog input module. The18testing was done at 69.4 mA/cm2 (25 C), 138.9 mA/cm2 (30 C) and 277.8 mA/cm2 (50 C)19for different short circuiting times of 10 ms, 50 ms, 100 ms, 200 ms and 500 ms to find the20short circuiting interval which will give the maximum increase in the performance i.e. higher21cell voltage. A schematic of the short circuiting protocol is shown for 4 short circuits in Figure221(b). However, the amount of short circuits were varied during the testing. During the23experiments, a load is applied to the fuel cell until it reached a steady state voltage. A short24circuit is applied to find the maximum power increase which was then set as the short circuiting25interval, this process was then repeated by doing 10 short circuits using the set short circuit26duration and interval to verify the improved performance.6
12Figure 1: Schematic of the (a) short circuiting setup and (b) short circuiting protocol3After the formation of a short circuiting strategy using the 2 cell setup, this strategy was4verified by application in a commercial Horizon H-100 fuel cell stack which is an open cathode5system consisting of 20 cells in the stack each with an active area of 22.5 cm2 . Two systems6were used, a new H-100 system and a system that has been tested aggressively since 2014 and7has degraded over time such that its maximum performance was around 40 %. This was to test8the hypothesis that a single optimisation strategy could be applied to stacks in different9conditions.10The testing was done at 3 different current values in the range of 0.6 V to 0.75 V which11can be termed as the region where performance is thought to be dominated by the effect of12PtOH and PtO. The testing was done at 44.4 mA/cm2 (22 C), 88.9 mA/cm2 (25 C) and 133.313mA/cm2 (30 C) and the in-built controller was removed and replaced by the short circuiting14controller used for the 2 cell system. The systems were conditioned by the procedure15recommended by Horizon Fuel Cell systems to bring them to maximum efficiency. The testing16was done at the same current values for both systems but the new H-100 system was also tested17at 266.7 mA/cm2 (38 C) chosen so as to not exceed the 100 W power limit. The testing was18done with hydrogen flowing through the system with no purging to exclude the effect of19purging on the performance improvement. A fuel stoichiometry of 1.3 was used for H2 and20atmospheric air was used with operating the in-built fan at 5 V to maintain the temperature and7
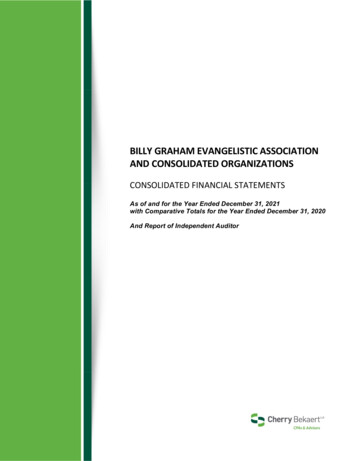
1sufficient air supply for reaction. Dry hydrogen was used with a relative humidity of 0 % and2the relative humidity of atmospheric air varied between 40- 45 % over the course of testing.3Electrochemical impedance spectroscopy was done at different current values to find the time4constant of the electrical double layer. The measurements were performed using an Autolab5potentiostat for H-100 stacks under load within a frequency range between 10 kHz and 0.1 Hz6with an amplitude of 5 % of the DC current. The spectra was recorded after the potential had7stabilised for the specified current value i.e. 1 A (44.4 mA/cm2), 2 A (88.9 mA/cm2), 3 A (133.38mA/cm2), 6 A (266.7 mA/cm2) in the current study.9Results and Discussion10Figure 2 shows the voltage profile recorded at 69.4 mA/cm2 for the 2-cell setup which11was subjected to a single short circuit from 10 ms to 500 ms. Results for other two current12values (138.9 mA/cm2 and 277.8 mA/cm2) are reported in supporting information (Figure S113and S2). First the 2-cell setup was held at 69.4 mA/cm2 for 10 mins to reach a steady state as14can be seen by the plateau on the potential curve, then a short circuit (which appears as spikes15on the graph) was applied for different time periods i.e. 10 ms, 50 ms, 100 ms, 200 ms and 50016ms. It can be clearly seen from the curve that the short circuiting time of 10 ms was not enough17to induce any gain in the potential. All other short circuiting times showed a similar profile of18increase in the potential and then a gradual decline. This confirms that the short circuit duration19must exceed the time taken to discharge the double layer, and that for times greater than this a20potential increase can be induced which can result in the increase of power. However, the21maximum amount of short circuiting time should be kept to a minimum so as not to induce any22permanent damage to the fuel cell and to achieve maximum power gain. This improvement in23the potential is due to the removal of the Pt hydroxide and oxide layers formed on the Pt catalyst24and thus resulting in a larger effective surface area of Pt available for the electrochemical25reaction. If short circuiting is not performed Pt hydroxide and oxide will continuously form,8
1and with time the potential will decay gradually as can be seen in Figure 2. In order to find the2amount of performance improvement from the short circuiting, cumulative average power3density gain per cell was calculated taking into account the power decrease during the short4circuit.5678Figure 2: Potential vs time comparison for short circuiting at 69.4 mA/cm2 (25 C) for Arcola2 cell setup at different short circuit time period9101112Figure 3: Cumulative average power density gain per cell at different short circuiting time forshort circuiting at 69.4 mA/cm2 (25 C) on Arcola 2 cell setup.13Figure 3 shows a relationship between the cumulative average power density gain per14cell with the increase of short circuiting time as a function of time after the short circuit. Sample15calculation for cumulative average power density gain per cell is shown in supporting16information S4. It can be clearly seen that the short circuiting time of 10 ms is a flat line very17near to 0 and thus offers no significant improvement in performance. With the increase in short9
1circuiting time, the point at which the cumulative power density gain becomes a net positive2start shifting towards the right i.e. it takes longer to recover the energy loss incurred during3short circuiting. This is likely due a number of reasons. Firstly the double layer will become4increasingly discharged at longer short circuit durations and thus requiring additional time to5be recharged. Secondly, at these potentials the oxides are likely to be removed quickly and they6have a finite coverage. Therefore there is a fixed amount of time (or charge) needed to remove7them, and once this is exceeded any further time spent during short-circuit is unnecessary and8wastes energy. Figure 3 also shows the cumulative average power density increasing with9increase in short circuiting time. This reaches a maximum and then starts decreasing. This time10could therefore be around the optimum time needed to remove the oxides. So, in order to11develop an optimum strategy, the cumulative average power density gain should be maximised12by minimising the time taken to recover the energy loss during the short circuit. Based on these13two criteria, a short circuiting time between 100 and 200 ms is the optimum short circuiting14time for this system. To test this strategy, multiple short circuits were done at 69.4 mA/cm215with a short circuiting time of 100 ms and interval of 36 s (point of maximum cumulative16average power density gain).17Figure 4 shows the comparison between the 2 cell setup run without short circuiting18and with the short circuiting strategy. A 3% increase in the performance was observed for the19system run using short circuits. The low performance improvement is due to the only 2 cells in20the system and also running of the system at a very low current density. Thus even though the21potential increase is by 50 mV, the change in performance is only by 3 %. From Figure 4 (b),22it can be seen that with every cycle, there is an improvement in the performance and after23around 7-8 cycles it has reached a dynamic equilibrium. The results show that one short circuit24is not enough to achieve the maximum performance gain but requires multiple short circuits.25As discussed in figure 2 that the voltage improvement is due to the removal of Pt hydroxides10
1and oxides from the Pt catalyst. However, one cycle of short circuiting is not enough to recover2the maximum performance and thus multiple short circuits are needed. This becomes clear3from Figure 4 that with multiple short circuits, the voltage gain is increasing and becomes4constant after 7 cycles.5678910Figure 4: (a) Potential profile at 69.4 mA/cm2 without and with 10 SC cycles (SC time-100ms and interval of 36 s). (b) Cumulative average power density gain profile for each shortcircuiting cycle.11The parametric short circuiting strategy developed above was then verified on a12commercial Horizon H-100 system. A single short circuit was done at different current13densities for different short circuiting times and short circuiting intervals, the optimum were14found by the analysis of cumulative average power density gain per cell (Figure S3 for 44.415mA/cm2). This was the same procedure as that developed using the 2 cell Arcola Energy system.16From the analysis of these results, the optimum short circuiting time was again between 10017and 200 ms. As Horizon recommends using a short circuiting strategy of short circuiting time18– 100 ms and interval – 10s, for a good comparison the short circuiting time of 100 ms was19used with the short circuiting interval obtained from our strategy of obtaining maximum20cumulative average power density gain.11
12345Figure 5: Potential comparison for short circuit testing using Imperial Arcola Strategy,Horizon Strategy and no short circuit at (a) 44.4 mA/cm2, (b) 88.9mA/cm2, (c) 133.3 mA/cm2and (d) 266.7 mA/cm2.6Figure 5 shows a comparison of the Horizon strategy, the developed strategy (Imperial7Arcola strategy) and no short circuiting on the old and new H-100 systems at different current8densities at a short circuiting time of 100 ms. As mentioned earlier, the old H-100 system was9tested aggressively for 2-3 years and can only deliver 40-45% of its rated power, and thus10higher current density testing was not possible. The results from this system are labelled as old.11Figure 5 (a) shows the voltage profile of the testing done at 1 A (44.4 mA/cm2) and the sample12with short circuiting shows an improvement of around 8 % in voltage value compared to the13one without short circuit for the old system. There is only one curve for this sample as the short14circuiting interval was the same for both the Horizon strategy and the optimised Imperial15Arcola strategy. For the new stack, there is an improvement of 10 % (Horizon Strategy) and12
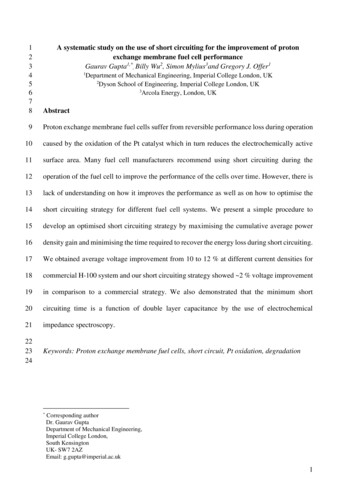
112 % (Imperial Arcola Strategy) as compared to the testing without any short circuiting. As the2short circuiting was removed after 2 hours, the voltage starts to drop gradually which suggests3that the surface oxide coverage is beginning to return to its equilibrium value.4Figure 5 (b) shows the voltage profile for the testing done at 2 A (88.9 mA/cm2) for5both H-100 stacks. The results demonstrate an improvement of 8 % (Horizon Strategy) and 10 %6(Imperial Arcola Strategy) for both the old and new stack in comparison to no short circuiting.7The system follows the same profile as seen in the testing done at 1 A (44.4 mA/cm2) when the8short circuits is removed after 2 hours. Similar improvements in the range of 10-12 % are9observed for both stacks when tested at 3 A (133.3 mA/cm2) with short circuiting in comparison10to no short circuiting as shown in figure 5 (c). As the old H-100 stack was not able to reach11higher currents, only the new stack was tested at 6 A (266.7 mA/cm2) and the voltage profile12obtained is shown in figure 5(d) with an inset highlighting the profile for 100 s. Similar13improvement of 10-12 % are observed by the use of short circuiting as compared to no short14circuiting. The testing was not done at even higher current densities due to the limitation of the15stack as it is rated for 100 W and while doing short circuiting at 6 A (266.7 mA/cm2), power16was around 92 W. Another point to be noted here is that we are able to exceed the performance17improvement using our Imperial Arcola strategy compared to the standard Horizon strategy at18all the current values. The improvement obtained by the Imperial Arcola strategy is almost 2 %19higher in all the cases which suggests that the short circuiting interval is an important factor20and it should vary with the operating condition of the stack like current density, temperature.21The other advantage using Imperial Arcola strategy is the validation and variation of the short22circuiting interval on the condition of stack i.e. new and old in the current study.23The relationship between short circuiting time and the electrochemical double layer24capacitance is also important. In order to investigate this, the double layer capacitance was25determined by electrochemical impedance spectroscopy. Electrochemical impedance13
1spectroscopy was done at the same current values which are used above for short circuiting in2the frequency range of 10 kHz and 0.1 Hz with an amplitude of 5 % of the DC current. Figure36 (a) shows the impedance spectra obtained at different current values. All the spectra are fitted4using Z-View using an equivalent circuit consisting of Rm (CPE1Rp) where Rm is the ohmic5resistance, CPE1 is the constant phase element and Rp is the polarisation resistance. There is a6slight decrease in the ohmic resistance with the increase in the current which can be due to the7better humidification of the membrane as the current increases. Also the charge transfer8resistance decreases with the increase in the current as the driving force for oxygen reduction9reaction increases as can be seen at the low frequency values of impedance, as expected by the10Butler-Volmer equation. As the electrochemical double layer is modelled as a capacitor, the11RC constant was calculated from the parameter obtained by circuit fitting and the result is12shown in Table 1. The RC constant for a capacitor is termed as the time required to charge or13discharge 63 % of the capacitor and our theory is that the minimum short circuiting time should14be higher than the time needed to discharge the electrical double layer appreciably. It can be15seen that the RC constant decreases with the increase in current which is due to the improved16oxygen reduction reaction kinetics at the higher current and thus lower resistance. Figure 6 (b)17shows the voltage profile obtained at 3 A (133 mA/cm2) by varying the short circuiting time18from 10 ms to 500 ms using a single short circuit. It can be seen that there is only a slight19improvement using the short circuiting time of 10 ms as the double layer is not completely20discharged and the effect of the short circuit is not prominent. As soon as the short circuiting21time is increased to 50 ms or above, the improvement is high as the double layer is discharged22to a significant amount during this time and the short circuit can induce other effects other than23just discharging the double layer.14
1234567Figure 6: (a) Electrochemical Impedance spectra obtained at different current values for H100 stack, (b) short circuiting profile obtained at 3 A for different short circuiting time and(c) variation of resistance and RC constant with current density as calculated by circuit fittingof impedance spectra shown in (a).Conclusions8A simple procedure to determine the optimum short circuiting strategy (the Imperial9Arcola strategy) has been developed using a single short circuit at different current values. This10strategy is based on maximising the cumulative average power density gain and minimising11the time required to recover the energy loss during short circuits. This strategy was validated12on a commercial H-100 stack using a degraded and new stack and the Imperial Arcola strategy13showed an extra improvement of 2 % compared to the standard Horizon strategy recommended14for use with H-100 systems. The optimum short circuiting duration and interval was shown to15be dependent on the operating conditions of the stack (i.e. current density). An overall15
1improvement of 10-12 % in voltage for a given current density, and hence power, was2demonstrated using short circuiting as compared to no short circuit.3The optimum short circuit duration was also shown to be a function of the double layer4capacitance of the fuel cell. If the short circuit duration is too short the charge passed during5the short circuit mainly contributes to the discharge of the double layer capacitance rather than6stripping of the oxides from the Pt surfaces. We show that by using impedance spectroscopy7measurements, the double layer capacitance can be determined and used to ascertain the8minimum short circuit time.9101112References[1] Wang Y, Chen KS, Mishler J, Cho SC, Adroher XC. A review of polymer electrolyte13membrane fuel cells: Technology, applications, and needs on fundamental research. Applied14Energy. 2011;88:981-1007.15[2] Zhang S, Yuan X-Z, Hin JNC, Wang H, Friedrich KA, Schulze M. A review of platinum-16based catalyst layer degradation in proton exchange membrane fuel cells. Journal of Power17Sources. 2009;194:588-600.18[3] Zhang J. PEM Fuel Cell Electrocatalysts and Catalyst Layers : Fundamentals and19Applications. Springer; 2008.20[4] Bing Y, Liu H, Zhang L, Ghosh D, Zhang J. Nanostructured Pt-alloy electrocatalysts for21PEM fuel cell oxygen reduction reaction. Chem Soc Rev. 2010;39:2184-202.22[5] Yu W, Porosoff MD, Chen JG. Review of Pt-based bimetallic catalysis: from model23surfaces to supported catalysts. Chemical reviews. 2012;112:5780-817.24[6] Chen Z, Higgins D, Yu A, Zhang L, Zhang J. A review on non-precious metal25electrocatalysts for PEM fuel cells. Energy & Environmental Science. 2011;4:3167.26[7] Godínez-Salomón F, Hallen-López M, Solorza-Feria O. Enhanced electroactivity for the27oxygen reduction on Ni@Pt core-shell nanocatalysts. International Journal of Hydrogen28Energy. 2012;37:14902-10.29[8] Othman R, Dicks AL, Zhu Z. Non precious metal catalysts for the PEM fuel cell cathode.30International Journal of Hydrogen Energy. 2012;37:357-72.16
1[9] Lee W-D, Lim D-H, Chun H-J, Lee H-I. Preparation of Pt nanoparticles on carbon support2
1 1 A systematic study on the use of short circuiting for the improvement of proton 2 exchange membrane fuel cell performance Gaurav Gupta1,* 3 , Billy 2Wu , Simon Mylius3and Gregory J. Offer1 4 1Department of Mechanical Engineering, Imperial College London, UK 5 2Dyson School of Engineering, Imperial College London, UK 6 3Arcola Energy, London, UK 7