Transcription
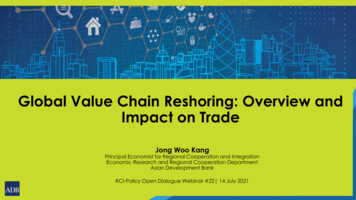
Global Value Chain Reshoring: Overview andImpact on TradeJong Woo KangPrincipal Economist for Regional Cooperation and IntegrationEconomic Research and Regional Cooperation DepartmentAsian Development BankRCI-Policy Open Dialogue Webinar #22 14 July 2021
Drivers of Supply Chain Reshoring Trade conflict between the United States (US) and the People’s Republic of China(PRC) have encouraged policy makers, especially in the US, to consider reshoringpolicies. Recent events such as the lockdowns due to the COVID-19 pandemic may causecompanies to consider reshoring their supply chains as well, although we have yetto see the data in 2020.2
Motivations of Reshoring Even before the pandemic, policy makers and businesses alike had revisited the rationale behind theoff-shoring strategy, driven mainly by cost and operational efficiency. (Middle-income countries) Technological progress has enabled many middle-income economies tomove up the technological ladder, and consequently to produce key intermediate goods themselvesinstead of relying on foreign imports. (Advanced countries) The development of robotics and artificial intelligence also motivates advancedeconomies to bring their production facilities closer to customers, tailoring their products to consumerpreferences. Concerns about the quality of products and services outsourced had also been on businesses’ minds. Inthis sense, COVID-19 and the trade war have accentuated motivation for reshoring rather thantriggering it. After all, the reshoring trend will likely persist, although its exact form and size is difficult to predict fromthe reflections on vulnerabilities of global supply chains, just-in-time inventory management systems,and vast spillover effects of the crunch in certain segments of supply chains (e.g., recent shortages inmicrochips and semiconductors).3
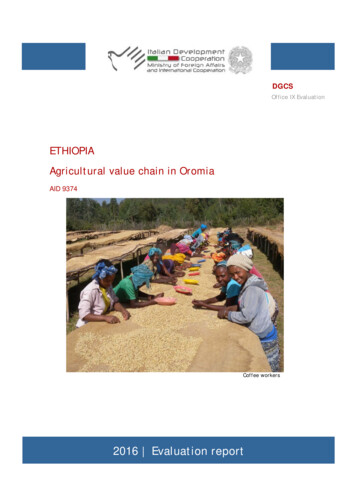
Progress of Supply Chain Reshoring In 2019, the Kearney reshoringindex for the US shows anincrease of 98 basis points. Decline in US manufacturingimports from the PRC due tothe trade war, which droppedby 17% from 2018 to 2019 ispointed out as the potentialsource.Source: Kearney4
Survey based estimation According to Thomas survey report in August 2020, 69% of companies across NorthAmerica manufacturing and industrial sectors are likely to bring manufacturingproduction and sourcing back to their region. Another survey report by Raconteur in September 2020 found that 66.2% of firmsglobally are considering reshoring to some degree.Source: raconteur.net5
Simulation-based estimation (IMF WEO 2019) Used Global IntegratedMonetary and Fiscal Model toestimate the impact ofreshoring on output,consumption, trade, andinvestment. If the US, the euro area, andJapan reshore enoughproduction that their nominalimports decline by 10%,advanced economies couldexperience a 1%–2% decline inoutput, and emergingeconomies about 0.5%.6
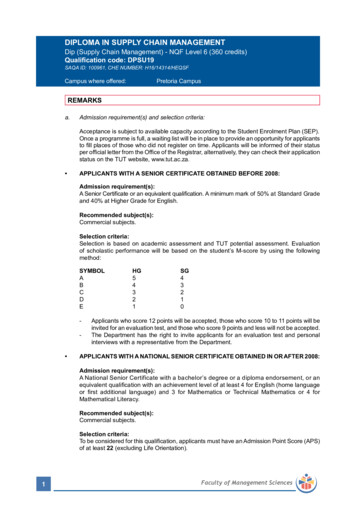
Global Value Chain Decomposition of 2019 Gross lAsiaEast Asia South Asia Southeast Pacific and st ofWorldWorldFinal goods exports which cross border only onceIntermediate goods exports that are absorbed by partner or third economiesFinal and intermediate goods exports under supply chains that can be reshored by home economiesNotes: Exports under supply chains that can be reshored by the home economy include goods with foreign value-added and returned domestic value added. This also includes goodsconsidered as double counted, in which its production involves a back-and-forth movement between the exporter and its direct partner. North America refers to Canada and theUnited States; Latin America refers to Brazil and Mexico; Pacific and Oceania refers to Fiji and Australia. Please see Appendix 3 for full list.Sources: Asian Development Bank (ADB) calculations using data from ADB. Multi-Regional Input-Output Tables; and methodology by Wang, Wei, and Zhu (2013).7
Backward and Forward Linkages of GVCBackward Global Value Chain LinkagesForward Global Value Chain LinkagesSource: ADB 2021.8
Asia and Central East AsiatheAsiaPacificSouth Southeast Pacific European LatinNorthAsiaAsiaandUnion America AmericaOceania5% Reshoring10% Reshoring100% SR50% SR30% SR100% SR50% SR30% SR100% SR50% SR30% SR100% SR50% SR30% SR100% SR50% SR30% SR100% SR50% SR30% SR100% SR50% SR30% SR100% SR50% SR30% SR100% SR50% SR30% SR100% SR50% SR30% % SR50% SR30% SR% deviation from controlImpact of Reshoring on Imports (%)Rest of WorldWorld20% ReshoringSR substitution rate.Notes: Reshoring rate refers to the share of imported intermediate goods and outsourced production that the main exporter will cut-off. Substitution rate refers to the capacity oflocal manufacturers to produce enough intermediate goods to compensate for the cut-off of imported intermediate goods and outsourced production. North America refers toCanada and the United States; Latin America refers to Brazil and Mexico; Pacific and Oceania refers to Fiji and Australia.Sources: ADB calculations using data from ADB. Multi-Regional Input-Output Tables; and methodology by Wang, Wei, and Zhu (2013).9
Asia and Central East Asiathe Pacific AsiaSouthAsia5% ReshoringSoutheast Pacific European LatinNorthAsiaandUnion America AmericaOceania10% ReshoringRest ofWorld100% SR50% SR30% SR100% SR50% SR30% SR100% SR50% SR30% SR100% SR50% SR30% SR100% SR50% SR30% SR100% SR50% SR30% SR100% SR50% SR30% SR100% SR50% SR30% SR100% SR50% SR30% SR100% SR50% SR30% % SR50% SR30% SR% deviation from controlImpact of Reshoring on Exports (%)World20% ReshoringSR substitution rate.Notes: Reshoring rate refers to the share of imported intermediate goods and outsourced production that the main exporter will cut-off. Substitution rate refers to the capacity oflocal manufacturers to produce enough intermediate goods to compensate for the cut-off of imported intermediate goods and outsourced production. North America refers toCanada and the United States; Latin America refers to Brazil and Mexico; Pacific and Oceania refers to Fiji and Australia.Sources: ADB calculations using data from ADB. Multi-Regional Input-Output Tables; and methodology by Wang, Wei, and Zhu (2013).10
0.00-5.00-10.00-15.00-20.00-25.00-30.00Asia and Europeanthe Pacific Union5% ReshoringLatinAmerica10% ReshoringNorthAmericaRest ofWorld100% SR50% SR30% SR100% SR50% SR30% SR100% SR50% SR30% SR100% SR50% SR30% SR100% SR50% SR30% SR-35.00100% SR50% SR30% SRpercent change in 2019 total trade (%)Impact of Reshoring on Total Trade (%)World20% ReshoringSR substitution rate.Notes: Reshoring rate refers to the share of imported intermediate goods and outsourced production that the main exporter will cut-off. Substitution rate refersto the capacity of local manufacturers to produce enough intermediate goods to compensate for the cut-off of imported intermediate goods and outsourcedproduction. North America refers to Canada and the United States; Latin America refers to Brazil and Mexico.Sources: ADB calculations using data from ADB. Multi-Regional Input-Output Tables; and methodology by Wang, Wei, and Zhu (2013).11
0.00-5.00-10.00-15.00-20.00-25.00Asia andthe PacificCentralAsia5% Reshoring100% SR50% SR30% SR100% SR50% SR30% SR100% SR50% SR30% SR100% SR50% SR30% SR100% SR50% SR30% SR-30.00100% SR50% SR30% SRpercent change in 2019 total trade (%)Impact of Reshoring on Total Trade (%)East Asia South Asia Southeast PacificAsiaandOceania10% Reshoring20% ReshoringSR substitution rate.Notes: Reshoring rate refers to the share of imported intermediate goods and outsourced production that the main exporter will cut-off. Substitution rate refers tothe capacity of local manufacturers to produce enough intermediate goods to compensate for the cut-off of imported intermediate goods and outsourcedproduction. Pacific and Oceania refers to Fiji and Australia.Sources: ADB calculations using data from ADB. Multi-Regional Input-Output Tables; and methodology by Wang, Wei, and Zhu (2013).12
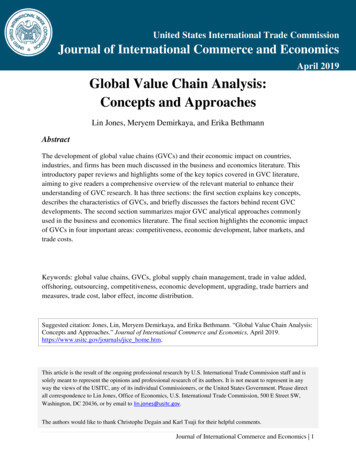
Estimated impact of supply chain reshoring on tradeWorld trade in goods and services ( trillion)65Baseline605510% reshoring5020% reshoring45403530Notes: Based on assumption of 50% substitution rate, which means that 50% of reshored capacity is replaced by domestic production. Reshoring rate (10% and 20%) refers to the share of imported intermediate goodsfor further processing for exports and outsourced production that the main exporter will cut-off. IMF World Economic Outlook April 2021 forecasts were used to estimate world trade in goods and services for 2021 andaverage trade growth in 2010-2021 for the baseline 2022-2025 period.Sources: ADB calculations using data from ADB. Multi-Regional Input-Output Tables based on methodology by Wang, Wei, and Zhu (2014); International Monetary Fund. World Economic Outlook April 2019 andOctober 2020 Databases; and World Bank. World Development Indicators.13
Decline in Total Trade per Industry (%)High and Medium Tech(-6.8%)Coke, refined petroleum, and nuclear fuelWater transportChemicals and chemical productsAir transportTransport equipmentOther supporting and auxiliary transport Electrical and optical equipmentFinancial intermediationBasic metals and fabricated metalPost and telecommunicationsMachinery, necRenting of M&Eq and other business Other nonmetallic mineralsInland transportConstructionHotels and restaurantsServices(-3.9%)Rubber and plasticsLow Tech(-5.2%)Electricity, gas, and water supplyWood and products of wood and corkHealth and social workOther community, social, and personal Food, beverages, and tobaccoWholesale trade and commission trade, Pulp, paper, paper products, printing, Manufacturing, nec; recyclingPublic administration and defense; Leather, leather products, and footwearRetail trade, except of motor vehicles EducationTextiles and textile productsPrimary(-3.5%)Sale, maintenance, and repair of motor Private households with employed Mining and quarryingReal estate activitiesAgriculture, hunting, forestry, and fishing-10-8-6-4-20-10-8-6Sources: Asian Development Bank (ADB) calculations using data from ADB. Multi-Regional Input-Output Tables; and methodology by Wang, Wei, and Zhu (2013).14-4-20
Decline in Asia’s Exports and Imports per Industry (%)Decline in Imports (%)Coke, refined petroleum, and nuclear fuelHigh and Medium TechHigh and Medium TechDecline in Asia’s Exports (%)Chemicals and chemical productsTransport equipmentElectrical and optical equipmentBasic metals and fabricated metalMachinery, necOther nonmetallic mineralsChemicals and chemical productsTransport equipmentMachinery, necPulp, paper, paper products, printing, and publishingRubber and plasticsConstructionLeather, leather products, and footwearLow TechFood, beverages, and tobaccoRubber and plasticsManufacturing, nec; recyclingConstructionWood and products of wood and corkManufacturing, nec; recyclingWood and products of wood and corkElectricity, gas, and water supplyTextiles and textile productsPulp, paper, paper products, printing, and publishingLeather, leather products, and footwearFood, beverages, and tobaccoPrimaryLow TechPrimaryOther nonmetallic mineralsBasic metals and fabricated metalTextiles and textile productsElectricity, gas, and water supplyMining and quarryingAgriculture, hunting, forestry, and fishingMining and quarryingAgriculture, hunting, forestry, and fishingWater transportPrivate households with employed personsAir transportWholesale trade and commission trade, except of motor Public administration and defense; compulsory social securityOther supporting and auxiliary transport activities; activities Post and telecommunicationsWater transportRetail trade, except of motor vehicles and motorcycles; repair Other supporting and auxiliary transport activities; activities of Financial intermediationSale, maintenance, and repair of motor vehicles and Health and social workAir transportPost and telecommunicationsInland transportServicesServicesElectrical and optical equipmentCoke, refined petroleum, and nuclear fuelFinancial intermediationInland transportRenting of M&Eq and other business activitiesHotels and restaurantsSale, maintenance, and repair of motor vehicles and Hotels and restaurantsRenting of M&Eq and other business activitiesHealth and social workOther community, social, and personal servicesPublic administration and defense; compulsory social securityOther community, social, and personal servicesWholesale trade and commission trade, except of motor EducationEducationReal estate activitiesReal estate activitiesPrivate households with employed personsRetail trade, except of motor vehicles and motorcycles; repair -14-12-10-8-6-4-20-14-12-10-8-6-415Sources: Asian Development Bank (ADB) calculations using data from ADB. Multi-RegionalInput-Output Tables; and methodology by Wang, Wei, and Zhu (2013).-20
Conclusion Recent events, including trade conflicts and COVID-19 lockdowns, have promptedpolicy makers and businesses to consider reshoring of supply chains to mitigate theadverse effects of these trade shocks. Using the ADB’s MRIO Tables to simulate the direct and spillover effects of reshoring,estimates suggest that reshoring by 5%–10% can lead to a 5.3% to 13.3% decrease inglobal trade from its base value. Impact will be heterogeneous across sectors and regions depending upon the depthof supply chain linkages.16
Thank you!ERCD/ERCI team17
the reflections on vulnerabilities of global supply chains, just-in-time inventory management systems, and vast spillover effects of the crunch in certain segments of supply chains (e.g., recent shortages in . Estimated impact of supply chain reshoring on trade Notes: Based on assumption of 50% substitution rate, which means that 50% of .