Transcription
Data Mining Data mining emerged in the 1980’s when the amount of data generated andstored became overwhelming. Data mining is strongly influenced by other disciplines such as mathematics,statistics, artificial intelligence, data visualization, etc. One of the difficulties with it being a new area is that the terminology isnot fixed; the same concept may have different names when used in differentapplications. We first see how Data Mining compares with other areas. Remember that we are using the working definition:“Data mining is the nontrivial extraction of implicit, previously unknown,and potentially useful information from data.” (W. Frawley).
Data Mining vs StatisticsStatistics can be viewed as a mathematical science and practice of developingknowledge through the use of empirical data expressed in quantitative form.Statistics allows us to discuss randomness and uncertainty via probability theory.For example, statisticians might determine the covariance of two variables to seeif these variables vary together and measure the strength of the relationship. Butdata mining strives to characterize this dependency on a conceptual level andproduce a causal explanation and a qualitative description of the data. Althoughdata mining uses ideas from statistics it is definitely a different area.Data Mining vs Machine LearningMachine Learning is a subfield of artificial intelligence which emerged in the1960’s with the objective to design and develop algorithms and techniques thatimplement various types of learning. It has applications in areas as diverse asrobot locomotion, medical diagnosis, computer vision, handwriting recognition,etc. The basic idea is to develop a learning system for a concept based on a set ofexamples provided by the “teacher” and any background knowledge. Main types
are supervised and unsupervised learning (and modifications of these). MachineLearning has influenced data mining but the areas are quite different. Dr. Barbuin the Statistics Department offers a course in Machine Learning.Data Mining vs Knowledge Discovery from Databases (KDD)The concept of KDD emerged in the late 1980’s and it refers to the broadprocess of finding knowledge in data. Early on, KDD and Data Mining were usedinterchangeably but now Data Mining is probably viewed in a broader sense thanKDD.Data Mining vs Predictive AnalyticsWikipedia’s definition is “ predictive analytics encompasses a variety of techniquesfrom statistics, data mining and game theory that analyze current and historicalfacts to make predictions about future events.” The core of predictive analyticsrelies on capturing relationships between explanatory variables and the predictedvariables from past occurrences and exploiting it to predict future outcomes. Oneaspect of Data Mining is predictive analytics.
Stages of Data Mining1. Data gathering, e.g., data warehousing, web crawling2. Data cleansing - eliminate errors and/or bogus data, e.g., patient fever 1253. Feature extraction - obtaining only the interesting attributes of the data,e.g., date acquired is probably not useful for clustering celestial objects4. Pattern extraction and discovery - this is the stage that is often thought ofas data mining5. Visualization of the data6. Evaluation of results; not every discovered fact is useful, or even true! Judgement is necessary before following your software’s conclusions.
Clearly we can’t look at all aspects of Data Mining but we’ll just pick a few andget the basic idea.Dr. Meyer-Baese gives a course in Data Mining if you are interested in learningmore about the topic. Clustering for feature extraction - we have already talked about this Classification - algorithms to assign objects to one of several predefinedcategories Association Rules - algorithms to find interesting associations among largesets of data items. Neural Networks Support Vector Machine Genetic Algorithms
ClassificationExamples include: classifying email as spam based upon the message header and content classifying cells as benign or cancerous based upon results of scan classifying galaxies as e.g., spiral, elliptical, etc. based on their shapes classifying consumers as potential customers based upon their previous buying
TerminologyEach record is known as an instance and is characterized by the attribute set, xand a target attribute or class label yWhen we use Classification we attempt to find a target function f that mapseach attribute set x to one of the predefined class labels y. The target functionis also called the classification model.Typically we will use a set of data, called the training set, to build our model.We can use the target function for one of two purposes: Descriptive Modeling - Goal is to serve as an explanatory tool to distinguishbetween objects of different classes. Predictive Modeling - Goal is to predict the class label for unknown records.There are 4 types of attributes: nominal - different names; e.g., brown or blue for eye color, SSN, gender
ordinal - provides ordering; e.g., hot, mild, cold; small, medium, large interval - difference in values are meaningful; e.g., dates, temperature ratio- differences and ratios are meaningful; e.g., mass, ageAttributes can be discrete or continuous.Discrete attributes can be categorical such as zip codes, SSN or just numerical.Binary attributes are a special case of discrete and only take on two values such asmarried or not, homeowner or not, mammal or not, etc. These can be representedas 0 and 1 and are often called Boolean attributes.Continuous attributes have values which are real numbers; e.g., temperature,weight, salary, etc.Classification techniques are best suited for data which is binary or nominal.Often when we have continuous data we transform it to ordinal such as small,medium, or large.
General Approach to Solving a Classification ProblemThe goal is to use a systematic approach to build a classification model from ourtraining data. The model should fit the training data well and correctly predictthe class labels of unseen records not in the training data.We may use decision tree classifiers rule-based classifiers neural networks support vector machine Bayes classifiers .Each technique uses a learning algorithm to identify a model that best fits the
relationship (in some sense) between the attribute set and class label for the inputdata.General Steps1. Provide a training set of records whose class labels are known2. Apply one of the techniques above to build a classification model using thetraining set3. Apply the model to a test set to determine class labels4. Evaluate the performance of the model based on the number of correct/incorrectpredictions of the test set; we can then determine the accuracy as the fractionof correct predictions or the error rate as the fraction of wrong predictions.Example Suppose we want to classify records as either Class A or Class B. Weuse our classification model on our test set and get the following results.
Actual Predicted ClassClassClass A Class BClass A4310Class B1235In this test set there are 100 records. The table says that 43 records were correctlylabeled as Class A and 10 records were incorrectly labeled as Class A. Also 35Class B records were correctly labeled and 12 were mislabeled as Class A. Thismeans that our accuracy is 78/100 or 78% and our error is 22/100 or 22%.So now what we need to do is find a way to build a classification model. We willlook at decision trees which is probably the easiest approach.
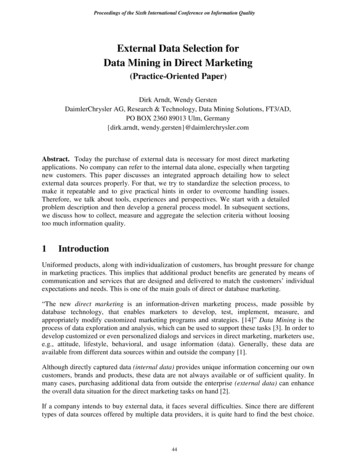
Decision TreesThe idea behind decision trees is to pose a series of questions about the characteristics we want. Of course we must carefully choose the questions in order todevelop the desired attributes.Example Suppose we have a list of vertebrates and we want to classify themas mammals or non-mammals. Below is a possible decision tree for classifying avertebrate. Note the following terminology:root node - no incoming edges and zero or more outgoing edgesinternal node - exactly one incoming edge and two or more outgoing edgesleaf node - exactly one incoming and no outgoing
root mmalscoldNon-Mammalsnoleaf nodeNon-Mammalsleaf nodesSuppose we want to use the decision tree to classify a penguin which has thefollowing attributes:name body temp gives birth classpenguin warm-bloodedno?
Applying the decision tree we see that the penguin is classified as a non-mammalbecause it is warm-blooded but doesn’t give birth.If we think about it we realize that there are exponentially many decision treesthat can be constructed from a given set of attributes. So what do we do?Finding the optimal one is probably not an option so we settle for a suboptimalresult.Many decision trees are inductive and use a greedy approach.A greedy algorithm is one which constructs a solution through a sequence ofsteps where at each step the choice is made based upon the criteria that(i) it is the best local choice among all feasible choices available at that step and(ii) the choice is irrevocable, i.e., it cannot be changed on subsequent steps ofthe algorithm.Example Suppose we want to build a decision tree to predict whether a personwill default on his/her car loan payments. We collect data from previous bor-
rowers and accumulate the following training set. The attributes we summarizeare: (i) homeowner (binary attribute), (ii) marital status (nominal/categorical),(iii) annual income (continuous ). Our target class label is binary and is whetherthat person defaults on the loan payments.# home owner marital status annual income no10nosingle90KyesHunt’s algorithm grows a decision tree in a recursive manner. The records aresubsequently divided into smaller subsets until all the records belong to the same
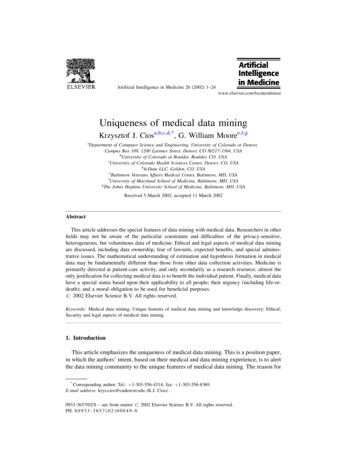
class.Step 0 - check to make sure all records in training set didn’t answer “no” orall answer “yes” to “defaulted”. In our training set there were individuals whodefaulted and those that didn’t.Step 1 - determine your first criteria for making the “greedy” choice. Here wechoose the attributes in order and choose home ownership. We note that allthree home owners did not default on their loans so that is a leaf; however somenon-home owners defaulted and others didn’t so we need to subdivide further.Step 2 - our second criteria is marital status. Here we note that all marriedborrowers repaid their loans so that is a leaf; however all single and divorced didnot repay so we need to subdivide again.Step 3 - our third criteria is annual income. The group of non-homeowners whoare single or divorced is divided by 80K or 80K. In this case the individualsmaking more than 80K defaulted and those making less did not.
The resulting decision tree is illustrated below.HomeownernoyesDefaulted noSingle,DivorcedMaritalstatusMarriedDefaulted noAnnualincome 80KDefaulted no 80KDefaulted yesOf course if we ask the questions in a different order we get a different decisiontree as the following demonstrates.
MarriednoyesHomeOwnerDefaulted noyesnoDefaulted noAnnualincome 80KDefaulted no 80KDefaulted yes
Hunt’s algorithm for determining a decision treeWe have seen that the approach is recursive and at each step we partition thetraining records into successively similar subsets.To describe the method we let y {y1, y2, . . . , yℓ} be the class labels (in ourcase we just have default yes and default no). Let Di be the ith subset of thetraining set that is associated with node i (either root, internal or leaf node).The algorithm is applied recursively as follows:Check to see if all records in Di below to the same class yi. If so, then i is a leaf node (i.e., terminal) If not, then choose an attribute test condition to partition the records intosmaller subsets. A child node (internal node) is created for each outcomeof the test condition and the records in Di are distributed according to theoutcome of the test condition.
Of course one of these child nodes may be empty if none of the trainingrecords have the combination of attributes associated with each node. Inthis case we just declare it a leaf node with the same class label as themajority class of training records associated with its parent node.Also suppose we had separated our home owners and the ones who ownedhomes had identical attributes but different class labels, i.e., some defaultedand some didn’t. We couldn’t separate these records any further. In thiscase we declare it a leaf node with the same class label as the majority.How should we stop the tree growth?We need a termination criteria for our recursive algorithm. We could stop itwhen either all records in Dj have the same class label or are empty or all haveidentical attributes except for the class label. However, there may be times whenit is advantageous to terminate early.
How should we split each training set?At each recursive step we must select an attribute test condition to divide therecords into smaller subsets. So we want to investigate how to choose a testcondition to divide Di. Can we make a more intelligent choice than a randomselection? Let’s look at the situation for different types of attributes.Binary attributes are in a sense the easiest because they only generate two potential outcomes; e.g., a home owner query is either yes or no.Nominal attributes can have many values so splitting them can result in morethan two child nodes or we can split it by grouping all but one value in one childnode. For example, if we query marital status we can have the following splits.
eSingleDivorcedMarriedDivorcedSingleOrdinal attributes can produce two or more splits; e.g., small, medium, large.Continuous attributes are usually tested with a comparison, i.e., , So now suppose we are at a step of our algorithm and want to determine whichattribute to use as a test. What we would like is a measure for selecting the best
way to divide our records.Let’s look at the easiest case of binary attributes with only two classes (likemammal or non-mammal or default or no default).Let p(i t) denote the fraction of records belonging to class i at a given node t;so in the two class problem p(1) p(2) 1.When we split Dt then we would like at least one of the child nodes to be “pure”or homogeneous in the sense that all records in that node are of the same class.So it is reasonable to use a measure of the “impurity” or heterogeneity of thechild nodes which we split Dt.To this end, the following measures are often used for a node t; here k is thenumber of classes.
Gini(t) 1 kXp(i t))2i 1Classification error(t) 1 max (p(i t))1 i kEntropy(t) kXp(i t)) log2 p(i t)i 1The first two are related to standard norms. To understand the entropy measureconsider the case of two variables like a coin toss. The outcome of a series of cointosses is a variable which can be characterized by its probability of coming upheads. If the probability is 0.0 (tails every time) or 1.0 (always heads), then thereisn’t any mix of values at all. The maximum mix will occur when the probabilityof heads is 0.5 which is the case in a fair coin toss. Let’s assume that our measureof mixture varies on a scale from 0.0 (“no mix”) to 1.0 (“maximum mix”). This
means that our measurement function would yield a 0.0 at a probability of 0.0(pure tails), rise to 1.0 at a probability of 0.5 (maximum impurity), and fall backto 0.0 at a probability of 1.0 (pure heads). This is what the Entropy measuresdoes.ExampleSuppose we have 20 records (10 male and 10 female) and our classes are “shop atOverstock.com” or not (say class 1 and class 2) and we have divided the recordsby gender. For different scenarios of the female “child” node we want to computethe three measurements of error.(i) all 10 females are of class 1Because p(1) 1.0 and p(2) 0.0 we haveGini(t) 1 (12) 0Classification error(t) 1 1 0.0Entropy(t) (1 log2(1) 0) 0.0
and as expected, the “impurity” measures are zero, i.e., the results are homogeneous.(ii) 5 females are of class 1 and 5 of class 2Because p(1) 0.5 and p(2) 0.5 we haveGini(t) 1 (.52 .52) 0.5Classification error(t) 1 0.5 0.5 Entropy(t) .5 log2(.5) .5 log2(.5) 1.0These are the maximum values that the measures take on because the class isequally split so it is the least homogeneous.(ii) 8 females are of class 1 and 2 of class 2Because p(1) 0.8 and p(2) 0.2 we haveGini(t) 1 (.82 .22) 0.32
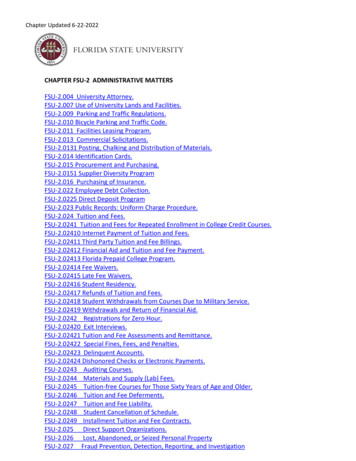
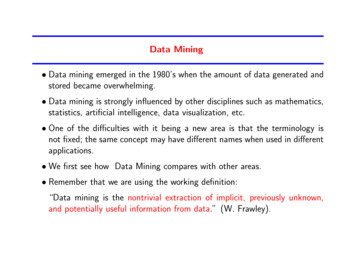
Classification error(t) 1 0.8 0.2 Entropy(t) .8 log2(.8) .2 log2(.2) 0.7219If we were to plot these quantities for a range of probabilities we would get thatthey achieve their maximum when there is a uniform class distribution. This isshown in the figure 50.60.70.80.91
To determine how a test condition performs, we compare the degree of impurityof the parent node before splitting with the degree of impurity of the child nodesafter splitting. The larger their difference the better the test condition.The gain is a measure that can be used to determine how good a split we aremaking so our goal will be to choose a test criterion that will maximize the gain.Of course it will depend on the measure we use. Basically all we do is take thedifference in the impurity measure of the parent minus a weighted average of themeasures of each child node.
Gain: Let I denote the impurity measure (i.e., one of the measurementsdefined above). Assume that we have split the parent node which consists of N records into k child nodes which consist of Nj records in thejth child node. Then Iparent kXNjj 1NIjWhen the entropy measurement is used it is known as the informationgain.Example Suppose we have a parent node which is equally split so Iparent 0.5for Gini measure. Now let’s say we use two different criteria to split the recordsand we get two child nodes with the following results.Criteria ANode 1 - 4 in class 1 and 3 in class 2Node 2 - 2 in class 1 and 3 in class 2
Criteria BNode 1 - 1 in class 1 and 4 in class 2Node 2 - 5 in class 1 and 2 in class 2Which criterion is better? Let’s use the Gini measure and compare.We compute the Gini measure for Node 1 to get 0.4898 and for Node 2 we get0.480 so the gain for using attribute A as a query is the weighted average 57(.4898) (.480) .5 0.4857 0.0143.5 1212For criteria B we compute the Gini measure for Node 1 to get 0.32 and for Node2 we get 0.4082 so the gain for using attribute B as a query is the weightedaverage 57.5 (.32) (.4082) .5 0.3715 0.1281212so the gain is higher if we use attribute B to split the parent node. Note thatusing B results in a smaller weighted average so you get a bigger gain whichmakes sense because it is a measure of the impurity.What happens if we use nominal attributes instead of binary to split the records.
If, for example, we have 3 nominal attributes then there are three ways these canbe split; two with two child nodes and one with 3 child nodes. For the multiwaysplit (i.e., 3 child nodes) we simply use k 3 in our formula for the gain.Example Return to our example of the decision tree for deciding whether anindividual will default on a loan and decide whether it is better to query (i) homeowner or (ii) marital status (assuming 2 child nodes) based on the data given.Use Gini measure. Assume class 1 is “no default.”The parent nodes consists of 10 records 7 of which did not default on the loanso the Gini measure is 1 .72 .32 0.420.If we use query (i) (home owner) then Node 1 has 3 records all of class 1 andnone of class 2 so its Gini measure is 0. Node 2 has 4 records in class 1 and 3 inclass 2 so its Gini measure is 1 (4/7)2 (3/7)2 0.4898. So the gain is 0.42-(0 .7(.4898)) 0.0771.If we use query (ii) (marital status) then Node 1 has 4 records all of class 1 soits Gini measure is 0. Node 2 has 3 records in class 1 and 3 in class 2 so its Gini
is 0.5. Thus its gain is 0.42-(0 .5(.6)) 0.12. Thus query (ii) is better by thismeasure.Example Here’s a canonical example from classification we can investigate.Suppose we have collected the following attributes which we classify as binary,nominal, ordinal, continuous, etc.attributepossible outcomesoutlooksunny, overcast, rain ndytrue/false (binary)Our goal is to predict whether a game (such as tennis) will be played. We usethe following training data which consists of 14 records to build our model.
outlook temperature humidity windyplaysunny8585false Don’t Playsunny8090true Don’t falsePlayrain6570true Don’t Playovercast6465truePlaysunny7295false Don’t n7180true Don’t PlayOur goal is to determine which decision tree gives the largest information gainusing the entropy (randomness) measure. We begin by deciding which attribute
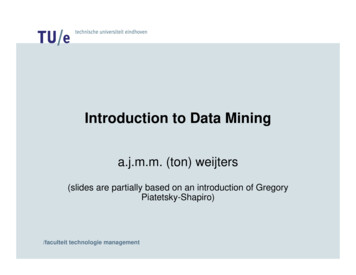
to test first.1.We start with choosing the outlook as the root node.Out of the 14 plays 9 play and 5 don’t so we compute the Entropy measure toget (9/14) log2(9/14) (5/14) log2(5/14) 0.9403Similarly the sunny outlook as 5 records, 2 of which play so .4 log2 .4 .6 log2 .6 0.9710The overcast child node is homogeneous and so its measure is 0. The rain nodehas 3 records which play so it has the same measure as the sunny node. This isillustrated below.
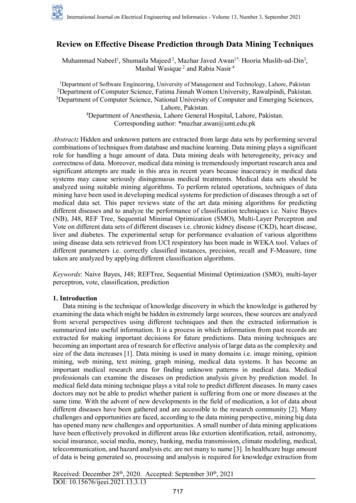
outlook9 play4 don t play0.9403sunny2 play3 don t play0.9710overcastrain4 play0 don t play3 play2 don t play0.00.9710The gain in choosing this is determined by 0.9403 (parent measure) minus aweighted average of the three child nodes, i.e.,h5i5information gain 0.9403 .9710 0 .9710 0.9403 0.6929 0.247414142. Now we start with the temperature as the root node and compute its gain.For simplicity we break the temperature into cool for temperatures below 70 ,mild for temperatures 70 but 80 and hot for temperatures 80 . TheEntropy measure for each is shown in the figure and the weighted average for thethree child nodes is 0.9111 so the gain is 0.0292 which is less than choosing theoutlook as the parent node. We really didn’t have to compute the gain, because
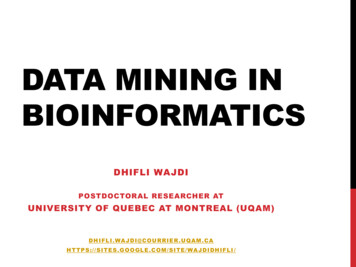
the measure for the child nodes was larger than the previous case so it resultedin a smaller gain.temperature9 play4 don t play0.9403cool3 play1 don t play0.8113mild4 play2 don t play0.9183hot2 play2 don t play1.03. Now we start with the humidity as the root node and compute its gain.We divide the humidity as low when it is 75, medium when it is between75 and 90 and high for 90. The measures are given in the figure below andbecause the weighted average of the measure for the child nodes is 0.85 it isstill larger than when we chose outlook as the parent node so the gain is less.
humidity9 play4 don t play0.9403low5 play1 don t play0.8113highmedium2 play2 don t play1.02 play2 don t play1.0weighted average 0.854. Lastly we choose windy as our first attribute to test. This is binary so weonly have two child nodes. There are 6 windy records and it was evenly splitbetween play and no play. For the remaining 8 records there were 6 plays and2 no plays. Clearly the windy node has measure 1.0 and we compute the notwindy node measure as 0.8113 so the weighted average is 0.8922 which resultsin a lower gain.Consequently we choose outlook as the choice of the first attribute to test. Nowwe don’t have to subdivide the overcast child node because it is homogeneous(pure) but the other two we need to divide. So if we take the sunny node then
we have to decide whether to test first for temperature, humidity or windy. Thenwe have to do the same thing for the rainy node.Here are the 5 sunny records.outlook temperature humidity windyplaysunny8585false Don’t Playsunny8090true Don’t Playsunny7295false Don’t Playsunny6970falsePlaysunny7570truePlayWe tabulate our results for the three remaining attributes below. Clearly the bestchoice is humidity because it results in all homogeneous child nodes (entropymeasure 0.0) so we don’t even have to determine the weighted averages todetermine the gain.
temperaturehumiditywindyPlay Don’t MeasurePlay Don’t MeasurePlay Don’t MeasurePlayPlayPlaycool 100.0 low200.0 true 210.9183mild 111.0 med 010.0 false 020.0hot020.0 high 020.0outlook9 play4 don t play0.9403sunnyovercast4 play0 don t play0.02 play3 don t play.9710humiditymedlow2 play0 don t play0.0high0 play1 don t play0.0rainy3 play2 don t play0.9710leaf nodesubdividenext0 play2 don t play0.0leaf nodesHere are the 5 rainy records which we want to determine how to subdivide. Asbefore we compute the weighted average of our measure for the child nodes and
choose the smallest because it will result in the largest gain.outlook temperature humidity 0true Don’t Playrain7580falsePlayrain7180true Don’t PlaytemperaturehumiditywindyPlay Don’t MeasurePlay Don’t MeasurePlay Don’t MeasurePlayPlayPlaycool 111.0 low010.0 true 020.0mild 210.9183 med 210.9183 false 300.0hot000.0 high 000.0Once again we see that windy is the best choice because it results in all the nodesbeing homogeneous. Our final decision tree using our greedy algorithm with theentropy measure is given below.
outlook9 play4 don t play0.9403sunny4 play0 don t play0.02 play3 don t play.9710humiditymedlow2 play0 don t play0.0rainyovercasthigh0 play1 don t play0.0leaf node3 play2 don t play0.9710Truewindy0 play2 don t play0.0False3 play0 don t play0.00 play2 don t play0.0leaf nodesNow suppose we have the following two new records to classify using our decisiontree. What do you conclude?outlook temperature humidity windy playrain6694true?sunny7681false?
Other Classification TechniquesThere are a multitude of classification techniques other than decision trees. Wewill only briefly look at a few of them due to time constraints. Rule-based classifiers Nearest neighbor classifiers Least Mean squares classifiers Bayesian classifiers Artificial Neural Networks Support Vector Machine Ensemble methods
Rule-based ClassifierIn Rule-based classification we separate our data records using rules in the formof if – then constructs.We will use the notation for “and” and for “or”.To see how this classification technique works, assume that we have a trainingset of data on vertebrate which has the following attributes and their possibleoutcomes.
attributepossible outcomesbody temperaturewarm- or cold-bloodedskin coverhair, scales, feathers, quills, fur, nonegives birthyes/noaquaticyes/no/semiaerialyes/nohas legsyes/nohibernatesyes/noOur class labels aremammals, birds, reptiles, fishes, amphibians
From our training set (or from a biology course) we could develop the followingrule set {r1, r2, r3, r4, r5} to classifiy each of the five labels.r1 : (gives birth no) (aerial yes) birdr2 : (gives birth no) (aquatic yes) fishr3 : (gives birth yes) (body temperature warm-blooded) mammalsr4 : (gives birth no) (aerial no) reptiler5 : (aquatic semi) amphibianNow consider two new records which we want to classifyNamebody skin gives aquatic aerial legs hibernatestemp cover birthgrizzly bear flightlesswarm onono
Now the grizzly bears does not satisfy the conditions of r1 or r2 but r3 is triggeredand it is classified as a mammal.The turtle triggers r4 and r5 but the conclusions of these rules are contradictoryso it can’t be classified with this rule set.The flightless cormorant triggers rule 4 so it is incorrectly classified as a reptile.The last record does not trigger any of the five rules.We say the rules in a rule set are mutually exclusive if no two rules are triggeredby the same record. Thus our rule set above is not mutually exclusive becausethe record for turtle triggers two rules with contradictory classifications.We say the rules in a rule set are exhaustive if there is a rule for each combinationof the attribute set. Thus our rule set is not exhaustive because it failed toconsider the combination of attributes that the guppy has.ExampleCan you write a set of mutually exclusive and exhaustive rules which
classify vertebrates as mammals or non-mammals?Usually one describes the quality of a classification rule by a measure of itsaccuracy and coverage. If we have a set of records D and a rule r which classifiesdata as class y then its coverage is just the fraction of D that the rule triggers,say Dr /D. The accuracy or confidence level is just the fraction of records thatit classifies correctly, i.e.,records in Dr which are of class yaccuracy DrOrdered RulesJust like when you program if-then constructs the ordering of classification rulescan be important. For example, if one rule is expected to have a much highercoverage than the others, we might want to order it first; there are other choicesfor ranking the rules too. So if we have an ordered set we could avoid the problemwe encountered classifying the turtle record. Because we order the rules by somepriority we classify a record based on the first rule that it triggers. Unfortunately,in our ordering of the rules we would have classified the turtle record incorrectly
as a reptile so our ordering was not so good. Interchanging rules 4 and 5 wouldfix this problem but of course it could create others.Unordered RulesWe could take a different approach and let a record trigger multiple rules. In thiscase we keep a count of each way we classify the record and then just go withthe majority (if there is one). This approach
data mining strives to characterize this dependency on a conceptual level and produce a causal explanation and a qualitative description of the data. Although data mining uses ideas from statistics it is definitely a different area. Data Mining vs Machine Learning Machine Learning is a subfield of artificial intelligence which emerged in the