Transcription
Man vs. Machine: Comparing Physician vs. ElectronicHealth Record–Based Model Predictions for 30-Day HospitalReadmissionsOanh Kieu Nguyen, MD, MAS1,2,3, Colin Washington, MD, MPH1,Christopher R. Clark, MPA4, Michael E. Miller, MS2, Vivek A. Patel, MD1,Ethan A. Halm, MD, MPH, MBA1,2, and Anil N. Makam, MD MAS1,2,31Department of Internal Medicine, UT Southwestern, Dallas, TX, USA; 2Department of Population and Data Sciences, UT Southwestern, Dallas, TX,USA; 3Division of Hospital Medicine at San Francisco General Hospital, University of California, San Francisco, San Francisco, CA, USA; 4Departmentof Research Administration, Parkland Health and Hospital System, Dallas, TX, USA.BACKGROUND: Electronic health record (EHR)-based readmission risk prediction models can be automated inreal-time but have modest discrimination and may bemissing important readmission risk factors. Clinicianpredictions of readmissions may incorporate informationunavailable in the EHR, but the comparative usefulness isunknown. We sought to compare clinicians versus a validated EHR-based prediction model in predicting 30-dayhospital readmissions.METHODS: We conducted a prospective survey of internalmedicine clinicians in an urban safety-net hospital. Clinicians prospectively predicted patients’ 30-day readmission risk on 5-point Likert scales, subsequently dichotomized into low- vs. high-risk. We compared human withmachine predictions using discrimination, net reclassification, and diagnostic test characteristics. Observedreadmissions were ascertained from a regional hospitalization database. We also developed and assessed a “human-plus-machine” logistic regression model incorporating both human and machine predictions.RESULTS: We included 1183 hospitalizations from 106clinicians, with a readmission rate of 20.8%. Both clinicians and the EHR model had similar discrimination (Cstatistic 0.66 vs. 0.66, p 0.91). Clinicians had higherspecificity (79.0% vs. 48.9%, p 0.001) but lower sensitivity (43.9 vs. 75.2%, p 0.001) than EHR model predictions. Compared with machine, human was better atreclassifying non-readmissions (non-event NRI 30.1%)but worse at reclassifying readmissions (event NRI 31.3%). A human-plus-machine approach best optimizeddiscrimination (C-statistic 0.70, 95% CI 0.67–0.74), sensitivity (65.5%), and specificity (66.7%).CONCLUSION: Clinicians had similar discrimination buthigher specificity and lower sensitivity than EHR modelpredictions. Human-plus-machine was better than eitheralone. Readmission risk prediction strategies should incorporate clinician assessments to optimize the accuracyof readmission predictions.Meeting Presentations Preliminary findings from this project werepresented at the Society of General Internal Medicine Annual Meeting inApril 2018 in Denver, Colorado.Received July 15, 2020Accepted November 19, 2020Published online January 14, 2021KEY WORDS: patient readmission; logistic models; electronic healthrecords; safety-net providers; hospitalization.J Gen Intern Med 36(9):2555–62DOI: 10.1007/s11606-020-06355-3 Society of General Internal Medicine 2021INTRODUCTIONUp to 1 in 5 hospitalized adults experiences an unplannedreadmission within 30 days, accounting for 26 billion ofannual Medicare costs.1–3 Since 2012, hospitals have beensubject to financial penalties under the Centers for Medicareand Medicaid Services Hospital Readmissions Reduction Program (HRRP) for excessive all-cause 30-day readmissionsamong patients with an index hospitalization for an increasingnumber of targeted medical and surgical conditions, includingcongestive heart failure, acute myocardial infarction, pneumonia, and chronic obstructive pulmonary disease.4,5 These federal penalties have stimulated intense efforts to develop readmission reduction intervention strategies, which are highlyresource-intensive but have been only modestly effectivewhen indiscriminately applied to all hospital inpatients.6–9Identifying hospitalized patients at high risk for readmissionbefore they are discharged can enable interventions to betargeted to those at the highest risk and therefore most likelyto benefit.10 Electronic health record (EHR)-based risk prediction models incorporating granular clinical data (i.e., vital signs,hospital-acquired conditions, laboratory results, etc.), are superior to approaches using claims-based administrative data, butare limited by the types of information documented andencoded in the EHR.11–18 A growing body of evidence suggeststhat social, functional, and behavioral factors are associatedwith increased risk of readmission, and that incorporating thisinformation into prediction models improves readmission riskprediction across a variety of conditions.19–30 However, atpresent, this information is not uniformly available in EHRs.31Clinician perceptions of readmission risk are readily ascertainable and may incorporate valuable information on severityand complexity of patient illness, as well as information on2555
2556Nguyen et al: Man vs Machine: Physician vs EHR Model Readmission Predictionssocial, functional, and behavioral factors unavailable in theEHR, but the comparative accuracy of physician predictionsfor 30-day readmissions is not well established. Prior researchin this area consists of only two studies, which wereboth limited by small sample sizes and modest to poordiscrimination of readmissions by both clinicians andcomparator risk tools. One study, conducted prior toHRRP, compared provider predictions (attending andresident physicians, nurses, and case managers) with astandardized risk tool for a cohort of 164 patients andfound that both providers and the risk tool had uniformly poor discrimination (C-statistic 0.50–0.59 for providers vs. 0.56 for the risk tool).32 A more recent studycompared clinician predictions (attending and residentphysicians and nurses) with the LACE index (length ofstay, acuity, comorbidities, emergency department use)for 359 patients and found that clinicians and the LACEindex had similarly modest discrimination (C-statistic0.63–0.69 for clinicians vs. 0.62 for LACE).33Thus, we sought to conduct a head-to-head comparison of the performance of physicians versus a validatedEHR-based prediction model in predicting 30-day hospital readmissions in a large, diverse cohort of hospitalized adults with a wide range of clinical, social, functional, and behavioral needs. We hypothesized that physicians would be better able to predict 30-dayreadmissions due to increased awareness of social context and other patient characteristics influencingreadmissions not captured as well in EHR data.METHODSStudy Setting and PopulationIn this prospective cohort study, we recruited inpatient internalmedicine physicians from Parkland Hospital, a large 862-bed,public safety-net hospital in Dallas, Texas, from Septemberthrough October 2017. Parkland is a level 1 trauma center, thesole safety-net hospital in Dallas County, and is part of a largeintegrated county health system that cares for 1.5 millionpatients annually who represent a racially and ethnically diverse poor, underinsured and uninsured urban population.We included all attending physicians, trainees, and advanced practice providers providing patient care on the inpatient internal medicine (6 teaching and 21 hospitalist directcare services) and cardiology services (4 teaching services),with a combined average daily census of about 300 patients.We obtained verbal consent from all participants. We recruitedat least one team member from all teaching services. Allrecruited individuals other than two faculty on non-teachingservices agreed to participate in the study. The UT Southwestern Institutional Review Board reviewed and approved thisstudy prior to the onset of data collection.JGIMClinicians’ Predictions of Readmission RiskWe surveyed clinicians on their perceived risk of readmission foreach patient under their care who was potentially being dischargedthat day, using a 3-item verbal questionnaire developed by theresearch team and administered in-person by a team member onthe day of anticipated discharge (Appendix Figure 1). Clinicianswere unaware of the included predictors and results of the EHRbased model prediction of readmission risk. For each patient,clinicians were asked to predict the risk of 30-day readmissionand rate their own confidence in each prediction on 5-point Likertscales. They were also asked to select the main reason for potential30-day readmission from three choices: medical issue, social issue,or mental health/substance abuse issue. All responses were directlyrecorded in REDCap.34 For patients on a teaching service, wecollected predictions from as many team members as possible andused the most senior team member’s prediction (by descendinglevel of experience: attending, resident, intern) to limit predictionsto one per patient in the primary analysis. We identified individualclinician characteristics from information publicly availablethrough the Texas Medical Board.35EHR-Based Model Predictions of ReadmissionRiskAfter completion of the clinician surveys, we retrospectively extracted clinical data from the EHR (Epic Systems, Verona, WI) forhospitalized patients for whom we had at least one clinician survey,to calculate the risk of 30-day all-cause readmission using apreviously validated EHR-based readmission risk prediction model.14 The model included 24 EHR variables spanning demographiccharacteristics (age, sex, race/ethnicity, primary payer), utilizationhistory (history of emergency department visits, hospitalizations inthe prior year), clinical characteristics (comorbidities, laboratoryvalues, vital signs) and hospital processes (hospital, acquired conditions and/or complications, length of stay, disposition status)(Appendix Table 1). We then categorized patients into quintilesof risk based on cutoffs from the original validation study.Ascertainment of Observed 30-DayReadmissionsWe ascertained 30-day readmissions from October throughNovember 2017 at the study hospital using EHR data andacross 80 hospitals within a 100-mile radius using hospitalclaims from an all-payer regional hospitalization database(North Texas Health Information and Quality Collaborative),an approach used in our previous studies.14–16,36,37Statistical AnalysisComparison of Human vs. Machine Predictions ofReadmission Risk. We compared clinicians’ predictions ofreadmission risk with the EHR model predictions bydiscrimination, agreement, net reclassification, and diagnostictest characteristics (sensitivity, specificity, and likelihoodratios).
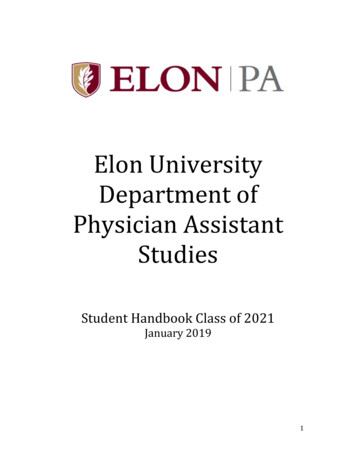
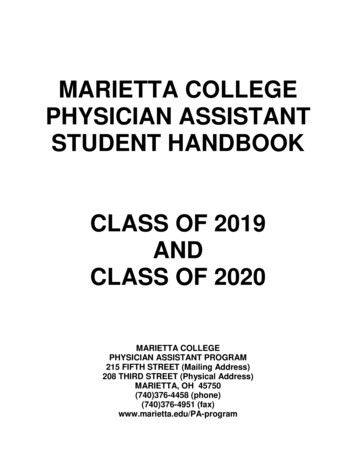
JGIMNguyen et al: Man vs Machine: Physician vs EHR Model Readmission PredictionsWe assessed discrimination using the area under the receiver operating curve (AUC or C-statistic) and conducted tests ofequality of the AUCs to compare human vs. machine. Weassessed agreement between human and machine predictionsusing unweighted kappa scores. For net reclassification anddiagnostic test characteristics, we dichotomized clinician andEHR model risk predictions into “low risk” (Likert scores 1, 2,and 3 for clinician predictions; quintiles 1, 2, and 3 for EHRmodel predictions) and “high risk” (Likert scores 4 and 5 forclinician predictions, quintiles 4 and 5 for EHR model) risk inorder to calculate net reclassification indices (NRIs), sensitivity, specificity, and positive and negative likelihood ratios.We calculated the overall NRI for clinician predictions, usingthe EHR model as the reference standard. The NRI measureshow many events and non-events (in this case, readmissions andnon-readmissions) a new model (here, clinician perceptions)correctly predicts compared with a reference model (here, theEHR model). It is mathematically defined as the sum of the netproportions of correctly reclassified persons with and without theevent of interest (i.e., the sum of event and non-event NRIs)compared with a reference model.38,39 The theoretical range ofvalues is 2 to 2 (or 200 to 200 when scaled to approximate percentages), with more positive values indicating that thenew model outperforms the reference model.We visualized diagnostic utility of predictions by cliniciansand the EHR model using leaf plots, a data visualization toolthat illustrates the usefulness of positive vs. negative testresults in correctly ruling in or ruling out a readmission respectively across a range of pre-test probabilities.40Sensitivity and Subgroup Analyses. We conducted twosensitivity analyses. First, we repeated the above analyses fora restricted cohort of inpatient hospitalizations without apreceding hospitalization in the 30 days prior to admission,to mirror the Centers for Medicare and Medicaid Servicesdefinition of ind iv id uals e xperiencing an indexhospitalization.41 Second, we repeated the above analysesincluding only hospitalizations for which attendingpredictions were available (n 1003 hospitalizations). Wefound no meaningful differences in our findings for eitheranalysis compared with the primary analysis presented here(data not shown; available upon request). We also conductedpre-specified subgroup analyses, repeating the above analysesstratified by clinician confidence (low, Likert score 1–3 vs.high, Likert score of 4–5) and reason for readmission (medicalversus non-medical) to assess whether accuracy and discrimination of clinician predictions varied by these factors.“Human-Plus-Machine” Model. To assess whetherincorporating information from both clinicians and the EHRmodel resulted in improved predictions, we developed a“human-plus-machine” model using logistic regression topredict 30-day readmissions. The model included the composite EHR model score as a single continuous predictor andclinician predictions of risk as a 5-level ordinal predictor.2557We categorized human-plus-machine model scores into quintiles of risk to allow for direct comparison with clinician andEHR model predictions and repeated the above analyses forour human-plus-machine predictions.We conducted all analyses using SAS (version 9.4, SASInstitute, Inc.) and Stata statistical software (version 16.0,Stata Corp).Role of the Funding SourceThis study was supported by the Agency for Healthcare Qualityand Research through the UT Southwestern Center for PatientCentered Outcomes Research (AHRQ R24 HS022418), theNational Heart, Lung, and Blood Institute (Nguyen, NHLBI1K23HL133441), the National Institute on Aging (Makam,NIA 5K23AG052603), and the National Center for AdvancingTranslational Sciences of the National Institutes of Health(UL1TR001105). The funding sources had no role in the studydesign, data collection, analysis, preparation of the manuscript,or decision to submit the manuscript for publication.RESULTSWe surveyed 106 clinicians on 1183 hospitalizations among1119 unique individuals. The observed 30-day readmission ratewas 20.8% (n 246). Mean age of hospitalized individuals was53.7 15.9 years, with large proportions of individuals fromminority racial and ethnic backgrounds and with charity healthcoverage, reflecting the safety-net study setting (Table 1,Appendix Table 2). Over two-thirds were hospitalized on nonteaching services. Surveyed clinicians were almost entirely physicians (n 104), with two advanced practice providers in ourcohort (Table 2). About half of clinicians were attending physicians, with a preponderance of hospitalists spanning a range ofexperience. Clinicians completed surveys for a median of 10patients (range 1–50 patients) under their care.Prediction Performance for Human, Machine,and Human-Plus-MachineDiscrimination. Both clinician and EHR model predictionshad similar discrimination (C-statistic 0.66 vs. 0.66, 95% CI0.62–0.70 vs. 0.63–0.70, p 0.91 for comparison, Fig. 1).However, there was only modest concordance betweenpredictions (56.7% agreement, unweighted kappa 0.16), dueto the differences in distribution of predictions. Clinicianpredictions were right-skewed towards more frequent predictions of lower risk while EHR predictions were left-skewedtowards high risk (Appendix Figure 2). A human-plusmachine approach had the best discrimination, with a Cstatistic of 0.70 (95% 0.67–0.74, p 0.001 for comparisonwith clinician and p 0.002 for comparison with EHR modelpredictions). The human-plus-machine model also effectivelystratified individuals across the broadest range of readmissionrisk from 12.0% in the low-risk group to 34.0% in the highrisk group (Fig. 1).
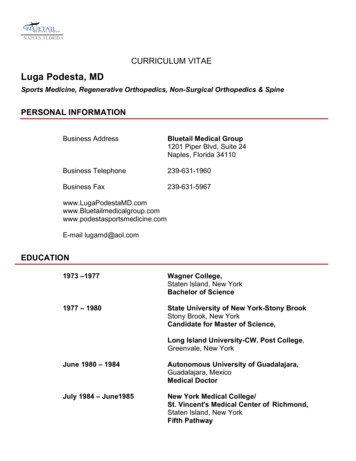
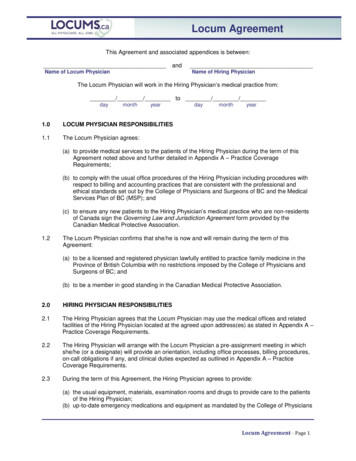
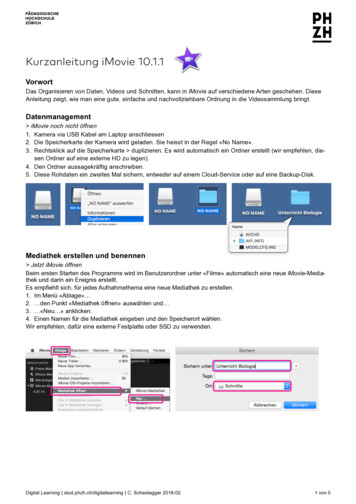
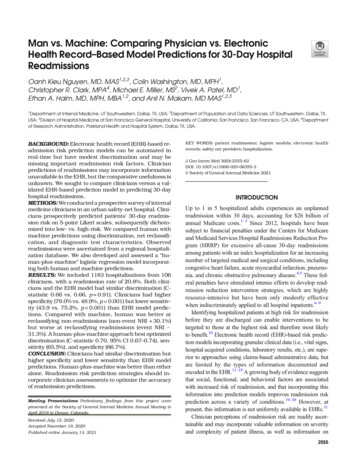
2558JGIMNguyen et al: Man vs Machine: Physician vs EHR Model Readmission PredictionsTable 1 Patient CharacteristicsTable 2 Clinician Characteristics (n 106)CharacteristicAll encounters*(n 1183)Age in years, mean (SD)Female, n (%)Race/ethnicity, n (%)WhiteBlackHispanicOtherMarital status, n (%)SingleMarriedOther†Primary payer, n (%)PrivateMedicareMedicaidCharity, self-pay, or other‡Hospitalizations in prior year, median (IQR)Non-elective admission, n (%)Non-teaching service, n (%)CMS HRRP-targeted medical conditions, n (%)Congestive heart failureAcute myocardial infarctionPneumoniaChronic obstructive pulmonary diseaseCharlson comorbidity index, median (IQR)Length of stay in days, median (IQR)Vital sign instability§ at discharge, n (%)Discharge location, n (%)HomePost-acute careHospice53.7 (15.9)514 (43.5)213 (18.0)435 (36.8)491 (41.5)44 (3.7)585 (49.5)345 (29.2)253 (21.4)60 (5.1)281 (23.8)221 (18.7)621 (52.5)1 (0–3)1171 (99.0)812 (68.6)201 (17.0)115 (9.7)11 (0.9)53 (4.5)22 (1.9)2 (0–6)3 (2–6)363 (30.7)1125 (95.1)51 (4.3)7 (0.6)CMS, Centers for Medicare and Medicaid Services; ED, emergencydepartment; HRRP, Hospital Readmissions Reduction Program; IQR,interquartile range; SD, standard deviation*Characteristics described across all hospital encounters, whichoccurred among 1119 unique individuals†Includes widowed, separated/divorced, unknown status‡Eligible individuals with “charity” and “self-pay” status had coveragethrough the Dallas County indigent health program which covers healthservices rendered at the study hospital§Defined as having at least one of the following: temperature 37.8 C,heart rate 100 beats/min, respiratory rate 24 breaths/min, systolicblood pressure 90 mmHg, or oxygen saturation 90%Net Reclassification. Compared with the EHR model,clinicians were better at reclassifying patients who were notreadmitted (non-event NRI 30.1%) but were also nearlyequally worse at reclassifying patients who had areadmission (event NRI 31.3%), with an overall NRI of 1.2 (Fig. 2). Compared with the EHR model, a human-plusmachine approach was worse at reclassifying patients whowere not readmitted (non-event NRI 12.3%) but better atreclassifying patients who had a readmission (event NRI 21.5%), with an overall NRI of 9.3 (Fig. 2).Diagnostic Characteristics. Compared with the EHR model,clinician predictions of readmission risk had much higherspecificity (79.0% vs. 48.9%, p 0.001) but lower sensitivity(43.9% vs. 75.2%, p 0.001). Because of the high specificity,clinician predictions had a higher positive likelihood ratio (2.1vs. 1.5) and were of higher diagnostic utility in ruling inreadmissions than EHR model predictions (Fig. 3). Humanplus-machine predictions had the best balance betweenCharacteristicSpecialty*Hospital medicineGeneral internal medicineOther medicine subspecialtyInternal medicine traineeClinician typeAttending physician facultyAdvanced practice provider (NP or PA)Resident or fellow†InternFemaleYears since graduation‡0–45–910–1415–1920 n (%)46 (43.4)6 (5.7)3 (2.8)51 (48.1)53 (50.0)2 (1.9)20 (18.9)31 (29.3)43 lties assigned only for attending physicians and/or advancedpractice providers†Two fellows were included in this grouping‡Denotes years since graduation from medical or professional schoolmaximizing sensitivity (65.5%, 95% CI 59.1–71.4%) andspecificity (66.7, 95% CI 63.6–69.7%), and consequentlyhad the best balance of diagnostic utility for both ruling in(positive likelihood ratio 2.0, 95% CI 1.7–2.2) and ruling outreadmissions (negative likelihood ratio 0.5, 95% CI 0.4–0.6)(Fig. 3).Human Vs. Machine Predictions by ClinicianConfidence and Reason for ReadmissionWe found no differences between clinician and EHR modelpredictions in terms of discrimination when predictions werestratified by high vs. low clinician confidence in predictions(Appendix Table 3). Both the clinician and EHR model hadpoor discrimination for low-confidence predictions (C-statistic0.59 vs. 0.62, 95% CI 0.53–0.64 vs. 0.57–0.68, p 0.35), andimproved but similarly modest discrimination for highconfidence predictions (C-statistic 0.70 vs. 0.70, 95% CI0.65–0.74 vs. 0.65–0.75, p 0.86). The human-plus-machinemodel had better discrimination than either clinician or EHRmodel predictions across both high- and low-confidence clinician predictions (C-statistic 0.74, 95% CI 0.69–0.78 forhigh-confidence predictions, p 0.006 for comparisons toboth human and machine; C-statistic 0.65, 95% CI 0.60–0.70 for low-confidence predictions, p 0.01 for comparisonwith human, p 0.20 for comparison with machine).Clinicians identified medical illness as the main potentialreason for readmission for 75% of discharges. In this subgroup(n 887), our findings were similar to the overall analysis(Appendix Table 4). However, when clinicians identifiednon-medical issues as the main potential reason for readmission (n 296), the EHR model had slightly better discrimination, similar accuracy, and slightly better sensitivity and specificity compared with clinician prediction. However, thehuman-plus-machine model still had the best discriminationin this subgroup, with a C-statistic of 0.74 (95% CI 0.68–0.79)and the best balance between sensitivity and specificity.
JGIMNguyen et al: Man vs Machine: Physician vs EHR Model Readmission PredictionsPrediction performanceC-statistic (95% CI)aObserved readmissions, %Low risk groupbHigh risk groupbHuman (Clinician)Machine (EHR Model)Human Machine0.66 (0.62-0.70)0.66 (0.63-0.70)0.70 (0.67-0.74)15.735.412.128.512.034.02559Fig. 1 Prediction performance of human, machine and human-plus-machine predictions. CI, confidence interval; EHR, electronic healthrecord; NRI, net reclassification index ap value for human vs. machine comparison 0.91; p value for human vs. human machinecomparison 0.001; p value for machine vs. human machine comparison 0.002 bFor clinician predictions, “low risk” defined as Likert scalescores of 1–3 and “high risk” defined as scores of 4 or 5. For EHR model predictions, “low risk” defined as those in the lowest three quintiles ofrisk and “high risk” defined as those in the highest two quintiles of risk using cutoffs from our original validation study.14DISCUSSIONIn a head-to-head comparison of clinician versus automatedEHR-based predictions for 30-day hospital readmissions, wefound that contrary to our hypothesis, both clinicians and theEHR model had similarly modest discrimination forreadmissions, though each strategy had unique strengths andblind spots. The EHR model was better at predicting whowould be readmitted but overestimated readmission riskA. Human vs. MachineaNRI†Event NRIb, %Non-event NRIb, %-1.2-31.3 30.1overall (i.e., high sensitivity but low specificity), while clinicians were better at predicting who would not be readmittedbut underestimated readmission risk overall (i.e., high specificity but low sensitivity). A human-plus-machine approachincorporating clinician predictions as a variable in the EHRmodel had significantly better discrimination and also bestoptimized sensitivity and specificity. In other words, humanplus-machine was better than either alone in terms ofpredicting 30-day hospital readmissions.B. Human Machine vs. Machine Onlya 9.321.5-12.3Fig. 2 Net reclassification for human and human-plus-machine predictions. NRI, net reclassification index. aDenotes the reference model for thedescribed comparison. For panel A, clinician (“human”) predictions are compared with EHR model (“machine”) predictions as a reference; forpanel B, a human-plus-machine predictions are compared with EHR model predictions as the reference standard. bOverall NRI is the sum ofthe event (readmissions) NRI and non-event (non-readmissions) NRI (i.e., the sum of the net proportions of correctly reclassified persons withand without the event of interest, respectively). For example, in panel A, 9.3% of readmissions (solid teal bar) were missed by the EHR modelbut correctly predicted by clinicians. However, 40.7% of readmissions were missed by clinicians but correctly predicted by EHR model. Thus,overall clinicians were 31.3% worse than the EHR model in correctly predicting readmissions (event NRI 9.3 40.7 31.3). The blacksolid and hatched bars can be similarly interpreted to arrive at the non-event NRI, which indicates that clinicians were overall 30.1% betterthan the EHR model at predicting non-readmissions. The overall NRI is the sum of the event NRI ( 31.3%) and the non-event NRI ( 30.1%),which for panel A is equal to 1.2%. In other words, clinicians were overall about 1.2% worse at correctly classifying readmissions and nonreadmissions compared with the EHR model, with most of this difference attributable to clinicians failing to predict readmissions that werecorrectly identified by the EHR model.
2560JGIMNguyen et al: Man vs Machine: Physician vs EHR Model Readmission PredictionsSummary statisticSensitivitya, %Specificityb, %Positive likelihood ratiocNegative likelihood ratiodHuman (Clinician)Machine (EHR Model)Human Machine43.9 (37.6-50.4)79.0 (76.2-81.5)2.1 (1.7-2.5)0.7 (0.6-0.8)75.2 (69.3-80.5)48.9 (45.6-52.1)1.5 (1.3-1.6)0.5 (0.4-0.6)65.5 (59.1-71.4)66.7 (63.6-69.7)2.0 (1.7-2.2)0.5 (0.4-0.6)Fig. 3 Diagnostic test characteristics of human, machine, and human-plus-machine predictions. CI, confidence interval; EHR, electronic healthrecord; NRI, net reclassification index. Leaf plots illustrate the usefulness of positive vs. negative predictions by clinicians (human), the EHRmodel (machine), and a human-plus-machine prediction model in correctly “diagnosing” a readmission across a range of pre-test probabilities.The impact of a positive prediction is shown by the shaded area above the diagonal red line and the impact of a negative prediction is shown bythe shaded area below the diagonal red line.40. aSensitivity defined as the probability that an individual who was readmitted had a “high-risk”prediction. bSpecificity defined as the probability that an individual who was not readmitted had a “low-risk” prediction. cPositive likelihoodratio defined as the probability of a “high-risk” prediction in those who were readmitted divided by the probability of a “high-risk” predictionin those who were not readmitted—i.e., sensitivity/(1-specificity). dNegative likelihood ratio defined as the probability of a “low-risk” predictionin those who were readmitted divided by the probability of a “low-risk” prediction in those who were not readmitted—i.e., (1-sensitivity)/specificity.Our findings have several implications for hospitals andhealth systems developing workflows to identify and targethospitalized patients at risk for 30-day readmissions. Hospitalswith limited care transitions resources or lacking real-timepredictive analytic capabilities could opt for a “human-only”approach to reducing readmissions, where readmission reduction interventions would be targeted to patients who wereidentified as being at high-risk for readmission by their inpatient physicians using a 1-question screening tool that could beembedded directly into an EHR. Resources would thus beallocated to those most likely to potentially benefit fromintervention, though many high-risk patients would be missedas a tradeoff of this approach. Hospitals for whomreadmissions reduction is a high priority—and who haveactionable, predictive analytic resources—could consider a“human-plus-machine” approach to target a larger number ofpatients for intervention, though some patients identified inthis approach may be less likely to be readmitted, and thusmay benefit less from intervention.There are several potential reasons why clinicians were notbetter at predicting readmissions compared with the EHRmodel. First, clinicians may be overly optimistic when prognosticating readmission risk in general, as this phenomenonhas been observed for prognostication in other areas.42–44Second, clinicians may have an optimism bias for the boththe effectiveness of their care on readmission risk, and also fortheir own patients’ ability to avoid readmission compared withother patients in general.45,46 Third, readmissions may bechallenging to predict for both humans and machines due tothe breadth and varying influence of social, behavioral, environmental, financial, medical and structural factors on readmission risk.12,22,23,25,28,30,47–57 Lastly, clinicians’ frameworkfor thinking about readmission risk may not incorporate social,functional, and behavioral factors, since these readmission riskfactors are novel and may not be well integrated in currentclinical curricula and continuing medical education.58–60 Tothis end, we found that clinicians performed somewhat worsethan the EHR model at predicting readmissions if they identified non-medical issues as the main potential reason for readmission, versus medical illness where clinicians were moreproficient prognosticators. This directly contradicted our initial study hypothesis that physicians would be better able topredict readmissions due to increased awareness of patientsocial, behavioral, and situational factors not captured as wellin EHR data.Our study had certain limitations. First, this was a single sitestudy of patients hospitalized over 1 month. However, ourcohort of both patients and clinicians is large and represents adiverse population with a wide range of clinical, social, functional, and behavioral needs. Additionally, we ascertainedreadmissions from hospitals wit
tiles of risk to allow for direct comparison with clinician and EHR model predictions and repeated the above analyses for our human-plus-machine predictions. We conducted all analyses using SAS (version 9.4, SAS Institute, Inc.) and Stata statistical software (version 16.0, Stata Corp). Role of the Funding Source