Transcription
Improving andExpanding Austin’sHousing SupplyRecommendations by the CRE Consulting CorpsAPRIL 2022
IMPROVING AND EXPANDING AUSTIN’S HOUSING SUPPLY CITY OF AUSTIN MINNESOTAContentsExecutive Summary .3Prologue .5Economic and Demographic Trends – Austin .6Description of the Housing Market . 11New Construction Single-Family Residential. 16Finished Single-Family Lots. 16Lot pricing . 16Estimated cost to deliver new finished lots . 17Hard Costs . 17Soft Costs and Miscellaneous Fees . 17Raw Land Costs. 17Plats – Conclusions . 18New Construction Single-Family Houses . 18Existing Single-Family Residential Owner-Occupant Market . 22Single-Family Rental Market . 26New Construction Multifamily Residential . 29Housing and the Local Economy. 30Conclusions and Recommendations . 32Appendix I - Current Single-Family Residential Government Assistance Programs . 34Existing Single-Family Housing Assistance Programs -Grants/Exemptions . 35Austin Home Initiative, 5-Year Tax Exemption . 35Austin Utilities Conserve and Save Rebate Program . 35Weatherization Assistance Program . 35Existing Single-Family Housing Assistance Programs - Loans . 36Austin/Mower County Home Ownership Fund . 36Minnesota Down Payment Assistance program . 36Minnesota Plat Law . 37Rehab/Emergency Loan -SEMCAC . 371
IMPROVING AND EXPANDING AUSTIN’S HOUSING SUPPLY CITY OF AUSTIN MINNESOTAAustin HRA . 37HRA Community Housing Improvement Program I - Health & Safety . 37HRA Community Housing Improvement Program II - Remodels . 37Minnesota Housing Finance Agency Fix Up Fund Home Improvement Loan . 37Minnesota Housing Finance Agency Home Energy Improvement Loan . 38Appendix II – Single-Family Residential Rehabilitation Programs in Other Cities . 39Appendix III – Acknowledgements . 40Appendix IV – The Counselors of Real Estate and CRE Consulting Corps . 41Appendix V – Austin Minnesota CRE Consulting Corps Team . 42Appendix VI - Resources . 452
IMPROVING AND EXPANDING AUSTIN’S HOUSING SUPPLY CITY OF AUSTIN MINNESOTAExecutive Summaryconstruction since 1970, and much of the oldersingle-family stock needs repair or replacement ofThe Counselors of Real Estate (CRE )major building components in order to remainConsulting Corps was asked by the City of Austinfunctional, competitive, and attractive toto conduct research, provide analysis, and makehomebuyers.comments and recommendations pertaining tothe current single family and multifamilyOur analysis finds Austin needs 25 to 30 newhomeownership and rental housing markets. Thehouses, 30 to 40 new multifamily units, and 170CRE Consulting Corps team visited Austin insingle-family rehabilitations per year, just toearly November 2021. This report is the result ofreplace aggregate depreciation of the existingthat assignment and analysis. This report analyzesstock. With current new single-familythe following housing sectors:development of approximately 12 per year and 85rehabs per year, an additional 15 new single-oNew construction single family and platfamily houses and 80 rehabs are needed annually.developmentIf population and employment grow, even moreoExisting owner-occupied single familyunits will need to be built and renovated.oExisting single-family rentalsoNew construction multifamily rentalsThe Consulting Corps recommends that the Cityof Austin:Our analysis of the Austin housing marketfocuses on unsubsidized “market-rate” housingoImplement programs to encourage andwith limited consideration of subsidized or publicincentivize renovations of existing single-housing or housing provided by charitable orfamily homes.religious organizations.oMarket the community amenities, lowcosts and existing opportunities to single-Our work is based on a review of Austin’s historyfamily builders developing homes inand current economic situation, collection andnearby Minnesota communities toanalysis of State and local statistics and housingencourage single-family development.program information, in person and phoneoTrack the single-family rental stock moreinterviews with more than 25 communityclosely and initiate performance andstakeholders, including developers, lenders,benchmarking to help improve qualityproperty managers, City Council members, andand modernize the inventory.cost and market information on new constructionoEngage owners of multiple rental units toand income and expense information on rentaladdress housing quality, and develop aproperties.strategy to physically preserve andenhance this segment of the housingAustin has had recent success in attracting twonew multifamily rental developments. But, therehas been relatively little new single-family3stock.oConsider establishing a formal structuredhousing planning process including
IMPROVING AND EXPANDING AUSTIN’S HOUSING SUPPLY CITY OF AUSTIN MINNESOTAgovernment, residents, and employers. Adedicated staff hire by the City, such as aHousing Director should be considered tospearhead efforts and establish actionablegoals. In the absence of a dedicated staffhire, the community should consider anindependent housing commission orcommittee with a budget for staff orconsultants to provide strategic andoperational support.The work detailed in this report will requirefocus, research, and participation by allcommunity sectors. An active planning effortsupported by broad involvement and solidresearch is likely to be beneficial to all parties andprovide the housing options and tenure that isneeded within the community.4
IMPROVING AND EXPANDING AUSTIN’S HOUSING SUPPLY CITY OF AUSTIN MINNESOTAProloguesince 1970, and much of the older single-familyhousing stock needs repair or replacement ofThe current housing situation in Austin is notmajor building components in order to remainunlike that of communities around the country,functional, competitive, and attractive towhich have seen a dramatic rise in constructionhomebuyers.costs and an increased need for multifamily andattached housing of higher density and economy.While this common thread runs through thehousing market in Austin, there are discrete andunique housing assets, challenges, andopportunities in Austin.Austin has robust physical, educational, andcultural assets and infrastructure. Streets, utilities,and parks are in excellent condition, education iswell-funded, and the community has significantcultural and recreational offerings. Thesecommunity resources are attractive, and theadditional capacity within the community’sinfrastructure could benefit and support a largenumber of new housing units.Austin has had considerable recent success inattracting new market-rate multifamily rentalhousing, with 82 new units added in 2020 and 91new units currently under construction at the startof 2022. Austin enjoys an ample supply of existingsingle-family houses at relatively affordable pricepoints for the community. Austin also has a wellmanaged and well-funded housing authority thatsupports the community’s supply of rentrestricted and subsidized housing and rentalvouchers, which enjoy very high occupancy anddemand.New multifamily rental housing been built in thelast few years has been successful, with fulloccupancy and a wait list. There has beenrelatively little new single-family construction5
IMPROVING AND EXPANDING AUSTIN’S HOUSING SUPPLY CITY OF AUSTIN MINNESOTAEconomic and Demographiccyclical than durable goods manufacturing (likeTrends – Austindishwashers) or transportation manufacturingForecasting future demographic, economic, andHormel’s revenues grew about 6% per yearemployment trends for Austin is challenging andbetween 2011 and 2014. Between 2015 and 2020,dependent on a concentration of economic andgross revenues were extremely stable, onlycommercial activity. Austin’s economy isfluctuating up or down by a few percentageanchored by Hormel Foods, whose corporatepoints every year. With recent acquisitions,headquarters and largest plant are within Austinincluding Planters, it is expected that totalcity limits. When analyzing the economics of thecompany revenues will be significantly higher forcommunity, this concentration makes Austin2021 and 2022.similar to Rochester, which also has one largedominant employer. Of the 25 largest privateemployers in Minnesota, all but two are located inthe Minneapolis/St. Paul area: Hormel and theMayo Clinic. Traditionally, most small cities withpopulations of 25,000 to 100,000 do not have thiskind of economic concentration and are thereforemore tied to regional and national growth trends.Growth in Austin and Rochester are directly tiedto food production and medical services,respectively, with less influence from regionaleconomic trends, growth rates, and adjacenteconomic drivers. These two large employershave national footprints and are influenced bynational consumer demands and trends, whichimpact the local economy in Austin. Both foodprocessing and healthcare are relatively stablesectors of the economy. Therefore, compared with(like airplanes). Following the great recession,Hormel’s annual reports show an expandingnational and international footprint. In the pastfive years they have constructed five newmanufacturing plants and added eight moreplants through acquisitions. In the previous fiveyears they acquired five more plants. They areexpanding their sales into emerging markets,including Brazil and China. Their in-house salesand marketing team is deep, with over a thousandemployees. In 2019, they initiated modernizationof their information technology systems inconjunction with Oracle. Hormel HR executivesindicated that with more acquisitions, greatersales, and new focus on IT and e-commerce, largernumbers of technical and marketing positions willbe required. More productive processing plantswill also require more engineers and technicians.most other jurisdictions in the country of similarThe labor force includes those employed andsize, the Austin and Rochester economies need tothose without jobs who are currently seekingbe viewed in light of national trends for foodemployment; it is a measure of the short-termproduction and healthcare, as well as projectionssupply of labor. Mower County saw a significantfor these two specific firms: Hormel and the Mayodecrease in the labor force following the GreatClinic.Recession. However, since 2014, the labor forceCompared with other manufacturing industries,food processing is relatively stable and much less6has only grown half as fast as the state average.
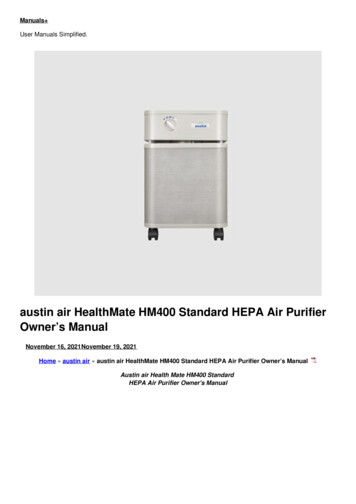
IMPROVING AND EXPANDING AUSTIN’S HOUSING SUPPLY CITY OF AUSTIN MINNESOTAThe graph below shows the actual number of jobs,which is the short-term demand for labor. Thelarge decline following 2019 represents the shortterm impact of the COVID-19 global pandemic.The green line shows the number of jobs by yearin Mower County between 2005 and 2019, whichshows some volatility over time. The graphindicates a relatively stable number over the longterm, especially considering the size of the county7relative to the state as a whole. We would expectto see a lot of up-and-down movement year byyear, solely because of the small population ofMower County, not because of the types of jobshere. Because of the small size of the Austin labormarket, small changes to individual employers(up or down) impact the statistics in outsizedways.
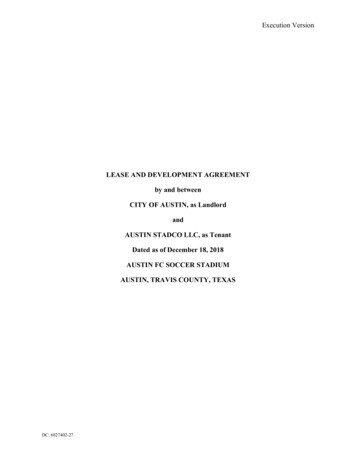
IMPROVING AND EXPANDING AUSTIN’S HOUSING SUPPLY CITY OF AUSTIN MINNESOTAThe exhibit below describes regional employmentadministrative (16,000), manufacturing andprojections from the Minnesota Department ofproduction (10,000) and transportation (7,600).Employment and Economic Development. TheAttracting new staff to replace those retiring willdata covers the Southeast Minnesota Planningbe an important goal for the Austin communityRegion and on average, the largest increase in theover the next decade, and possibly morenumber of jobs by industry between 2018 to 2028important than increasing the total number ofis expected in healthcare, at 12.6%. The right-handjobs.portion of the chart indicates the number of jobsby industry that will need to be filled by 2028 dueAttracting new staff to replace thoseto retirements. Those absolute numbers are veryretiring will be an important goal for thelarge, not only in healthcare (14,000), but also inAustin community over the next decade.sales and marketing (13,000), office and8
IMPROVING AND EXPANDING AUSTIN’S HOUSING SUPPLY CITY OF AUSTIN MINNESOTAOn an absolute basis, and as a percentage ofThe broad discussion above provides someincome, housing in Mower County is relativelyperspective on future economic, demographic,affordable, both for for-sale and rental units. Theand housing trends in Austin and Mower County.median monthly costs for the owner of a single-Given Hormel’s national and internationalfamily house in Mower County is 1,129 percorporate footprint, and their continued capitalmonth, or 28% below the statewide median.reinvestment, acquisition strategy, and projectionsMedian monthly rental costs are 716 a month, orfor slow but steady growth in their historical27% below the state median. As a percentage ofmarkets and product lines, it is likely that theirincome, the fact that 40.8% of Mower Countydemand for administrative, marketing,renters are spending more than 30% of householdengineering and technical staff will increase,income on rent is an area for concern. However,possibly faster than in the past 20 years.that is 9% below the statewide average of 45.1%.Furthermore, based on state projections, there willbe significant turnover in production, office, andFannie Mae and Freddie Mac record averagesales jobs between now and 2028 due tohouse sales prices by county and state. Their long-retirements.term data show that house prices statewide grew215% in the 30-year period between 1990 and 2020and 95% in the 20-year period between 2000 and2020. This results in an annual growth ofapproximately 7% per year and adjusting forinflation, results in an annual growth ofLikely growth in both retirees and newjobs will result in more demand forAustin’s relatively fixed supply ofhousing.approximately 4% per year. By comparison,Mower County saw growth rates about half that,Since Austin has relatively affordable rents andat 121% between 1990 and 2020 and 39% betweenhouse prices, it is likely that a large percentage of2000 and 2020. Adjusting for the cost of living,employees who retire after working in Austin willMower County effectively saw falling real housestay in Austin. Second, growth anticipated inprices.administrative, marketing, engineering, andtechnical jobs will increase the demand for new9
IMPROVING AND EXPANDING AUSTIN’S HOUSING SUPPLY CITY OF AUSTIN MINNESOTAmultifamily and single-family housing, in bothownership and rental tenures. This likely growthin both retirees and new jobs will result in moredemand for Austin’s relatively fixed supply ofhousing, leading to increased growth in salesprices and rental rates, significantly higher thanthose rates experienced over the past 20 years. Itshould also attract production of new for-rent andfor-sale housing.10
IMPROVING AND EXPANDING AUSTIN’S HOUSING SUPPLY CITY OF AUSTIN MINNESOTADescription of the HousingMarketOur analysis of the Austin, Minnesota, housingmarket mainly focuses on traditional market-ratehousing with limited consideration of the marketfor subsidized housing built with Affordablehousing programs. We have not analyzed thecurrent situation for subsidized or public housing,income restricted housing supported by LowIncome Housing Tax Credits (LIHTC), or housingprovided by charitable or religious organizations.In terms of building type, 77% of all residentialHousing by Type and TenurePhysical TypeSingle FamilyAttached/MultifamilyTotalTenureOwner OccupiedRentedTotalSingle Family Units OnlyOwner 74564%36%60241,5067,53080%20%2017 Maxfield Researchhousing units within Austin are single-familydetached houses, and the remaining units areReal estate markets are unlike traditional financialmultifamily residential, including duplexes.markets, since buildings last much longer thanRecent additions to the housing stock in Austinone or two economic cycles. Therefore, it ishave included a multifamily rental project of 82important to look back in history for insights intoapartment units completed in 2020 and anotherthe current supply and demand for housing.multifamily rental project of 91 apartment unitsAustin saw strong population growth everywhich started construction in 2022. In terms ofdecade from 1890 to 1960. Between 1960 and 1990,owner occupancy versus rental tenure, 64% of allthe population dropped by more than 20%. Sinceresidential units are owner-occupied and 36% are1990, gradual growth of about 0.5% per year hasrenter-occupied. Of all the single-family houses inbrought the population to 26,000. TotalAustin, approximately 80% are owner occupied,employment in Austin has been very stable overand about 20% are rented.the past 20 years, fluctuating between 19,000 and20,000.11
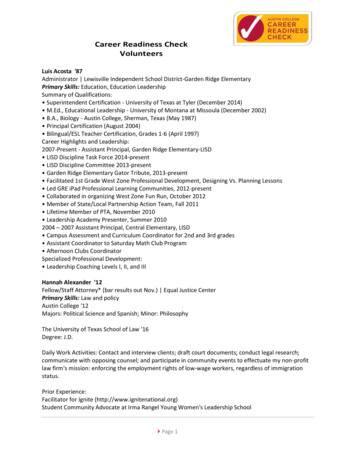
IMPROVING AND EXPANDING AUSTIN’S HOUSING SUPPLY CITY OF AUSTIN MINNESOTANumber of New Houses BuiltAustin Population and New Single Family Houses by 10,0005005,000001890 1900 1910 1920 1930 1940 1950 1960 1970 1980 1990 2000 2010DecadeNew Single Family HousesCity of Austin PopulationThe chart above illustrates Austin’s population inMower County exhibits a very different patterneach of the decades since 1890 and overlays thiscompared to the state as a whole. Below is a graphwith the number of new single-family housescomparing the age of houses in Mower Countyconstructed each decade. As population peaked inrelative to the state as a whole. The state as athe 1960s, new single-family housing starts fell towhole saw housing construction peak in the twoonly 300 houses that decade, down from 2,300 indecades from 1980 to 1999. By comparison,the prior decade. Prior to the disruption caused byMower County saw peak development betweenthe Great Recession, new single-family starts were1940 and 1959.consistent at about 300 per decade. Following theGreat Recession, there have only been about 10new single-family houses constructed every year.12
IMPROVING AND EXPANDING AUSTIN’S HOUSING SUPPLY CITY OF AUSTIN MINNESOTAThe following two exhibits show the number of1960 and 2000. The majority of these 10 houses pernew single-family houses per year and newyear have been custom built for a buyer who signsmultifamily units per year from 2000 to 2021.a purchase contract prior to the start ofAfter the Great Recession, from 2010 onward, newconstruction (often called custom homes), notsingle-family housing starts averaged about 10houses speculatively developed by the builder forper year, or about 100 per decade. That rate ofresale.new supply is one-third of the rate seen betweenAustin New Single Family Houses, 2000 to 202160Great Recessionfrom 3Q 2008to 2nd Q 2009504030201002000 2001 2002 2003 2004 2005 2006 2007 2008 2009 2010 2011 2012 2013 2014 2015 2016 2017 2018 2019New Single Family Residential UnitsAustin New Multifamily Units, 2000 to 2021180160140120100Great Recessionfrom 3Q 2008 to2nd Q 2009806040200New Multifamily Residential Units13
IMPROVING AND EXPANDING AUSTIN’S HOUSING SUPPLY CITY OF AUSTIN MINNESOTAHouses constructed prior to 1980represent 90% of all single-familyhouses .Therefore, any strategiesmaterials. This baseline analysis assumes nogrowth in employment or population in order tosimplify the model. The result shows that Austinwould need 27 new houses built each year andintended to improve the housing stock168 rehabilitations of older houses to compensatein Austin needs to explicitly consider thisfor the annual deterioration of the housing stock.large existing supply of older singlefamily residences.About 12 new houses per year have beendeveloped or are under construction in Austin for2021 and 2022. Our analysis indicates that 15The chart “Austin Population and New SingleFamily Houses by Decade” on page 12 showssingle-family houses by age. Together, thesehouses represent 77% of all residential units inAustin. This shows that the average single-familyhouse in Austin is 70 to 80 years old. Thus, theaverage residential unit in Austin is fairly old andadditional new houses per year are needed, abovethe current baseline of 12 per year, plus 80 to 90single-family residential rehabilitation projectsaveraging 30,000, assuming an existing baselineof 80 rehabs per year. Additional supply abovethese baselines will be needed if the City’spopulation grows.subject to a fair amount of physical deteriorationand functional inefficiencies. Houses constructedprior to 1980 represent 90% of all single-familyhouses and 72% of all residential units, inclusiveof single-family and multifamily units. Therefore,Austin would need 27 new houses builteach year and 168 rehabilitations ofolder houses to compensate for annualdeterioration of the housing stock.any strategies intended to improve the qualityand quantity of the housing stock in Austin needsto explicitly consider this large existing supply ofolder single-family residences.If Austin sees a sharp increase in the total numberof jobs, regional averages would support about4.5 to 6 new housing units for every 10 new jobs,Given the prominence of the existing stock ofbeyond the baseline replacement housing unitssingle-family housing in the Austin housingestimated above.supply (77% of all units), an aggregatedepreciation analysis is an important tool inunderstanding the impact of an aging housingstock on the overall market. The analysis looks atthe number and age of the existing single-familyhousing stock in order to estimate the annual lossin value of the existing housing stock due tophysical deterioration and older designs and14Austin is developing about 12 new homes peryear for 2021 and 2022, a level that is short of ourestimated demand by 15 homes. Additionally, thecity of Austin has about half the number of singlefamily residential rehabilitation projects needed tomeet demand.
IMPROVING AND EXPANDING AUSTIN’S HOUSING SUPPLY CITY OF AUSTIN MINNESOTAAggregate Depreciation Analysis: Single Family Residential Housing MarketInputs in yellowSingle Family Residential Market, AustinAggregate Depreciation AnalysisTotal Single Family Residential Units in CitySingle Family Replacement Cost New, Pre 1990 HousesSingle Family Replacement Cost New, Post 1990 HousesLower value limit for standing housesAverage Lot ValueStraight Line Single Family Depreciation7,892 270,000 340,000 95,000 35,00055YearsCost of Single Family Residential RehabYear% of totalAggregateBuiltHousesReplacementCost New 30,000DepreciatedAggregateValue% ofReplacement CostNew Remaining 00's2010's2020's21%14%17%29%4%4%2%4%4%1%0.1% 440,640,000 306,990,000 363,150,000 625,860,000 84,780,000 78,570,000 46,710,000 77,490,000 76,140,000 28,080,000 3,740,000 2,132,150,000AverageAssessedValueAssessedValue LessLand 87,431 89,698 99,387 139,275 189,276 200,767 243,058 278,955 276,350 289,455 400,000 52,431 54,698 64,387 104,275 154,276 165,767 208,058 243,955 241,350 254,455 365,000 85,567,479 62,191,777 86,600,582 241,709,421 48,442,563 48,238,161 35,993,965 70,015,068 68,060,736 26,463,296 4,015,000 777,298,047Aggregate Current Depreciated SFR ValueAnnual Depreciation, per year, straight line19%20%24%39%57%61%77%90%89%94%107%36% 14,132,692Loss of aggregate Single Family Residential value per yearNew Single Family Residential Replacement CostCurrent addition to supply 340,000 4,080,000Assuming 12 Single Family Houses per year based on past 5 yearsCurrent Shortfall per yearShortfall of new Single Family Houses per year (over baseline), assuming no rehabsMajor RehabRehabs per year if 50% of Depreciation is RehabAdditional Single Family's per yr if 50% of Depreciation is RehabTotal Needed New Single Family's and Rehabs143182 10,052,69230 30,00016815182Rehab Shortfall 5,026,346New Single Family Residential Shortfall 5,026,346% of existing Single Family Houses Rehabbed per year 2.1%Total # of Single Family Residentials divided by Straight Line Depreciation EstimateBiased downward since so many of the houses are olderModel OutputUnits per Year of reinvestment, assuming 50% of annual new supply are rehabs and 50% is new constructionSource: County Assessor. Some figures differ from Census data used elsewhere in this report. 7,892 includes somehouses that that were not built in 2017. Inputs are in yellow.15
IMPROVING AND EXPANDING AUSTIN’S HOUSING SUPPLY CITY OF AUSTIN MINNESOTANew Construction Single-FamilyNature Ridge PhasingTotal # ofPlattedLots# of LotsRemaining*Finished Single-Family LotsNature RidgePhase andCompletionDateThe inventory of new single-family house lots inPhase 1 – 2007471Austin has remained relatively low for years. ThePhase 2 – 2021133Phase 3 –Underconstruction20222610Phase 4 - TBD12-14NAResidentialabsorption of house lots by house builders hasalso been slow during this time. In the past 18months, there has been an increase in demand forhouse lots, evidenced by recent lot absorption,new house starts, and increased lot pricing.Two subdivisions delivered the majority of newlots in the past 15 years: Meadows in the* Counts and lot details provided by thedevelopersouthwest part of Austin and Nature Ridge in thenortheast area. Both are within city limits, andadjacent land is available for future expansion.Meadows, located along 29th Street SW, delivered42 lots in 2008. There remain 7 vacant finished lots(1 single family lot and 6 townhome lots), andthese remain under the ownership of the originaldeveloper. The developer has additional adjacentland under site control to the west and can bringabout 173 lots to market as demand warrants, butannexation will be required.The two subdivisions discussed above have 21remaining lots for future homes, 6 of which aretownhouse lots. Given the very long absorption ofthe first phases of Meadows and Nature Ridgeand the much faster absorption of Phases 2 and 3of Nature Ridge in recent years, the Austinmarket looks to be under supplied in finished l
Improving and Expanding Austin's Housing Supply Recommendations by the CRE Consulting Corps APRIL 2022