Transcription
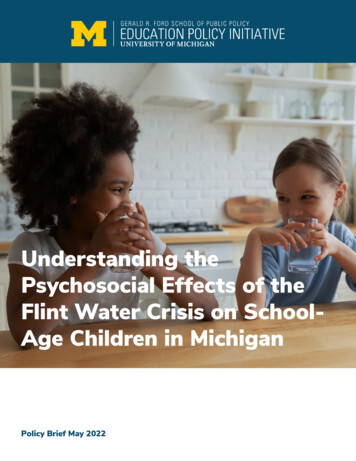
Understanding thePsychosocial Effects of theFlint Water Crisis on SchoolAge Children in MichiganPolicy Brief May 2022
Understanding thePsychosocial Effects of theFlint Water Crisis on SchoolAge Children in MichiganAuthorsPolicy IssueSam TrejoIn early 2016, the Flint Water Crisis captured national attention;major news outlets reported that the city’s tap water had beencontaminated with lead since April of 2014. While Flint residentsalerted officials about the changes to their drinking water, cityand state officials insisted that the water was safe. A landmarkstudy on children in Flint published in 2016 demonstrated thatthe fraction of children identified with blood lead levels above theCDC’s acceptable threshold (5 µg/dL) roughly doubled from 2.5%to 5%, with the greatest increases in neighborhoods with highestwater lead levels. Given the well-documented detrimental effectsof lead exposure in early childhood on cognitive development,many worried that the academic progress of Flint's youngestresidents may have been impacted. While several years havepassed since Flint's water crisis garnered national headlines, theneed to improve substandard infrastructure remains salient.Also, over the past few years, important data has becomeavailable, allowing researchers to rigorously study and measureimpacts of the lead water crisis on children in Flint.Princeton UniversityGloria YeomansMaldonadoUniversity of TexasBrian JacobUniversity of MichiganSamuel OwusuUniversity of MichiganThank you to Dr. Mona Hanna-Attisha for her expertise on the Flint Water Crisis and helpful comments during the writingof the working paper. The authors would also like to thank Dr. Paula Lantz, Health Policy Professor at the Ford School,Thomas Ivacko, Executive Director of the Center for Local State and Urban Policy (CLOSUP), Nicole Wagner Lam and theEPI staff team for helpful comments while editing the policy brief.EPI Policy Brief May 2022Page 1
Key FindingsFor the very first time, report authors Jacob, Trejo and Yeomans-Maldonado matchstudent-level longitudinal data from Michigan and data from household-level service lineinspections conducted by Flint’s Fast Action and Sustainability Program to examine howthe Flint Water Crisis affected school-age children's academic outcomes. Collectively,the findings provide some insight into the ways in which experiencing a communitycrisis profoundly affected the educational trajectory of Flint children. The study drawsthree noteworthy conclusions.1Overall, average math achievement for school-age children in Flintdecreased noticeably during the time of the Flint Water Crisis. Whencompared to students in Michigan districts with similar characteristicsto Flint, researchers found a 0.14 standard deviation decrease in mathachievement for school-age children in Flint, an effect size consideredmoderate.2The proportion of school-age children with special needs increased inFlint as a result of the water crisis. Compared with districts similar toFlint, the crisis led to a 9% increase in the proportion of students withqualified special educational needs. Special needs designation rates in Flintwere increasing before the crisis, and the water crisis led to a morepronounced increase relative to other similar districts (see figure 1).3There was little difference in the academic outcomes of school-agechildren living in homes with lead pipes compared to observationallysimilar Flint children living in homes with copper pipes. This findingsuggests that lead exposure through home plumbing was not a significantcontributor to the citywide achievement effects documented.Page 2
Policy ImplicationsAs current lawmakers set out to address systemichealth inequities through improving America'sinfrastructure, the results of this study have salientimplications for education.water crisis. Because water safety is such an importantfacet of overall health, even the thought of anymeasurable contamination can reasonably sparkcommunity anxiety and create a stressful learningenvironment for a community’s youngest residents.The communal trauma experienced during a leadwater crisis can also last well beyond the height ofthe crisis. With this in mind, policy makers shouldthink proactively about how to invest in cost-effectivepreventative measures that minimize both real andperceived threats of water contamination in the future.Preventing community crises before they occur canpotentially have a profound impact on the academicprogress and general well-being of children for years tocome.First, while lead exposure is often viewed as theprimary cause for medical concern when detected incommunal drinking water, the findings add additionalevidence that community crises such as the FlintWater Crisis may have effects on health and wellbeing beyond those tied directly to exposure to leadin the water supply (Sobeck, et al, 2020). Thissuggests that lead exposure is not the only way theFlint Water Crisis disrupted the educationaltrajectories of Flint’s children. As increasedinfrastructural investments take hold across thecountry to improve water safety, policymakers mustalso consider how to address the social damage feltby communities experiencing lead water crises thatare not directly tied to lead exposure.Second, the key findings imply that student outcomesin the long run were impacted in part because thesechildren lived in a city grappling with a communityFinally, this study opens the door to continue researchefforts to better understand the full effect of Flint’s LeadWater Crises on academic outcomes for school-agechildren. As the city of Flint continues to test water inbusinesses and other public facilities for lead, more datawill become available to better understand the extent towhich lead exposure outside of the home has affectedschool-age children and their academic outcomes.Page 3
Data FindingsFigure 1 Estimates of the Effect of the Flint Water Crisis on Student OutcomesThese figures display descriptive trends in the mean academic outcomes for the Flint geographic district from 2006to 2019. Data is taken from the Michigan Department of Education’s longitudinal administrative database.Flint Compared to Districts Similar to FlintEffect of the Flint Water Crisis on Student MathAchievement Relative to Student Outcomes Outside of ement-0.3Special NeedsBefore 2015After 2015Flint Compared to Districts Similar to FlintEffect of the Flint Water Crisis on Student Special NeedsDesignation Relative to Student Outcomes Outside of Flint0.040.030.02Notes: The figures estimatethe causal effects of the FlintWater Crisis on standardizedmath academic achievementand the proportion of studentsdiagnosed with special needswithin the Flint geographicalschool district. 2015 isconsidered the first year posttreatment for the analysis. Atreatment effect of the FlintWater Crisis was estimated foreach year in the post period(2015-2019). The gray shadedarea represents the 95%confidence interval of thetreatment effect estimates.0.0195%ConfidenceInterval0.00-0.01Before 2015After 2015Page 4
Figure 2 Mean Educational Outcomes Over Time in FlintThese figures display descriptive trends in the mean academic outcomes for the Flint geographic district from2006 to 2019. Data is taken from the Michigan Department of Education’s longitudinal administrative database.Proportion of Students With Special NeedsSpecial NeedsNotes: This figure displays thedescriptive trends in SpecialNeeds designations for childrengrades K-12 in the Flintgeographic district from 2006 to2019. The gray dotted linesrepresent the time that the FlintWater Crisis begins.17.16.15.14.13Before 2015After 2015AttendanceNotes: This figure displays thedescriptive trends in averageattendance rates for childrengrades K-12 in the Flintgeographic district from 2009 to2019. The gray dotted linesrepresent the time that the FlintWater Crisis begins.Average Rate of Attendance.92.91.90.89Before 2015After 2015Page 5
Average Proportional Standardized Test ScoresMath Achievement and Reading .6-0.7-0.8Before 2015After 2015Notes: The figure displays thedescriptive trends in Math andreading achievement for thechildren grades 3-8 in theFlint geographic district from2007-2019. Math and readingachievement trends arestandardized within the testsubject, grade, and year to theoverall state distributionscores. The gray dotted linesrepresent the time that theFlint Water Crisis begins.Page 6
Figure 3 Mean Educational Outcomes Over Time in Flint by Service Line MaterialThese figures display descriptive trends in the mean academic outcomes for the Flint geographic district from 2006to 2019. Data is taken from the Michigan Department of Education’s longitudinal administrative database.Average Educational OutcomesMath Achievement-.5-.6LeadCopper-.7-.8Before 2015After 2015Average Educational OutcomesReading Achievement-.5-.6Notes: This figure displaysdescriptive trends in the meanacademic outcomes for theFlint geographic district from2010-2019. Education datais taken from the MichiganDepartment of Education’slongitudinal administrative database. The black lines displaystudents living in homes withcopper service lines, while thered lines display students livingin homes with lead servicelines. Service line material datawas collected during the Cityof Flint’s service line inspectionand replacement programthat was implemented in theaftermath the Crisis. The graydotted vertical line representstime that the Flint Water Crisisbegins.Math and reading achievementare observed in only grades3-8, whereas special needs andattendance are observed ingrades K-12.-.7-.8Before 2015After 2015Page 7
Special NeedsAverage Proportion of Students.21.2.19.18LeadCopper.17.16Before 2015After 2015Average Proportion of StudentsAttendance.93.92Notes: These figures displaydescriptive trends in the meanacademic outcomes for theFlint geographic district from2010-2019. Education datais taken from the MichiganDepartment of Education’slongitudinal administrative database. The black lines displaystudents living in homes withcopper service lines, while thered lines display students livingin homes with lead servicelines. Service line material datawas collected during the Cityof Flint’s service line inspectionand replacement programthat was implemented in theaftermath the Crisis. The graydotted vertical line representstime that the Flint Water Crisisbegins.Special Needs and Attendanceare observed for children ageK-12.91.9.89Before 2015After 2015Page 8
Limitations & ConclusionAs this was the first study which matched student-level data for school-age childrenwith lead service line data for households in Flint, there are a few limitations from thisstudy worth noting.1Due to data limitations, this study does not focus on children who wereinfants or toddlers at the time of the crisis. This is particularly importantbecause prior research suggests these very young children are mostaffected by lead exposure, which this study cannot capture.2It is possible that additional support provided to Flint children duringand after the water crisis mitigated potential negative impacts of leadexposure.3The authors were unable to measure lead exposure through watersources outside the home (for example, water consumed at school or at afriend’s house).4The authors could not identify the specific mechanisms th ough whichthe Flint Water Crisis affected children’s educational performance.Readers who would like to dive deeper into the study and explore the researchers’approach to isolating the effects of the Flint Water Crisis on school-aged childrenshould refer to the working paper released in October 2021, found on both EPI andNBER's websites. https://www.nber.org/papers/w29341Much of the data used for this project was structured and maintained by the MERIMichigan Education Data Center (MEDC). MEDC data is modified for analysispurposes using rules governed by MEDC and are not identical to those data collectedand maintained by the Michigan Department of Education (MDE) and/or Michigan’sCenter for Educational Performance and Information (CEPI). Results, information, andopinions solely represent the analysis, information and opinions of the authors and arenot endorsed by, or reflect the views or positions of, grantors, MDE and CEPI or anyemployee thereof.Page 9
ReferencesEggert, D. What 1T federal infrastructure law means for Michigan. Click on Detroit, 2021. michigan/Sobeck, J., Smith-Darden J., Hicks M., Kernsmith P., Kilgore, P., Treemore-Spears, L. & McElmurry,S. (2020) Stress, Coping, Resilience and Trust during the Flint Water Crisis, Behavioral Medicine,46:3-4, 202-216, DOI: 10.1080/08964289.2020.1729085Trejo, S. and Yeomans-Maldonado, G. and Jacob, B. A.(2021). The Psychosocial Effects of the FlintWater Crisis on School-Age Children NBER Working Paper No. w29341, Available at SSRN:https://ssrn.com/abstract 3940027“Free Water testing available for Flint residents as part of city of Flint’s Water infrastructureprojects.” City of Flint News. August 26, 2021. ty-of-flints-water-infrastructure-projects/“Lead levels jump higher in Flint water testing but remain below federal action level.” Ron Fonger.MLive. January 20,2022. elow-federal-action-level.htmlEPI Mission StatementThe central mission of the initiative is to engage in applied education policy research. The Education Policy Initiative isa program within the Ford School that brings together nationally-recognized education policy scholars focused on thegeneration and dissemination of policy-relevant education research. The primary goals of the initiative are to: Conduct rigorous research to inform education policy debates in Michigan and nationwide Disseminate best practices in education reform to local, state, and national policymakers, as well asto educational practitioners, parents, and students Train graduate students and others to conduct cutting-edge research in education Facilitate interactions between students and faculty from different schools and/ or departments whoshare an interest in education reform.Education Policy Initiative Gerald R. Ford School of Public PolicyJoan and Sanford Weill Hall, Suite 5100735 South State Street, Ann Arbor, MI 48109734-615-6978 edpolicy.umich.edu @edpolicyfordPage 10
inspections conducted by Flint's Fast Action and Sustainability Program to examine how the Flint Water Crisis affected school-age children's academic outcomes. Collectively, the findings provide some insight into the ways in which experiencing a community crisis profoundly affected the educational trajectory of Flint children. The study draws