Transcription
D206 Performance Assessment revisionJuly 11, 20211Performance Assessment D206 Data CleaningRyan L. Buchanan Student ID: 001826691 Masters Data Analytics (12/01/2020) Program Mentor:Dan Estes (385) 432-9281 (MST) rbuch49@wgu.edu1.1Part I: Research Question1.1.1 A. Question or Decision:Can we determine which individual customers are at high risk of churn? And, can we determinewhich features are most significant to churn?1.1.2 B. Required Variables:The data set is 10,000 customer records of a popular telecommunications company. The dependent variable (target) in question is whether or not each customer has continued or discontinuedservice within the last month. This column is titled "Churn."Independent variables or predictors that may lead to identifying a relationship with the dependent variable of "Churn" within the dataset include: 1. Services that each customer signed up for(for example, multiple phone lines, technical support add-ons or streaming media) 2. Customeraccount information (customers’ tenure with the company, payment methods, bandwidth usage,etc.) 3. Customer demographics (gender, marital status, income, etc.).4. Finally, there are eight independent variables that represent responses customer-perceived importance of company services and features.The data is both numerical (as in the yearly GB bandwidth usage; customer annual income)and categorical (a "Yes" or "No" for Churn; customer job).1.2Part II: Data-Cleaning Plan1.2.1 C1. Plan to Find Anomalies:My approach will include: 1. Back up my data and the process I am following as a copy to mymachine and, since this is a manageable dataset, to GitHub using command line and gitbash. 2.Read the data set into Python using Pandas’ read csv command. 3. Evaluate the data strutureto better understand input data. 4. Naming the dataset as a the variable "churn df" and subsequent useful slices of the dataframe as "df". 5. Examine potential misspellings, awkward variablenaming & missing data. 6. Find outliers that may create or hide statistical significance using histograms. 7. Imputing records missing data with meaningful measures of central tendency (mean,1
median or mode) or simply remove outliers that are several standard deviations above the mean.*Referenced & paraphrased within above plan (Larose, 2019, p. 29-43).1.2.2 C2. Justification of Approach:Though the data seems to be inexplicably missing quite a bit of data (such as the many NAsin customer tenure with the company) from apparently random columns, this approach seemslike a good first approach in order to put the data in better working order without needing toinvolve methods of initial data collection or querying the data-gatherers on reasons for missinginformation. Also, this the first dataset that I’ve clean, so I followed the procedures practice in theperformance lab as well as tips from StackOverflow and other tutorial resources.1.2.3 C3. Justification of Tools:I will use the Python programming language as I have a bit of a background in Python havingstudied machine learning independently over the last year before beginning this masters programand its ability to perform many things right "out of the box" (Poulson, 2016, section 2). Pythonprovides clean, intuitive and readable syntax that has become ubiquitous across in the data science industry. Also, I find the Jupyter notebooks a convenient way to run code visually, in itsattractive single document markdown format, the ability to display results of code and graphicvisualizations and provide crystal-clear running documentation for future reference. A thoroughinstallation and importation of Python packages and libraries will provide specially designed codeto perfom complex data science tasks rather than personally building them from scratch. This willinclude: NumPy - to work with arrays Pandas - to load datasets Matplotlib - to plot chartsScikit-learn - for machine learning model classes SciPy - for mathematical problems, specificallylinear algebra transformations Seaborn - for high-level interface and atttractive visualizationsA quick, precise example of loading a dataset and creating a variable efficiently is using to callthe Pandas library and its subsequent "read csv" function in order to manipulate our data as adataframe: import pandas as pd df pd.read csv(’Data.csv’)1.2.4 C4. Provide the Code:[1]: # Install necessary packages!pip install pandas!pip install numpy!pip install scipy!pip install sklearn!pip install matplotlibRequirement already satisfied: pandas in rement already satisfied: pytz 2017.2 in /usr/local/lib/python3.7/distpackages (from pandas) (2018.9)Requirement already satisfied: python-dateutil 2.7.3 in/usr/local/lib/python3.7/dist-packages (from pandas) (2.8.1)Requirement already satisfied: numpy 1.15.4 in /usr/local/lib/python3.7/distpackages (from pandas) (1.19.5)Requirement already satisfied: six 1.5 in /usr/local/lib/python3.7/dist2
packages (from python-dateutil 2.7.3- pandas) (1.15.0)Requirement already satisfied: numpy in irement already satisfied: scipy in rement already satisfied: numpy 1.13.3 in /usr/local/lib/python3.7/distpackages (from scipy) (1.19.5)Requirement already satisfied: sklearn in ment already satisfied: scikit-learn in /usr/local/lib/python3.7/distpackages (from sklearn) (0.22.2.post1)Requirement already satisfied: numpy 1.11.0 in /usr/local/lib/python3.7/distpackages (from scikit-learn- sklearn) (1.19.5)Requirement already satisfied: joblib 0.11 in /usr/local/lib/python3.7/distpackages (from scikit-learn- sklearn) (1.0.1)Requirement already satisfied: scipy 0.17.0 in /usr/local/lib/python3.7/distpackages (from scikit-learn- sklearn) (1.4.1)Requirement already satisfied: matplotlib in /usr/local/lib/python3.7/distpackages (3.2.2)Requirement already satisfied: kiwisolver 1.0.1 in /usr/local/lib/python3.7/dist-packages (from matplotlib) (1.3.1)Requirement already satisfied: cycler 0.10 in /usr/local/lib/python3.7/distpackages (from matplotlib) (0.10.0)Requirement already satisfied: pyparsing! 2.0.4,! 2.1.2,! 2.1.6, 2.0.1 in/usr/local/lib/python3.7/dist-packages (from matplotlib) (2.4.7)Requirement already satisfied: python-dateutil 2.1 in /usr/local/lib/python3.7/dist-packages (from matplotlib) (2.8.1)Requirement already satisfied: numpy 1.11 in /usr/local/lib/python3.7/distpackages (from matplotlib) (1.19.5)Requirement already satisfied: six in /usr/local/lib/python3.7/dist-packages(from cycler 0.10- matplotlib) (1.15.0)[2]: # Standard importsimport numpy as npimport pandas as pdfrom sklearn.preprocessing import scalefrom sklearn.decomposition import PCAimport seaborn as snsimport matplotlib.pyplot as plt%matplotlib inline[3]: # Load data set into Pandas dataframechurn df pd.read csv('churn raw data.csv')[4]: # Display Churn dataframechurn df3
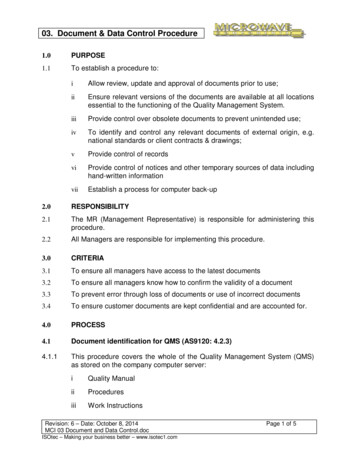
[4]:01234.99959996999799989999Unnamed: 012345.999699979998999910000CaseOrder Customer 7939997D8617329998I2434059999I64161710000T38070. item6 item7 0 rows x 52 columns][5]: # List of Dataframe Columnsdf churn df.columnsprint(df)Index(['Unnamed: 0', 'CaseOrder', 'Customer id', 'Interaction', 'City','State', 'County', 'Zip', 'Lat', 'Lng', 'Population', 'Area','Timezone', 'Job', 'Children', 'Age', 'Education', 'Employment','Income', 'Marital', 'Gender', 'Churn', 'Outage sec perweek', 'Email','Contacts', 'Yearly equip failure', 'Techie', 'Contract', 'Port modem','Tablet', 'InternetService', 'Phone', 'Multiple', 'OnlineSecurity','OnlineBackup', 'DeviceProtection', 'TechSupport', 'StreamingTV','StreamingMovies', 'PaperlessBilling', 'PaymentMethod', 'Tenure','MonthlyCharge', 'Bandwidth GB Year', 'item1', 'it
Dan Estes (385) 432-9281 (MST) rbuch49@wgu.edu 1.1 Part I: Research Question 1.1.1 A. Question or Decision: Can we determine which individual customers are at high risk of churn? And, can we determine which features are most significant to churn? 1.1.2 B. Required Variables: The data set is 10,000 customer records of a popular .