Transcription
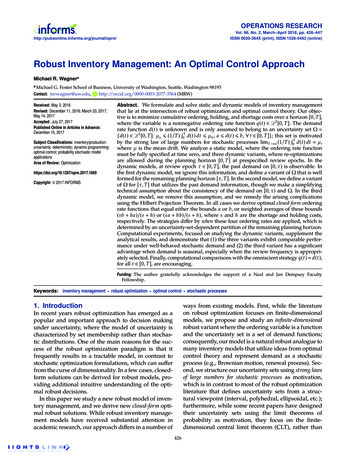
Robust Performance Metrics forAuthentication SystemsShridatt Sugrim, Can Liu, Meghan McLean, Janne LindqvistRutgers UniversityAbstract—Research has produced many types of authentication systems that use machine learning. However, there is noconsistent approach for reporting performance metrics and thereported metrics are inadequate. In this work, we show thatseveral of the common metrics used for reporting performance,such as maximum accuracy (ACC), equal error rate (EER) andarea under the ROC curve (AUROC), are inherently flawed.These common metrics hide the details of the inherent tradeoffs a system must make when implemented. Our findings showthat current metrics give no insight into how system performancedegrades outside the ideal conditions in which they were designed.We argue that adequate performance reporting must be providedto enable meaningful evaluation and that current, commonly usedapproaches fail in this regard. We present the unnormalizedfrequency count of scores (FCS) to demonstrate the mathematicalunderpinnings that lead to these failures and show how they canbe avoided. The FCS can be used to augment the performancereporting to enable comparison across systems in a visual way.When reported with the Receiver Operating Characteristics curve(ROC), these two metrics provide a solution to the limitationsof currently reported metrics. Finally, we show how to usethe FCS and ROC metrics to evaluate and compare differentauthentication systems.I.I NTRODUCTIONMany authentication systems utilizing machine learninghave been proposed (see Table II). However, there is noclear agreement in the community about how these systemsshould be evaluated or which performance metrics shouldbe reported. Specifically, publications often report misleadingsingle-number summaries which include true positive rate(TPR), false positive rate (FPR), equal error rate (EER), areaunder ROC curve (AUROC), and maximum accuracy (ACC).Figure 1 enumerates the reporting rates of common metricsfor thirty-five recent publications.Improving the metrics and reporting methods can resolvetwo primary obstacles to the evaluation of authentication systems. These obstacles are (1) skew in the distributions used totrain and evaluate the systems, and (2) misleading comparisonsthat arise from the reported metrics. For example, skew withinthe population of study participants can artificially inflate themaximum accuracy. Additionally, misleading comparisons canresult from commonly reported metrics. For example, it isinappropriate to conclude that one system performs better thananother by comparing an EER of 0.05 to 0.10. Similarly, anNetwork and Distributed Systems Security (NDSS) Symposium 201924-27 February 2019, San Diego, CA, USAISBN .23351www.ndss-symposium.orgFig. 1: The frequency of reported metrics from Table I forthirty-five recent publications surveyed from venues listed inTable II. Classical biometric and detection summaries such asEER and TPR are often reported because they are widely usedin the literature. The FPR is the most reported because it isthe common element for two frequently reported metric pairs,the (TPR,FPR) and (FPR,FRR).accuracy of 80% versus 90% does not allow clear inferencesabout the system performance.We show the following three primary flaws with existingmetrics: 1) It is incomplete to report performance using solelysingle-number metrics, like the ACC, FPR, TPR, FAR, andFRR. Single-number summaries hide the details of how andwhat errors occurred. For example, because if a system wastrained on mostly unauthorized users’ data, it will learn torecognize unauthorized users very well and may not recognizeauthorized users. 2) Reporting performance results withoutthe parameters of the model hinders the implementation ofthe system. The system cannot be faithfully replicated whenonly the performance is reported. 3) Performance comparisonscannot be made when using single-number summaries derivedfrom the ROC. One cannot conclude that one system willperform better than another in a target application by directcomparison of the EER and other ROC-derived summaries.In this paper, we uniquely propose and demonstrate howthe ROC, combined with the unnormalized Frequency CountScores (FCS) (shown in Figure 2), aids in the ability tounderstand the trade-offs for authentication performance andadequately evaluate the proposed approach. The major contributions of the paper are as follows: We show how commonly used metrics in authentication systems, including TPR, FPR, EER, AUROC,ACC, and GC are inherently flawed metrics for understanding authentication system performance. We survey eleven top publication venues where au-
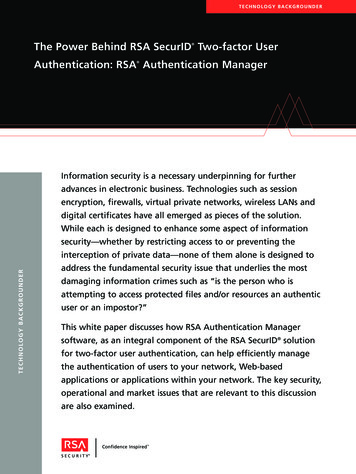
TPFPTNFNCMACCTPRTNRFPR(FAR)FNR(FRR)ROCERRAUROCFig. 2: The left figure is the ROC curve of an authenticationsystem. The right figure is its corresponding FCS that displaysscore distributions for measurements of authorized and unauthorized users. The ROC curve is computed by varying thevalue of the threshold required to grant access and computingthe true positive rate (TPR) and the false positive rate (FPR).The FCS is a histogram of measurement scores separated byground truth. In this FCS figure, the blue histogram representsunauthorized users’ scores, determined by the ground truthof the measurement. The red histogram in the FCS figurerepresents authorized users’ scores.GCFCSWe show how any single-number summary providesincomplete information for the evaluation of authentication systems. We propose unnormalized Frequency Count Scores(FCS) as an augmentation to current authenticationmetrics that enable visual comparison and identification of some errors. We show how using the FCS with the ROC canfurther solve the limitations associated with currentauthentication system metrics. We demonstrate flawed comparisons with existingdatasets by reimplementing the proposed systems.II.R EVIEW OF RECENT AUTHENTICATION SYSTEMSDescriptionAuthorized legitimate users count.Authorized illegitimate users count.Denied illegitimate users count.Denied legitimate users count.Table of contingency counts.Probability of a correct declaration.How often a legitimate users is authorized.How often an illegitimate user is denied.How often an illegitimate user is authorized.How often a legitimate user is denied.Curve of (TPR, FPR) by varying thresholdThe point that TPR equals 1-FPRProbability of scores of random legitimateusers are higher than illegitimate user.Calculated from the AUROCHistogram of scores separated byground truthTABLE I: Performance metric name mMobiSysNDSSPattern RecognitionSS&P (Oakland)SOUPSthentication systems based on machine learning areproposed. We identified thirty-five recent (2016-2018)proposed authentication systems and identified theirreporting themes and common flaws. DefinitionTrue PositiveFalse PositiveTrue NegativeFalse NegativeConfusion MatrixMaximum AccuracyTrue Positive RateTrue Negative RateFalse Positive Rate(False Accept Rate)False Negative Rate(False Reject Rate)Receiver operatorcharacteristic curveEqual Error RateArea under theROC curveGini-coefficientUnnormalized frequencycount of scoresReferences[34], [44], [55][12], [33], [41], [42][11], [20], [25], [35], [48][8], [36], [45], [51], [53][15], [32][7], [31][5], [17], [49], [50][2], [9], [18], [24], [38], [40], [54][46][10], [30]TABLE II: Publications surveyed grouped by venuesusers as authorized and unauthorized (as opposed to identifyingusers from a group). Although we identified many relatedpapers (n 58), only 35 proposed an authentication schemeand were included in the review. We note that we did not findany publications matching our criteria from USENIX Security.In order to find these articles, one researcher used theGoogle Scholar search engine to limit results to these venuesand included the following search terms: authentication, behavioral, biometric, machine learning, password, recognition,and access. A second researcher separately reviewed the venueproceedings using the search terms in order to generate acomplete list of related work.In the thirty-five publications that were surveyed, we discovered no uniform approach for reporting metrics. However,there were several recurring themes. Figure 1 shows that themost common metric reported is the FPR since the FPRis the common element in two different but related metricpairs: the (TPR,FPR) and (FPR,FRR) pairs. These pairs areoften reported when one value is held constant and the otheris minimized (e.g. fixing the FPR and adjusting the systemparameters until the TPR is optimized). There is often nojustification for the value that is chosen to be held constant.Another frequently reported metric is the EER. It is oftenreported for comparison with existing systems in the literature.Unfortunately, without a uniform approach, we cannot makecomparative quantitative conclusions about the performanceacross all the proposed systems.To determine the current state of performance metricreporting, we surveyed recent research published in topvenues. The selection criteria for including papers in thereview was the following: (1) The article was published ina top venue for systems security, mobile computing, humancomputer interaction, or pattern recognition for authentication.These venues included NDSS, CCS, CHI, IMWUT/UbiComp,INFOCOM, MobiCom, MobiSys, SOUPS, SS&P (Oakland),USENIX Security and Pattern Recognition journal. Machinelearning venues (e.g. NIPS) were not included due to theirprimary focus on algorithms and lack of attention to systemapplications. (2) In order to evaluate current practices, thepaper had to be published within the last 2 years (2016 to2018). (3) The paper had to propose an authentication scheme.Specifically, the paper had to use machine learning to labelSixteen (less than half) of the publications reported theROC. Eleven of the publications that reported the ROC had2
and all metrics derived from it (e.g. the ACC or TPR), dependon the threshold used to obtain the results. For metrics derivedfrom the confusion matrix, the system cannot be implementedwhen only the performance is reported. Researchers tend todetermine their own thresholds in isolation when they designa system (they cannot know what an implementer would need).If the threshold is unknown, the conditions under which theoriginal research was completed cannot be replicated. Werecommend that the ROC and FCS are reported to surpass thislimitation. The ROC and FCS show how the system respondsto changes in the threshold and covers a range of possiblethresholds enabling implementers to choose the threshold thatis right for their application.Fig. 3: The flaws noted in Section II-A occur several times inmany of the publications. We note that the common practiceof recruiting N participants and then electing one as the authorized user often leads to skewed measurement populations.Twenty-three of the thirty-five papers surveyed had skewedmeasurement populations.Every machine learning algorithm has parameters that,when adjusted, significantly change their behavior (e.g. slackfactor, size and number of hidden layers, K). Since machinelearning usage is often off-the-shelf, it is easy to overlook thenecessary parameters required to use the system even thoughthese parameters control the behavior of one of the mostcritical parts of the system. In our survey, seventeen of thethirty-five publications left out the parameters of the machinelearning algorithms used. Without these parameters, the taskof replicating the system becomes much more difficult.measurement populations that were skewed (here measurementpopulation is defined as the set of measurements from users).In some of these cases we concluded that the effects of theskew did not impact the validity of the claims because theperformance claims were based on the ROC.A. Common FlawsWe observed three flaws that were common to manypublications. The three flaws are as follows:In one case, a publication studied the effects of environment on the system performance by comparing the accuracyof the system in several environments. Based on the describedmethods, the test data had a positive bias as the authors electeda very small subset of the participants to be attackers. Thepublication did not disclose whether the threshold remained thesame in all environments tested. The authors concluded thatsince the accuracies were less than 5% from each other, thatthe environmental effects were negligible. However, becausethe population was skewed, that less than 5% difference couldalso be accounted for by shifting the threshold in each of theenvironments. Since the data was mostly comprised of positivesamples from authorized users, moving the threshold up ordown could yield more or less correct decisions purely due tosampling effects.1) Flaw 1: Incomplete performance reporting. Reportingbased solely on single-summary metrics is incomplete. For example, the maximum accuracy (ACC) metric does not identifythe type of user (authorized or unauthorized) an error was madeon. For example, an accuracy of 90% does not mean that thesystem makes errors 10% of the time. A system may have beentested on data it would almost always get correct. Specifically,if a system was trained on mostly unauthorized users’ data,it will learn to recognize unauthorized users very well. If thissystem is only tested on unauthorized users, the ACC metricwill be very high. However, because this system was built ononly unauthorized users’ data, it may not recognize authorizedusers very well. The system will not be trained to identifyauthorized users’ data because it has no model for authorizedusers. The model is thus incomplete when trained on data thatis either mostly authorized or unauthorized users.3) Flaw 3: Misleading interpretations. Performance comparisons cannot be made when using single-number summariesderived from the ROC. Direct comparison of the EER (andother ROC-derived summary metrics) does not show whetherone system performs better than another. Two systems withsimilar values for these metrics can have very different ROCs.Because the ROCs are different, the performance will bedifferent when implemented. When a system is implemented,it must be implemented with a target application in mind(e.g. banking or loyalty discounts). These different targetapplications come with requirements for the amount of falsepositives (wrong people allowed in) or the amount of falsenegatives (correct people kept out) that the application cantolerate. In our survey, seven of the thirty-five papers drewdirect comparisons about system performance by comparingone of these summary values. Twenty-two of the thirty-fivepapers reported one of the metrics with the expectation thatsimilar systems could be compared using these summaries.Comparisons made solely based on TPR, FPR, or FRR arealso incomplete. It is not possible to tell if the optimized valueis the result of better discrimination between users or simply anadjustment of system parameters for the purpose of inflating ametric. Since the (TPR,FPR) and (FPR,FRR) are the result of aspecific compromise between the two kinds of errors. One cantrade one error type for another by adjusting the parameters(e.g. threshold), without improving overall performance.It is imperative that authors incorporate this knowledgeinto the interpretation of their metrics. If the authors do notreport the frequency of authorized and unauthorized users’data, then the ACC metric provides little information aboutthe system. Of the thirty-five publications surveyed, elevendirectly exhibited this flaw. Several others made performanceclaims based only on one of these metrics but also reportedother metrics for comparison.Systems with different ROCs behave differently whenimplemented. These differences can lead to unexpected behavior because the error rates of the implemented systemmay differ from the error rates the implementer expected.2) Flaw 2: Results without model parameters. Performanceresults reported without the parameters of the model hindersthe implementation of the system. The confusion matrix (CM),3
EER %0.00 [9]0.34 [24]0.59 [2]0.95 [40]1.26 [55]As a toy example, consider a case in which an implementerdesired to improve the performance of an application thatused Touchalytics [16] and required the false positive rateto be 0.1. In this scenario, the implementer may considerswitching to SVC2004 [28]. The implementer may look atthe EER of SVC2004 which is 0.185 and compare this tothe Touchalytics EER of 0.198. From this comparison, animplementer would conclude that the system’s performancewill improve. He or she would be unpleasantly surprised whentheir true positive rate dropped from 0.8 to 0.6 at the falsepositive rate their application required. Therefore, comparingsystems on these metrics can lead to detrimental, real-worldsecurity consequences.These flaws occur in many of the publications surveyed.Figure 3 enumerates the observation frequency of each ofthe described flaws. We also note that almost two-thirdsof publications have skewed measurement populations. It iscommon practice to recruit N participants, take M number of measurements from each of them, and then electone participant as the authorized user. When this is done,the measurement populations are skewed because there areN 1 M measurements from unauthorized users, and onlyM measurements from authorized users. In some cases, wewere unable to assess whether the measurement population wasskewed because the publication did not report the sources ofmeasurements. This was the case in 23 of the 35 publicationswe reviewed. However a few reported balanced accuracy inan attempt to compensate for the skew. As we will see, hadthe FCS been reported, we would have been able to visuallyassess if there was measurement population skew. One of thepublications actually reported a normalized FCS but did notuse it for analysis.B. A naı̈ve comparisonTable III enumerates the top five systems based on thereported performance metrics. We consider the three mostcommon metrics: the EER, ACC, and FPR. For any singlemetric, this comparison fails to produce a meaningful resultfor several reasons. Individually using any of the three above-mentionedmetrics can lead to flawed conclusions because noindividual metric captures the complete performance. Just because a system optimizes a metric, does notmean that it can be utilized in the target application(e.g. an approach implemented for keyboards may notwork on touchscreens directly).%[11][9][35][5][40]Of importance, system evaluation requires the ability toevaluate the potential security trades-offs of a system. Insteadof answering the question, “Has the system produced a singlemetric that has surpassed a seemingly adequate threshold?”implementers need to answer the question, “Can this systembe tuned to meet the needs of my application such that reportedmetrics show possible security trade-offs?” Many of the currentmetrics that are reported fail to answer the latter question.In the second use case, the EER or AUROC is reported withthe expectation that these metrics will be used to compare theproposed system to other competing systems. This use caseonly allows for naı̈ve comparisons such as those detailed inSection II-B. Since the second use case requires knowing whatthe authors intended the reported metric to be used for, we didnot count these cases as evidence of flaw 3.Not all publications report the same metric. Comparison across different metrics does not have a meaningful interpretation.FPR0.000.010.100.100.10TABLE III: The top five authentication systems according to anaı̈ve comparison of their best reported values for EER, ACC,and FPR metrics. These metrics are reported the most oftenbut rarely yield a meaningful comparison. There is no clearwinner as each of the top five performers in each categoryvaries significantly.In several of the surveyed publications the EER and AUROC were used in two different ways. In the first use case,authors made direct claims about the relative behavior of twoor more systems either by comparing the proposed system toan existing system which uses the same types of measurementsor by adjusting the parameters for their own measurements, todetermine the impact on the metric. In some cases, authorsconcluded that a change in parameter had no impact onperformance because the metric was unchanged. However,because they did not include the ROC, we do not know whateffect the changes had on the ends of the curve. In contrast,some authors reported the ROC for multiple parameterizationsof their system demonstrating that their systems behaviorwas predictable over a wide range of parameterizations, eventhough they did not make this claim. ACC %99.30 [55]98.61 [32]98.47 [51]98.00 [53]97.00 [42]III.R ELATED W ORKWe discovered only one publication in the systems securitycommunity that has studied how performance metrics arereported [13]. They studied flaws that occur in reporting forcontinuous authentication systems. They note that the EER isamong the most popular metrics and observe the misleadingcharacteristics of only reporting the EER and false negativerate (FNR). They also note that data sets are rarely madeavailable, which creates a barrier to follow-up analyses. Theyadditionally advocate for the use of the Gini Coefficient (GC)which is functionally related to the AUROC. We show thatthe GC and AUROC are also flawed metrics that hinder thecomparison and implementation of a system and we insteadadvocate for the combination of FCS and the ROC.It is clear that such a naı̈ve comparison cannot lead to aninformed comparison of the proposed systems. It is evendifficult to identify if a system is suitable because some ofthe metrics fail to provide information that is relevant to thecontext of the target application (e.g. an FPR may not beachieved at a target TPR).Bonneau et al. [3] compared different types of authentication systems to text passwords with qualitative metrics inusability, deployability, security. They provide a wide rangeof real-world constraints but they did not provide quantitative4
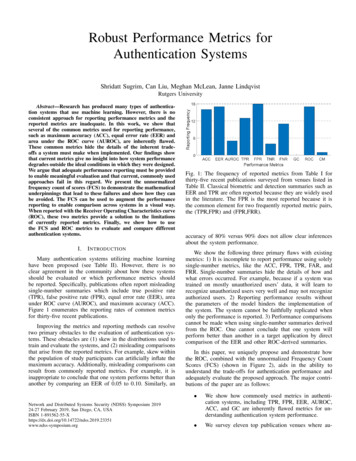
approaches to evaluate the metrics. In contrast, we focus onquantitative metrics in this paper.machine learning in most authentication systems includes threemajor operations: preprocessing, scoring and thresholding.The efficacy of the EER in communicating performancehas been questioned in other fields [37]: the EER has thesignificant disadvantage of representing only a single pointin the performance continuum and that this misrepresents thecapabilities of a system. The paper [37]: argues for the ROCas the main performance metric but does not consider howmeasurements are separated, nor the utility of looking at scorerange overlap (we will address how these factors limit theutility of the ROC). Others [39], [14] have argued for usingthe ROC curve over the accuracy as a performance metric.Papers from several fields, including clinical medicine [56],chemistry [4] and psychiatry [47], have been arguing forthe use of the ROC. Although many disciplines call for theusage of the ROC, the interpretation and consequences of aclassification error are distinct to each discipline. In our work,we focus on classification error in the context of authenticationand show how the ROC alone is an inadequate metric.In the preprocessing operation, the measurements are filtered, re-centered and scaled [43]. This operation may discardmeasurements that fail to meet any admissibility criteria the authentication system may have (e.g. measurements that are tooshort). Scoring applies a mathematical function (f : M R)to the measurements to generate a numerical summary of themeasurements (by numerical summary, we mean a numberthat is used to describe a characteristic of a dataset). Scoresof measurements from authorized users by convention scorehigher (to the right of) than those of unauthorized users [23].Prior research has used normalized histograms to estimatescore distributions [26]. This approach is fundamentally different from what we propose. We propose that an unnormalizedmetric - the Frequency Counts of Scores (FCS) can be usedto diagnose security flaws for authentication systems. Thisapproach is not widely known or applied.Thresholding uses the score (a numerical summary) asevidence for a decision. The choice threshold establishes theminimum required score to be deemed authorized. For anyuser’s measurements, if the score is below the threshold, theuser will be denied access. Similarly, if the user’s score isabove the threshold, the user will be granted access. Thefurther away the score is from the threshold, the more confidentwe can be in our classification. Thus, user measurements thatscore significantly higher than the threshold are consideredstrong evidence for a decision to grant access. User measurements that score significantly lower than the threshold yield aconfident decision to deny access. In this sense, the choice ofthreshold dictates the strength of the decision.The scoring operation is the most critical part of theauthentication process. Scoring measurements well enablesunambiguous classifications by separating measurements. Thebetter scoring is at separating measurements, the fewer errorswill be made. The scores between different authenticationsystems are rarely comparable and bare no direct relevanceto each other, even if the systems measure the same thing.Some of the flaws we discuss may be known in the machinelearning community. For example, previous research in machine learning has discussed population skew [14]. However,our work clearly shows that our suggestions are unknown inthis context and novel to the authentication systems community. Thus, it is imperative that the flaws and our proposedrecommendations are discussed.In summary, using EER as a performance metric has beenquestioned in continuous authentication systems and otherfields. However, there is no work that propose a convincingalternative metrics to EER. We are the first to propose theFCS in addition to the ROC to augment the comparabilityof authentication systems. Although prior texts discussed thenormalized histogram for estimating score distributions, weare the first to use the unnormalized FCS for diagnosingsecurity flaws of authentication systems. The FCS addressesthe deficiencies in the availability of data for analysis byenabling analyses to be done on the distribution of scores.This is true even in cases where the data may be sensitive andcannot be made available to the public. The FCS can be usedto directly identify thresholds that fit the application criteria.Analysis of the scores can give insight into the modificationsa score function might need to achieve better separation ofusers. With FCS, we can identify two types of flaws in thesurveyed publications in top venues: incomplete performancereporting and misleading metric interpretation.IV.A. How authentication systems research is consumedWhile there is no formula for implementing a proposed system from its publication description, there is a common themethat many publications follow. Many publications start with adescription of what is measured and why it is important to bemeasured. A case then is made for why the measured quantitieswill produce good performance or have some additional benefit(e.g. easy to remember, resistant to some types of attacks, andrequire fewer resources). A classification algorithm is typicallychosen based on criteria such as ease of implementation orgood performance with available data for a chosen metric.Finally, a user study is performed to validate the design choicesmade, demonstrate the claims of utility or defensibility, andpotentially compare to existing systems.An implementer of these systems will have to determinewhat was measured from the description, and then collect thosemeasurements. The implementer will then need to use theclassification and compare the performance metrics achievedby their implementation against those reported in the publications. The implementer will have to pick a system basedon a comparison of the reported performance values, theability to recreate the measurement apparatus (e.g. collectingheart rhythms or breath sounds), and applicability of thesystem’s benefits to their specific case (e.g. the need forresistance to shoulder surfing). As we will see, comparingperformance values between publications is often challengingM ACHINE L EARNING IN AUTHENTICATION S YSTEMSAuthentication systems that utilize machine learning canuse a variety of methods to distinguish users (e.g. fingerprints,visited locations, and keystroke dynamics). Regardless of theauthentication method, the machine learning methods used toclassify the measurements are the same. Figure 4 shows how5
Fig. 4: The use of machine learning as a classifier is common to many authentication systems. The preprocessing phase preparesmeasurements by filtering, re-centering and scaling. The scoring phase applies a mathematical function to the measurements to mapthem to a number. The thresholding phase compares the number to a fixed threshold to make a decision. The full authenticationsystem feeds measurements taken from the user to the machine learning classifier and then evaluates the performance based onthe decisions that come out of it.for a variety of reasons, complicating the process of choosinga system. Implementing the classification algorithm can alsoprove daunting because the descriptions are often inadequate(e.g. often lacking critical parameter values).C. Why authentication systems make mistakesFrom a security standpoint, what distinguishes one systemfrom another is not the measurements they collect, but howwell they tell authorized users apart from unauthorized users.For example, the problem of granting access to the wrongperson has severe consequences if the target application isbanking. On the o
Robust Performance Metrics for Authentication Systems Shridatt Sugrim, Can Liu, Meghan McLean, Janne Lindqvist Rutgers University Abstract—Research has produced many types of authentica-tion systems that use machine learning. However, there is no consistent approach for reporting performance metrics and the reported metrics are inadequate.