Transcription
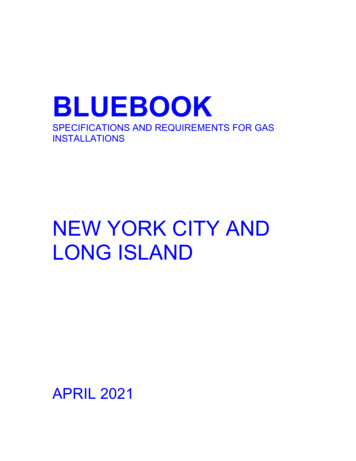
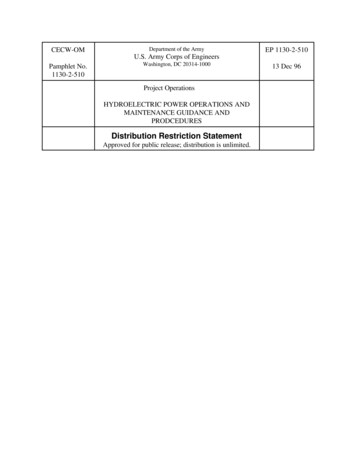
APPENDIX A: Supplemental Research DataEducation:Broward County Schools Suspensions by type and RaceAlternate External SuspensionExternal Suspension1.1%Internal SuspensionWhite Students 0.7%3.4%1.2%Hispanic0.8%Students3.5%3.4%Black Students2.4%7.9%Source: Broward County Public Schools - Incident and Suspension Report, 2020S t a t e o f B l a c k B r o w a r d A p p e n d i x 1 25
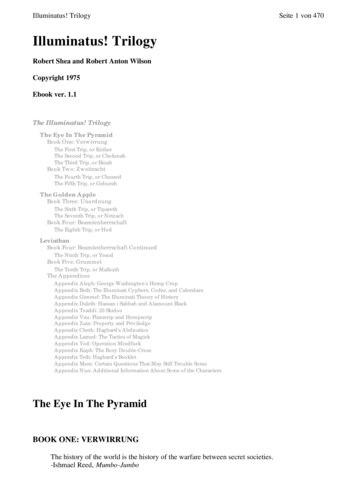
Broward County School Incidents by Race and Ethnicity**White5.0%5.4%Disruptive1.9%2.1%Acts Against Person2.5%3.0%AttendanceRules Violation1.0%0.8%0.6%Bus0.3%0.4%1.2%Other se/DrugPropertyHispanic0.3%0.4%0.7%0.1%0.1%0.2%** Percent of Students with at least one incidentSource: Broward County Public Schools - Incident and Suspension Report, 2020S t a t e o f B l a c k B r o w a r d A p p e n d i x 2 25
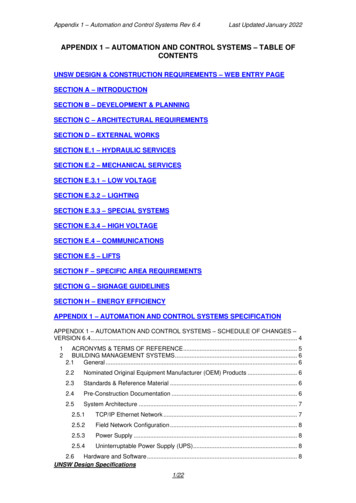
Average Daily Attendance Rate by Race (2020)Hispanic94.0%Black93.9%White94.1%Source: Broward County Public Schools - 2020 Attendance ReportBroward FSA English Language Arts Passing Rate, 3rd .9%46.4%39.7%36.4%FY 15FY 16FY 17FY 18FY 19FY 21Source: FL Dept. Education ED Stats PortalS t a t e o f B l a c k B r o w a r d A p p e n d i x 3 25
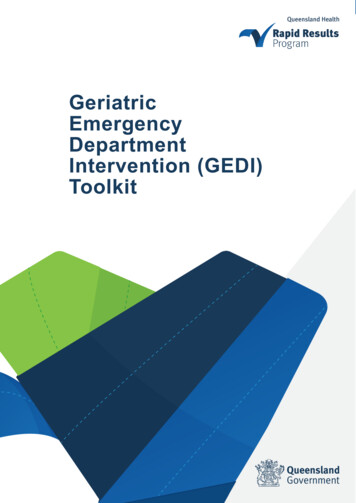
Broward FSA English Language Arts Passing Rate, 10th .0%FY 15FY 16FY 17FY 18FY 19FY 21Source: FL Dept. Education ED Stats PortalWhiteBroward FSA Math Passing Rate, 3rd GradeHispanicBlack73.8%61.6%60.7%45.3%43.3%27.4%FY 15FY 16FY 17FY 18FY 19FY 21Source: FL Dept. Education ED Stats PortalS t a t e o f B l a c k B r o w a r d A p p e n d i x 4 25
Average AP Exams Taken1.91.71.5WhiteBlackHispanicSource: Broward County Public Schools - Advanced Placement Report 2019-20Median Teacher Salary, Inflation Adjusted 70,000 65,000 64,638 60,000 55,000 51,572 50,000 45,000 40,000Source: FLDOE - Teacher Salary DataS t a t e o f B l a c k B r o w a r d A p p e n d i x 5 25
Share of Inexperienced Instructional Staff (2019-20)Low Minority SchoolMid-Range MinoritySchoolHigh Minority School42.3%1.1%56.6%Source: Broward County Public Schools - Compensation and HR Information SystemsS t a t e o f B l a c k B r o w a r d A p p e n d i x 6 25
Proportion of Inexperienced Scool Administrators(2019-20)High Minority SchoolsMid-Range MinoritySchoolsLow Minority SchoolsAll Broward Schools22.2%21.2%14.3%21.5%Source: Broward County Public Schools - Accountability ReportingS t a t e o f B l a c k B r o w a r d A p p e n d i x 7 25
Local University Enrollment by Race, 2019-2027.6%Florida Atlantic University19.8%39.8%28%Sheridan Technical College51%15%36%McFatter Technical College26%Black or AfricanAmerican36%Nova Southeastern UniversityHispanic or Latinx30%White14%27%38%Broward College29%16%Source: National Center for Education Statistics - Annual Reports, 2019-20S t a t e o f B l a c k B r o w a r d A p p e n d i x 8 25
Economy:Industry Breakdown by Race, 2021GovernmentOther Services (except Public Administration)Accommodation and Food Services49%45%36%Arts, Entertainment, and RecreationHealth Care and Social AssistanceEducational ServicesAdministrative and Support and Waste Management of Companies and l Estate and Rental and Leasing46%Finance and Insurance46%Information44%Transportation and Warehousing37%Retail Trade37%ManufacturingConstructionUtilitiesMining, Quarrying, and Oil and Gas Extraction18%31%31%31%57%Wholesale Trade16%34%50%Professional, Scientific, and Technical ServicesAgriculture, Forestry, Fishing and 11%White Percent of IndustryHispanic or Latinx Percent of IndustrySource: EMSI Q2 2021 Data SetBlack or African American Percent of IndustryS t a t e o f B l a c k B r o w a r d A p p e n d i x 9 25
Broward Occupations by Race, 2019White, non-Hispanic36.1%Hispanic or LatinxBlack or 8.2%10.4%10.6%12.0%7.8%12.6%24.7%Management, business, science, and arts occupationsService occupationsSales and office occupationsNatural resources, construction, and maintenance occupationsProduction, transportation, and material moving occupationsSource: U.S. Census Bureau - 1-Year EstimatesLabor Participation by Race201072.4%72.8%71.0%62.9%Black or AfricanAmerican201971.6%58.9%White, Non HispanicHispanic or LatinxSource: U.S. Census Buraeu - 1-year estimates, 2010-2019S t a t e o f B l a c k B r o w a r d A p p e n d i x 10 25
Unemployment by 4White alone, not Hispanic20152016201720182019Black or African AmericanHispanic or LatinoSource: U.S. Census Buraeu - 1-year estimates, 2010-2019S t a t e o f B l a c k B r o w a r d A p p e n d i x 11 25
Inflow/Outflow of Broward 18Living in Broward But EmployedOutsideLiving and Employed in BrowardSource: U.S.Census Bureau, Center for Economic Studies, LEHDBroward Work-Commuters, 20198.7%2.5%2.3%1.1%Drove Car/Truck/VanAloneCarpooled76.3%Public TransportationTaxi/Motorcycle/OtherSource: U.S. Census Bureau - 5-Year EstimatesS t a t e o f B l a c k B r o w a r d A p p e n d i x 12 25
Criminal Justice and Safety:Adult Drug/Narcotics Arrests byRace, 2019WhiteBlackIndian Asian247130643251Adult Arrests by Race, 2019WhiteBlackIndian Asian23,778 25,630201463Broward Inmates on Death Row, 2020149Black MenWhite MenSource: FL Dept. of Corrections - Death Row RosterS t a t e o f B l a c k B r o w a r d A p p e n d i x 13 25
Local Counties Average Daily Prison PopulationsPalm Beach1,7003,590Miami DadeBroward3,176Source: Dept. of Corrections - Inmate Profile, 2020Local County Shares of State Averge Daily Prison PopulationBroward 6.53%Miami Dade 7.39%Palm Beach 3.50%Source: FL Dept. of Corrections - Inmate Profile, 2020S t a t e o f B l a c k B r o w a r d A p p e n d i x 14 25
Inmates with Life or Death Sentences (State of FL)20202015201015.90%13.30%11.50%FL Dept. of Law Enforcement - Criminal justice Trends, 2020S t a t e o f B l a c k B r o w a r d A p p e n d i x 15 25
Housing:Housing ner-occupiedRenter-occupiedSource: U.S. Census Bureau - 5-Year EstimatesVacant Housing Units201017.1%2015201917.7%16.2%Source: U.S. Census Bureau - 5-Year EstimatesS t a t e o f B l a c k B r o w a r d A p p e n d i x 16 25
Median Gross Rent and Selected Owner-Costs 1,843 1,593 1,589 1,392 1,083 937201020152019Median Gross RentMedian Monthly Owner-cost (mortgaged households)Source: U.S Census Bureau - 5-Year EstimatesS t a t e o f B l a c k B r o w a r d A p p e n d i x 17 25
Household Type by %32.1%Nonfamily householdFemale householde, no husbandMale householder, no wifeSource: U.S. Census Bureau - 5-Year EstimatesMarried-couple familyS t a t e o f B l a c k B r o w a r d A p p e n d i x 18 25
Broward homes lacking facilitiesNo telephone service available1.8%Lacking complete kitchenfacilitiesLacking complete plumbingfacilities0.7%0.3%Source: U.S. Census Bureau - 5-Year EstimatesAffordable Housing in BrowardLow IncomeApartments 15,585Housing Units withRental Assistance 4,247Source: Broward County Municipal SiteS t a t e o f B l a c k B r o w a r d A p p e n d i x 19 25
Broward Housing Tenure by Race, 2019Hispanic or Latinx57.1%Black or African American42.9%47.6%52.4%White, Non-Hispanic71.9%28.1%HomeownersRentersSource: U.S. Census Bureau - 5-Year EstimatesSingle-Family HomesTownhouses/CondosHome Values by Type and SaleShort SaleForeclosureTraditionalShort SaleForeclosureTraditional 174,250 225,00020202021 160,000 112,000 170,000 210,000 276,674 376,000 315,000 310,000 376,450 422,500Source: Miami Association of REALTORS S t a t e o f B l a c k B r o w a r d A p p e n d i x 20 25
Broward Foreclosures35418912260Source: Westlaw - Broward Foreclosures ForeclosuresS t a t e o f B l a c k B r o w a r d A p p e n d i x 21 25
Broward Evictions1,5201,16015312Source: Westlaw - BrowardForeclosuresS t a t e o f B l a c k B r o w a r d A p p e n d i x 22 25
Housing Transportation Index66%64%60%BrowardMiami DadePalm BeachSource: Center for Neighorhood Technology - HTAIndexS t a t e o f B l a c k B r o w a r d A p p e n d i x 23 25
Health:Uninsured Population by ic WhiteBlack or African AmericanHispanic or LatinxU.S. Census Bureau - 5-Year EstimatesHIV Death Rate by Race and Ethnicity Per 2.410.81.3S t a t e o f B l a c k B r o w a r d A p p e n d i x 24 25
Voter Engagement:Removed Voters - Active and 20162017201814,04320192020Source: Broward County Supervisor of ElectionsNew Valid 201520162017201820192020Source: Broward County Supervisor of ElectionsS t a t e o f B l a c k B r o w a r d A p p e n d i x 25 25
APPENDIX A: Supplemental Research Data Education: Source: Broward County Public Schools 7.9% 3.5% 3.4% 2.4% 0.8% 0.7% 3.4% 1.2% 1.1% Black Students Hispanic Students White Students Alternate External Suspension External Suspension Internal Suspension-Incident and Suspension Report, 2020 Broward County Schools Suspensions by type and Race