Transcription
Biochar as a Forest Industry Co-productIs there space for new products intraditional manufacturing operations?Nate Anderson, Research ForesterU.S. Forest Service,Rocky Mountain Research StationForest Biomass and the BioeconomyApril 25, 2019 Vancouver, WA
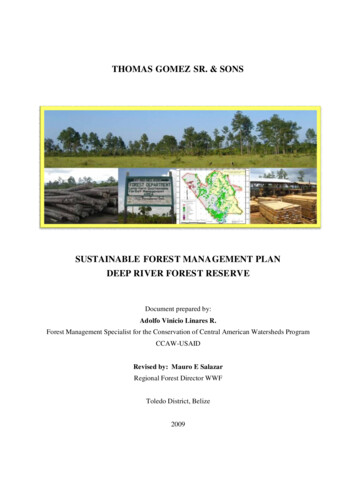
OverviewWhat’s the supply chain problem?Is biochar part of the solution?1. Small scale operations2. Medium & large scale operations3. Value added operationsSummaryDiscussionUnburned slash piles leftbehind after logging,Fraser National Forest.
AcknowledgementsCo-AuthorsIndustry Partners & AdvisorsNate Anderson, U.S. Forest Service (RMRS)Rick Bergman, U.S. Forest Service (FPL)Robert Campbell, Univeristy of MontanaWoodam Chung, Oregon State UniversityDaren Daugaard, Burning Oak Energy, LLCHongmei Gu, U.S. Forest Service (FPL)Dongyeob Kim, Seoul National UniversityDan McCollum, U.S. Forest Service (RMRS)Helen Naughton, University of MontanaDebbie Page-Dumroese, USFS (RMRS)Jonah Levine, Biochar Solutions, Inc.Brad Dunmire, Pueblo Wood ProductsDaren Daugaard, Cool Planet Energy Systems(now with Burning Oak Energy, LLC)Mark Mathis & Jonah Levine, Confluence EnergyTherese Glowacki, Boulder County ParksBrad Worsley, NOVO BiopowerKendric Wait, Eagle Valley Clean EnergyRichard Tucker, Tucker Engineering AssociatesBradd Thomas, Arvos Group (RBS)
AcknowledgementsFinancial and In-kind SupportOur Industry, Agency and NGO PartnersUSDA – National Institute of Food and Agriculture (NIFA) Bioenergy Alliance Network of the Rockies (BANR, an AFRI-CAP) Biomass Research and Development Initiative (BRDI)USDA – U.S. Forest Service Rocky Mountain Research Station National Fire Plan Woody Biomass, Bioenergy, and Bioproducts Competitive Grant
What’s the problem?U.S. Forest Industry10% of energy consumption is renewables46% of renewable energy is biomass24% of renewable energy is from wood & waste(EIA 2018, statistic for CY 2016)
What’s the problem?
What’s the problem?Smurfit-Stone linerboard plant 1 million tonne pulpwood and hog fuel per yearEqual to 69 Nexterra gasifiers (@ 14,500 t yr-1)1.0 to 1.5 million tonnes CO2 (pile burning) 40,000 hectares of treatmentSmurfit-Stone statistics from Morgan 2009, University of Montana 2011, Jones et al. 2010
What’s the solution?
What’s the solution?
1. Small Scale OperationsMill ResiduesPueblo Wood ProductsConiferous live and dead55 bdt of residues per dayComposting operation withlocal dairy farmBiochar Solutions, Inc. 200,000 system price5.4 dry tons feedstock per dayModular, low-cost biocharFlexible feedstock400-700ºC two-stage conversionBiocharSoil amendmentMine reclamationForest, agriculture andgreenhouse applications
MethodsIndustrial Engineering MethodsTime study: 5 weeks, 25 work daysDaily shift-level data and samplesFinancial analysisNet present value on a 10-yr project
ResultsFeedstock BiocharbaggingMachine rate ( hr-1) 163.81 39.78 78.86 48.07n/aProductivity (gt hr-1)13.6113.6154.430.156n/aComponent cost ( gt-1) 12.04 2.92 1.45 308.14 65.99Cumulative cost ( gt-1) 12.04 14.96 16.41 324.55 390.54Annual cost:Annual revenue from biochar:Annual net revenue:NPV for a 10-year project period: 126,597 101,013- 25,554- 168,955
ResultsNPV 0
ResultsNPV 0
ResultsBreak even price: 2.73 kg-1
2. Larger OperationsPhoto: Colorado Public RadioPhoto: CPESPhoto: Pacific BiocharPhoto: CPESTreatment ResiduesFuel treatmentBeetle salvageForest restorationThermochemical pathwaysCombustion heat and powerGasification and pyrolysisCatalytic fuel productionPellet millMulitple productsSingle outputsCombinations of products:Heat, Power, Biochar,Pellets, Liquid fuel
MethodsTechno-Economic Analysis (TEA)Detailed technical specifications financial analysisOutputsInputs Net Present Value (NPV) Breakeven Selling Price Max Feedstock Cost Engineering specifications Production data Capital and operating costs Other economic variablesFinancial OutcomesDozens of VariablesX1X2NPVDiscountedCash FlowModel f(x)X3Monte CarloSimulation with1000s of IterationsSensitivity
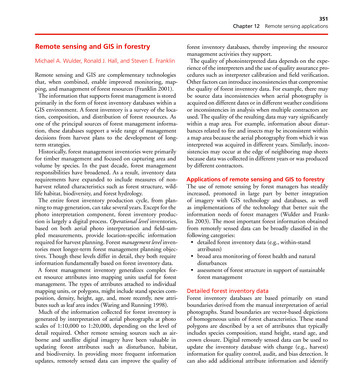
ResultsBiocharBiofuel ScenarioBiofuel Scenario1.43.5Mean NPV 76.0M3.0B/E Feedstock 227 t-12.5Probability Density (10 -8)0.60.40.2B/E Feedstock 97 t-11.51.0NPV (Thousand )8010080600NPV (Million -2021.0-403B/E Feedstock 26 t-1-60Probability Density (10 -8)41.5-80B/E Feedstock 39 t-15-10066020Mean NPV - 8.3M2.07-2,000Power Scenario2.5Mean NPV - 24,0008Probability Density (10 -7)0NPV (Million )Heat Scenario90-20-40NPV (Million ean NPV 22.4M-800.80Probability Density (10 -8)1.0-601.2BiocharPellet ScenarioPellet Scenario4.0
ResultsA. Biochar Biofuel ScenarioB. Biochar Pellet Scenario
Results0000
Results
3. Value Added OperationsLogging & Mill ResiduesMixed western coniferScreenedThermochemical Conversion3 different systems:Confluence Energy (CON)Biochar Solutions, Inc. (BSI)Tucker Engineering Associates (TEA)Activated CarbonRBS industrial rotary calciner3 biochar precursorsSteam injection with N purgeTemperature: 927 C45 min and 65 min trials
Results: BET Surface Area
Results: BET Surface Area
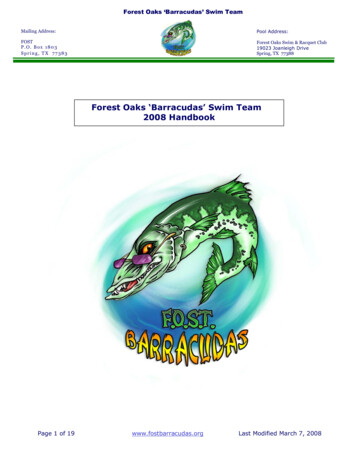
ResultsBiochar5000x/5 µmActivated Carbon5000x/5 µm8000x/2 µm
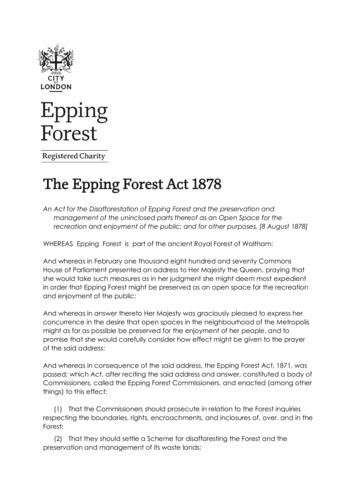
Results: Iodine NumberCOCOTEABSICONCOALCOALCOCO
Results: Iodine NumberCOCOTEABSICONCOALCOALCOCO
Take Home MessagesMore profitable operationsHigh conversion efficiencyIncreased productivity and conversion rateAppropriate scale and system balanceBetter quality feedstock (e.g. moisture, ash, etc.)Multi-product supply chainsHigher and more stable prices for outputsHeat and gas valueBiochar product and market developmentHigh fuel pricesPublic policy (e.g. RINs)
For More InformationEconomics and ManufacturingAnderson, N.; Bergman, R.; Page-Dumroese, D. 2017. A supply chain approach tobiochar systems. Chapter 2 in: Biochar: A Regional Supply Chain Approach in View ofClimate Change Mitigation. Cambridge, UK: Cambridge University Press. p. 25-45.Campbell, R.; Anderson, N. In review. Comprehensive economic evaluation of woodybiomass energy from silvicultural fuel treatments. Journal of EnvironmentalManagement.Campbell, R.; Anderson, N.; Daugaard, D.; Naughton, H. 2018. Technoeconomic andpolicy drivers of project performance for bioenergy alternatives using biomass frombeetle-killed trees. Energies 11(2): 293, 20 pp.Campbell, R.; Anderson, N.; Daugaard, D.; Naughton, H. 2018. Financial viability ofbiofuel and biochar production from forest biomass in the face of market price volatilityand uncertainty. Applied Energy 230, pp.330-343.Kim, D.; Anderson, N.; Chung, W. 2015. Financial performance of a mobile pyrolysissystem used to produce biochar from sawmill residues. Forest Products Journal65(5/6): 189-197.
For More InformationProducts and Life Cycle AssessmentBergman, R.; Gu, H.; Page-Dumroese, D.; Anderson, N. 2017. Life cycle analysis ofbiochar. Chapter 3 in: Biochar: A Regional Supply Chain Approach in View of ClimateChange Mitigation. Cambridge, UK: Cambridge University Press. p. 25-45.Gu, H.; Bergman, R.; Anderson, N.; Alanya-Rosenbaum, S. 2018. Life cycle assessmentof activated carbon from woody biomass. Wood and Fiber Science 50(3): 229-243.Jarvis, J.; Page-Dumroese, D.; Anderson, N.; Corilo, Y.; Rodgers, R. 2014.Characterization of fast pyrolysis products generated from several western USAwoody species. Energy & Fuels 28(10): 6438-6446.Anderson, N.; Jones, J.G.; Page-Dumroese, D.; McCollum, D.; Baker, S.; Loeffler, D.;Chung, W. 2013. A comparison of producer gas, biochar, and activated carbon fromtwo distributed scale thermochemical conversion systems used to process forestbiomass. Energies 6: 164-183.
Contact InformationNate Anderson, Research ForesterRocky Mountain Research StationMissoula, MT, USAnathaniel.m.anderson@usda.gov(406) 329-2122QUESTIONS?
Additional slides forquestions if needed.
MethodsStandard machine rate calculationsCost( gt-1) Machine rate( pmh-1)/Productivity(gt pmh-1)Feedstock cost: 0, Biochar revenue: 2.20 per kilogramOther Assumptions: 8 hrs per day, 260 days per year
ResultsShift-level 235.309.201.4330.285
MethodsDetailed InputsOutputsInputsCapital costsProduction data Feedstock processingcapacity Product conversionrate Operating costs mentBuildingsConstruction & engineeringLandWorking capitalEconomic variables Discount rateFinancingDepreciationTaxesProduct prices & policy incentivesNet PresentValue (NPV)Discounted cashflow model20 Year ProjectPeriodMaximumFeedstockCostMinimumSelling Price
TextRandom variables
ResultsTEA Input PricingVariableMinimumBase-CaseMaximumPellets price 178 t-1 200 t-1 222 t-1Biochar price 899 t-1 1,834 t-1 2,778 t-1Electricity price 50 MWh-1 100 MWh-1 150 MWh-1Biofuel price 1.59 gal-1 2.36 gal-1 2.96 gal-1Heat price 2.52 MMBtu-1 5.35 MMBtu-1 10.83 MMBtu-1Feedstock price 0 t-1 40 t-1 80 t-1
Assumptions
Results
Results
Economics and Manufacturing Anderson, N.; Bergman, R.; Page-Dumroese, D. 2017. A supply chain approach to biochar systems. Chapter 2 in: Biochar: A Regional Supply Chain Approach in View of Climate Change Mitigation.