Transcription
Insight. Innovation. Transformation.The Change Healthcare2020 Revenue CycleDenials IndexA review of national medical claim denial trends, with strategies to helpproviders decrease their denial rate
Table of Contents03Executive Summary05Research Methodology10Denials Trends and Causes15Avoidable and Recoverable Denials23Recommendations27Frequently Asked Questions29Additional ResourcesThe Change Healthcare 2020 Revenue Cycle Denials Index 2020 Change Healthcare LLC and/or one of its subsidiaries. All Rights Reserved.2
Executive SummaryThe Change Healthcare 2020 Revenue Cycle Denials Index 2020 Change Healthcare LLC and/or one of its subsidiaries. All Rights Reserved.3
Executive SummaryThe Change Healthcare 2020Denials Index is an analysis of 102million hospital transactionsvalued at 407 billion in totalcharges across more than 1,500U.S. hospitals.The research insights were drawnfrom Change Healthcare’s datanetwork, one of the largest in U.S.healthcare with more than 1 millionphysicians, 6,000 hospitals, and2,400 payer connections; touching1 in 3 U.S. patient records; andprocessing 15 billion healthcaretransactions worth 1.5 trillionannually.The Change Healthcare 2020 Revenue Cycle Denials IndexKey insights of this year’s report include: 2020 Change Healthcare LLC and/or one of its subsidiaries. All Rights Reserved.The average denials rate is up 23% since 2016, topping 11.1% of claimsdenied upon initial submission through the third quarter of 2020.Since the onset of COVID-19, denials have risen 11% nationally.The highest denial rates are in regions with the highest first-waveof COVID-19 outbreaks: the Pacific Coast and the Northeast, bothtopping 13% of claims denied on initial submission in 2020.Half of denials are caused by front-end revenue cycle issues(Registration/Eligibility, Authorization, Service Not Covered).The top denials cause remained constant since 2016: Registration/Eligibility, approaching 27% of denials.86% of denials are potentially avoidable; nearly a quarter (24%) ofthese are not recoverable. The conclusion: Revenue loss is occurringthat is preventable.4
ResearchMethodologyThe Change Healthcare 2020 Revenue Cycle Denials Index 2020 Change Healthcare LLC and/or one of its subsidiaries. All Rights Reserved.5
Denials Index Research MethodologyThe Change Healthcare 2020Revenue Cycle Denials Index isbased on an internal analysis of 102 million hospital claimremits valued at 407 billion intotal charges across more than1,500 hospitals.Change Healthcare revenue cycleanalysts used primary institutionalinpatient and outpatient claimssubmitted by a range of small,medium, and large facilities. Theseclaims were processed by ChangeHealthcare from July 2019 throughJune 2020.The Change Healthcare 2020 Revenue Cycle Denials Index 2020 Change Healthcare LLC and/or one of its subsidiaries. All Rights Reserved.The 2019-2020 data was thencompared and trended against2016 data reported in the ChangeHealthcare 2017 Denials Indexreport, published in June 2017 atthe HFMA Annual Conference.The data used for the 2020Denials Index report is based oninternal Change Healthcare dataand might or might not berepresentative.6
Denials Steadily RisingThrough 2Q 2020, the average denials rate is up 20% since 2016, hitting 10.8% of claims denied upon initialsubmission in 2020.National Denials Trend2016-2020 (2nd 0%0.0%2016Full Year2019 (Jul-Dec)2nd Half2020 (Jan-March)1st Quarter2020 (Apr-Jun)2nd QuarterPandemic RisingPandemic CrisisChange Healthcare internal data, 2016-2020The Change Healthcare 2020 Revenue Cycle Denials Index 2020 Change Healthcare LLC and/or one of its subsidiaries. All Rights Reserved.7
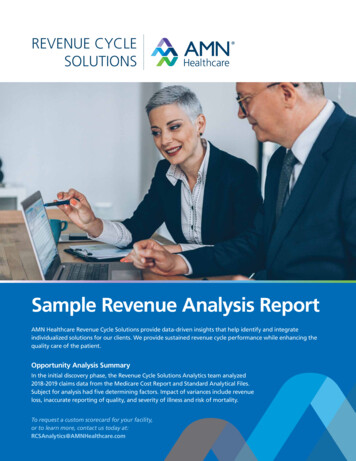
Denials Rising UnabatedThe national denials rate topped 11% of claims denied upon initial submission in Q3 2020—bringing the totalincrease to 23% since 2016. The questions remain: How long will the trend last, how high will the denials rate go,and what can providers do to stem the trend?National Denials Trend2016-2020 (3rd Quarter)12.0%10.0%9.0%9.5%10.8%11.1%2020 (Jan-March)1st Quarter2020 (Apr-Jun)2nd Quarter2020 (Jul-Sep)3rd QuarterPandemic RisingPandemic CrisisPandemic10.0%8.0%6.0%4.0%2.0%0.0%2016Full Year2019 (Jul-Dec)2nd HalfChange Healthcare internal data, 2016-2020The Change Healthcare 2020 Revenue Cycle Denials Index 2020 Change Healthcare LLC and/or one of its subsidiaries. All Rights Reserved.8
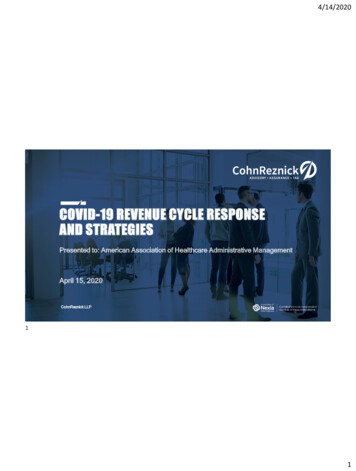
Denials by RegionThe highest denial rates nationally are in regions with the highest first-wave of COVID outbreaks: the PacificCoast and the Northeast.Denials Average, 2019-2020Pacific 13.1%Northeast 12.9%Southern Plains 10.5%Midwest 9.7%Northern Plains 9.2%New England 8.8%Southeast 7.4%Mid-Atlantic 7.3%Mountain 6.7%AlaskaHawaiiThe Change Healthcare 2020 Revenue Cycle Denials Index 2020 Change Healthcare LLC and/or one of its subsidiaries. All Rights Reserved.Puerto Rico9
Denials Trendsand CausesThe Change Healthcare 2020 Revenue Cycle Denials Index 2020 Change Healthcare LLC and/or one of its subsidiaries. All Rights Reserved.10
Denials TrendsBoth the Pacific and Northeast regions were nearing a 14% denial rate the first six months of 2020, an increaseof 11.7% and 12.2%, respectively, compared to 2019. Overall, denials are up across the country, with only theSouthern Plains region 00%13.85%13.63%14.00%7.79%6.88%10.59% 10.41%9.79%9.24%8.34%8.65%7.81%7.08%6.61% inNew EnglandNortheast2H 2019The Change Healthcare 2020 Revenue Cycle Denials Index 2020 Change Healthcare LLC and/or one of its subsidiaries. All Rights Reserved.1H 2020Northern PlainsPacificSoutheastSouthern PlainsCOVID-19 Hot Spot11
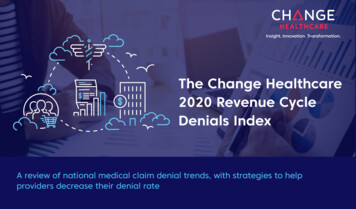
Denials Start HereThe top cause of denials has remained constant since 2016: Registration/Eligibility, approaching 27% of denials.Registration / Eligibility26.6%Missing or Invalid Claim Data17.2%Authorization / rvice Not Covered10.6%Medical Documentation Requested9.2%Medical Necessity6.6%Unknown6.4%Untimely Filing5.4%Medical Coding4.8%Provider Eligibility0.9%Avoidable Care0.7%The Change Healthcare 2020 Revenue Cycle Denials Index 2020 Change Healthcare LLC and/or one of its subsidiaries. All Rights Reserved.Methodology: Remit processingcategorizes adjustment codes andassociated dollars on remits intoone of five categories: contractadjustment, bundled charges,prior payment adjustment, patientresponsibility, and denials. Denialsare then broken down into one ofnine causes presented here. Wethen associate denials causes withfront-end, mid-cycle, or back-endrevenue cycle stages.12
Denials Over TimeThe top reason for denials–Registration/Eligibility–has remained constant over time. This, plus missing or invalidclaim data, have become greater drivers of denials since 2016. The good news: Denials due to Avoidable Care/Appropriateness of Care have decreased 80%, and are nearly eradicated. Other denials causes have remainedrelatively stable over time.Share of Denials by Cause 2016 - 2019/2020Avoidable Care/Appropriateness of CareProvider EligibilityMedical CodingUntimely FilingOtherMedical NecessityMedical Documentation RequestedService Not CoveredAuthorization / Pre-CertificationMissing or Invalid Claim DataRegistration / Eligibility0.0%Change Healthcare internal data, 2016-2020The Change Healthcare 2020 Revenue Cycle Denials Index 2020 Change Healthcare LLC and/or one of its subsidiaries. All Rights Reserved.5.0%Full Year 201610.0%15.0%20.0%25.0%30.0%2H 2019-1H 202013
Denials Cluster HereAggregated Denials Share by Revenue Cycle Stage, %49.7%Half of denials are caused byfront-end revenue cycle issues.21.3%The Change Healthcare 2020 Revenue Cycle Denials Index 2020 Change Healthcare LLC and/or one of its subsidiaries. All Rights Reserved.14
Avoidable andRecoverable DenialsThe Change Healthcare 2020 Revenue Cycle Denials Index 2020 Change Healthcare LLC and/or one of its subsidiaries. All Rights Reserved.15
Focus on the Top Driver“One in four denials originates in Registrationand Eligibility. It’s time to take a hard look atthe dollars and time these denials representand focus on denial prevention in this area.”– Nicholas Raup, Associate Vice President, ProductManagement, Revenue Cycle, Change HealthcareThe Change Healthcare 2020 Revenue Cycle Denials Index 2020 Change Healthcare LLC and/or one of its subsidiaries. All Rights Reserved.16
Denials Are Preventable86% of denials are potentially avoidable; only 14% are unavoidable. Nearly one in four potentially avoidabledenials (24%) cannot be %0%The Change Healthcare 2020 Revenue Cycle Denials Index 2020 Change Healthcare LLC and/or one of its subsidiaries. All Rights Reserved.17
Denials Are PreventableOf the 34% of denials that are unequivocally avoidable, nearly one in two (48%) cannot be recovered. Preventionis the key to avert revenue e Change Healthcare 2020 Revenue Cycle Denials Index 2020 Change Healthcare LLC and/or one of its subsidiaries. All Rights Reserved.18
Denials Are PreventableFor every denials cause except Medical Documentation Requested, the percentage of potentially avoidabledenials nearly matches the percentage of all denials for that category. This indicates, again, that nearly alldenials are potentially avoidable.Denials Share, Avoidance, and Recoverability by Cause, 2019-202030.0%Share of denials25.0%Avoidable/Situationally AvoidableAvoidable/Non recoverable20.0%15.0%10.0%5.0%0.0%Registration /EligibilityMissing or Invalid Authorization /Claim DataPre-CertificationThe Change Healthcare 2020 Revenue Cycle Denials IndexService notcovered 2020 Change Healthcare LLC and/or one of its subsidiaries. All Rights sityOtherUntimely FilingMedical Coding Provider Eligibility Avoidable Care19
Breakout: Top Denials Root CausesPotentially Avoidable Denials, Top Root Causes, 2019-2020Registration/Eligibility (26.6%)Authorization/Pre-Certification (11.6%)Coordination of Benefits41.5%Invalid Authorization61.2%Benefit Maximum28.4%Authorization Denied25.9%Plan Coverage23.3%Services Exceed Authorization7.5%Other5.4%Other6.8%Missing or Invalid Claim Data (17.2%)Medical Necessity (6.6%)Unspecified Billing Issue73.2%Medical Necessity71.5%Missing/Invalid EOB17.5%Level of Care22.1%Other9.3%Service Not Covered (10.6%)Other6.4%Medical Coding (4.8%)Service Not Covered57.7%Overlapping Services52.7%Unspecified Billing Issue22.3%Procedure/ Dx Code Inconsistent with Another Code18.8%Managed Care10.6%Level of CareNon-Covered DaysOtherThe Change Healthcare 2020 Revenue Cycle Denials Index 2020 Change Healthcare LLC and/or one of its subsidiaries. All Rights Reserved.5.2%4.2%Other7.2%21.3%20
Denials Prevention is Key“We know that 95-100% of non-recoverabledenials can likely be avoided. Providers needto implement a denials-prevention strategy forfront-end processes that includes staff educationand training and the use of advanced technology.This approach can help cut denials dramatically,and in turn, the time and expense associated withappeals, and the risk of lost revenue.”– Nicholas Raup, Associate Vice President, ProductManagement, Revenue Cycle, Change HealthcareThe Change Healthcare 2020 Revenue Cycle Denials Index 2020 Change Healthcare LLC and/or one of its subsidiaries. All Rights Reserved.21
Why Denials Are RisingLack of DenialsResourcesStaff Attrition andTraining Lack of data for rootcause analysisfiling deadlines and education programs Clinical staff required tomanage growing numberof clinical denialsThe Change Healthcare 2020 Revenue Cycle Denials Index 2020 Change Healthcare LLC and/or one of its subsidiaries. All Rights Reserved.need for updating ofRCM/HIS systems analyzing root causesfails to reduce volume Lack of denialsprevention strategieson the front-end andmid-cycleWorkflows not automatedfor clinical attachmentsA focus on remedyingor to manage highestindividual denials vs.Complexity of denialsOngoing regulatorychanges and constantPeak seasons, staffingbacklogs due to timelyrequires robust trainingLack of expertise tosupport appeals staff challenges expand denialTight labor marketretaining of qualifiedresources to help preventcomplex clinical cases impacts hiring andLack of experienceddenials, especially inGrowing DenialsBacklogLegacyTechnologypriority denials No or limited investmentin modern analytics/AI that can flag denialspre-submission relativeto payers22
RecommendationsThe Change Healthcare 2020 Revenue Cycle Denials Index 2020 Change Healthcare LLC and/or one of its subsidiaries. All Rights Reserved.23
Denials Reduction: Five Tips1. Determine where denials are originating and their root causes.Are most denials originating in your patient access and registration departments? Are denials occurringbecause of insufficient documentation, or due to billing or coding errors?2. Prioritize remediation based on where and what actions will have the greatest impact.For example, do you need to focus on the front-end, mid-cycle, back-end, or all three? Within those realms,do you need to work with a certain physician or a specific payer? Prioritization is crucial to ensuring yourefforts generate the greatest return.3. Consolidate revenue cycle technology with a single “end to end” vendor.Difficulty in reducing denials or rising denials rates can be a warning sign that legacy or inadequatetechnology and services, or a mashup of point solutions, are being used to manage the revenue cycle.There is a growing industry effort to consolidate end-to-end technology solutions with a single vendor tooptimize financial performance, improve operational effectiveness, and ease maintenance and upgrades.The Change Healthcare 2020 Revenue Cycle Denials Index 2020 Change Healthcare LLC and/or one of its subsidiaries. All Rights Reserved.24
Denials Reduction: Five Tips4. Benefit from advanced analytics and AI.Many providers have limited or no access to analytics and AI, while payers continue to invest inthese technologies. This can place providers at a disadvantage, as payers’ ability to accuratelydetect claim issues increases, while providers’ ability to prevent and address denials is stagnantor wanes. To level the playing field, providers must invest in these technologies to identify wheredenials are originating so root problems can be addressed; to prioritize appeals; and todrive efficiencies.5. Choose the right partner.Change Healthcare offers end-to-end advanced revenue cycle management solutions for providers ofall sizes. Advanced analytics solutions such as Change Healthcare’s Acuity Revenue Cycle AnalyticsTMand Pulse Revenue Cycle BenchmarkingTM can help providers understand their denials problem andbegin to prevent denials more strategically. And Change Healthcare’s Assurance ReimbursementManagementTM, Clearance Patient Access Suite, InterQual Suite, and technology-enabled servicessuch as our Denials and Appeals Management, help providers address their toughest revenue cyclechallenges so their organization can remain focused on what matters most: providing excellentpatient care.The Change Healthcare 2020 Revenue Cycle Denials Index 2020 Change Healthcare LLC and/or one of its subsidiaries. All Rights Reserved.25
Analytics Provide the Answers“Analytics are the key to understanding yourdenials problem and to implementing adenials-prevention strategy. Focus your effortswhere denials are avoidable. And when denialsdo occur, an automated appeals-managementsolution, along with employing clinical experts,is crucial. Lastly, make sure you identify thosedenials that are non-recoverable early, so yourteams don’t waste time working them.”– Nicholas Raup, Associate Vice President, ProductManagement, Revenue Cycle, Change HealthcareThe Change Healthcare 2020 Revenue Cycle Denials Index 2020 Change Healthcare LLC and/or one of its subsidiaries. All Rights Reserved.26
Frequently Asked QuestionsThe Change Healthcare 2020 Revenue Cycle Denials Index 2020 Change Healthcare LLC and/or one of its subsidiaries. All Rights Reserved.27
Frequently Asked QuestionsQ. Why was there was a spike in denials during the peak months of COVID-19 earlier in the year [2020]?A. We found two potential reasons. One was the more technical type of denial impacted by interruption of staff productivity–such asregistration and eligibility, missing claim data, and untimely filing, in particular. Organizations were struggling to transition from the office toworking from home, and we think that interruption in productivity can be seen in the denial rates. Second, medical documentation requestsalso had a higher rate of denials during that period. The reduction in elective surgeries left a larger percentage of more complex cases. Thesenon-elective, often complex surgeries typically receive documentation requests. The increase of these types of claims coming through mighthave resulted in more medical documentation requests to process, and thus a correspondingly higher rate of denials.Q. We have denial challenges related to medical documentation requests. What steps should we take to assist with that?A. Medical documentation requests are a challenge across the industry. Look for a vendor that automatically sends your attachments via themost expeditious channel each payer accepts: electronically, fax, or mail. Electronic attachments reduce the risk your documentation will belost in the mail, or that the payer will not be able to match the paper attachment to the electronic claim, thereby reducing your risk of denial.An electronic solution can also let you know automatically when a payer requires additional documentation, and let you track the attachmentall the way through the process showing when it’s created, sent, acknowledged, pending, or errored.Q. How do you go about focusing on the area of the revenue cycle where you can have the greatest impact onreducing denials?A. The first step is to conduct an analysis to determine where the majority of your denials are originating. Analytics will also enable you to drilldown to identify root causes. Next, prioritize your interventions; determine where to focus your energy and actions based on where you canhave the greatest impact. Then, assess your internal resources, processes, and tools to see what is needed, then evaluate external resourcesto supplement where needed.The Change Healthcare 2020 Revenue Cycle Denials Index 2020 Change Healthcare LLC and/or one of its subsidiaries. All Rights Reserved.28
Additional ResourcesThe Change Healthcare 2020 Revenue Cycle Denials Index 2020 Change Healthcare LLC and/or one of its subsidiaries. All Rights Reserved.29
Enabling Connected HealthcareGiving our customers actionable insights gained from one of the largest networks in healthcare todayChange Healthcare internal dataThe Change Healthcare 2020 Revenue Cycle Denials Index 2020 Change Healthcare LLC and/or one of its subsidiaries. All Rights Reserved.30
How Change Healthcare Can HelpRCM Complete is an end-to-end revenue cycle management solution that usesinnovative technology and expert services to create exception-based workflowsthat help prevent denials and accelerate reimbursement.The same advanced analytics and talent that revealed this report’s insights canhelp you improve your organization’s performance. Join thousands of otherhospitals, health systems, and physician practices who rely on the power of theChange Healthcare platform.Visit our Revenue CycleSolutions PortalThe Change Healthcare 2020 Revenue Cycle Denials Index 2020 Change Healthcare LLC and/or one of its subsidiaries. All Rights Reserved.
Insight. Innovation. Transformation.Change Healthcare (Nasdaq: CHNG) is a leading independent healthcare technology company, focused on insights,innovation and accelerating the transformation of the U.S. healthcare system through the power of the Change HealthcarePlatform. We provide data and analytics-driven solutions to improve clinical, financial, administrative, and patientengagement outcomes in the U.S. healthcare system.@ 2020 Change Healthcare LLC and/or one of its subsidaries. All Rights Reserved.
Revenue Cycle Denials Index is based on an internal analysis of 102 million hospital claim remits valued at 407 billion in total charges across more than 1,500 hospitals. Change Healthcare revenue cycle analysts used primary institutional inpatient and outpatient claims submitted by a range of small, medium, and large facilities. These