Transcription
ARTICLEDOI: Hdac2-eNOS circuitry identifies earlycardiovascular precursors in naive mouseembryonic stem cellsChiara Cencioni1,2, Francesco Spallotta1, Matteo Savoia1,3, Carsten Kuenne4, Stefan Guenther4, Agnese Re2,Susanne Wingert5, Maike Rehage5, Duran Sürün5, Mauro Siragusa6, Jacob G. Smith7, Frank Schnütgen5,Harald von Melchner5, Michael A. Rieger5, Fabio Martelli8, Antonella Riccio7, Ingrid Fleming 6,Thomas Braun9, Andreas M. Zeiher10, Antonella Farsetti2,10 & Carlo Gaetano 1,11Nitric oxide (NO) synthesis is a late event during differentiation of mouse embryonic stemcells (mESC) and occurs after release from serum and leukemia inhibitory factor (LIF). Herewe show that after release from pluripotency, a subpopulation of mESC, kept in the naivestate by 2i/LIF, expresses endothelial nitric oxide synthase (eNOS) and endogenouslysynthesizes NO. This eNOS/NO-positive subpopulation (ESNO ) expresses mesendodermalmarkers and is more efficient in the generation of cardiovascular precursors than eNOS/NO-negative cells. Mechanistically, production of endogenous NO triggers rapid Hdac2S-nitrosylation, which reduces association of Hdac2 with the transcriptional repressionfactor Zeb1, allowing mesendodermal gene expression. In conclusion, our results suggestthat the interaction between Zeb1, Hdac2, and eNOS is required for early mesendodermaldifferentiation of naive mESC.1 Division of Cardiovascular Epigenetics, Department of Cardiology, Goethe University, Theodor-Stern-Kai 7, 60590 Frankfurt am Main, Germany. 2 NationalResearch Council, Institute of Cell Biology and Neurobiology (IBCN), Via del Fosso di Fiorano 64, 00143 Rome, Italy. 3 Institute of Medical Pathology,Università Cattolica di Roma, Largo Francesco Vito 1, 00168 Rome, Italy. 4 ECCPS Bioinformatics and deep sequencing platform, Max Planck Institute forHeart and Lung Research, Ludwigstrasse 43, 61231 Bad Nauheim, Germany. 5 LOEWE Center for Cell and Gene Therapy and Department of Medicine,Hematology/Oncology, Goethe University, Theodor-Stern-Kai 7, 60590 Frankfurt am Main, Germany. 6 Institute for Vascular Signalling, Centre for MolecularMedicine, Goethe University, Theodor-Stern-Kai 7, 60590 Frankfurt am Main, Germany. 7 MRC Laboratory for Molecular Cell Biology, University CollegeLondon, Gower St, Kings Cross, London WC1E 6BT, UK. 8 Molecular Cardiology Laboratory, IRCCS-Policlinico San Donato, Via Morandi 30 San DonatoMilanese 20097 Milan, Italy. 9 Department of Cardiac Development and Remodeling, Max-Planck-Institute for Heart and Lung Research, Ludwigstrasse 43,61231 Bad Nauheim, Germany. 10 Internal Medicine Clinic III, Department of Cardiology, Goethe University, Theodor-Stern-Kai 7, 60590 Frankfurt am Main,Germany. 11 Laboratorio di Epigenetica, Istituti Clinici Scientifici Maugeri, Via Maugeri 4, 27100 Pavia, Italy. These authors contributed equally: ChiaraCencioni, Francesco Spallotta. Correspondence and requests for materials should be addressed to C.C. (email: chcencioni@gmail.com)or to A.F. (email: antonella.farsetti@cnr.it) or to C.G. (email: carlo.gaetano@icsmaugeri.it)NATURE COMMUNICATIONS (2018)9:1281 DOI: 10.1038/s41467-018-03668-0 www.nature.com/naturecommunications1
ARTICLENATURE COMMUNICATIONS DOI: 10.1038/s41467-018-03668-0The gaseous product of nitric oxide synthases (NOS), nitricoxide (NO), has been reported among the compoundsable to control Nanog expression and function1,2, thussuggesting a possible role in the regulation of mESC fate2. A bodyof literature, in fact, established NO as an essential factor forcardiovascular precursor generation during mESC cardiovascularlineage commitment3–5. This effect seems to depend on experimental conditions and, at least in one report, it has beendescribed that low doses of NO may repress differentiation6. Ofnote, all these observations were made by adding exogenoussources of NO to the mESC medium or expressing a wild-typeeNOS in cells cultured in the presence of leukemia inhibitoryfactor (LIF)2,4,5,7. Most commonly, the endogenous NO production has been described as a relatively late event occurring inmESC after release from pluripotency and associated with theexpression of functional NOS isoforms8. Nevertheless, previousexperiments established that, in vivo, NO might also be an activemolecule during the very early phases of preimplantation embryoattachment9. Surprisingly, in this condition the NO concentrationhas never been established and, how the endogenous productionof NO might be regulated at very early embryonal differentiationstages is currently unknown. The “ground state-like” (GS) culturesystem may help to provide more information about this aspect.NO is crucial for some biological functions including the regulation of epigenetic enzymes7,10–13. Specifically, NO controls theactivity of histone deacetylases (Hdacs) at multiple levels7,10–13.For example, it inhibits the nuclear function of class I Hdac2 bydirect S-nitrosylation10,13 and facilitates the nuclear translocationof class II Hdacs, including Hdacs 4 and 5, depending on proteinphosphatase 2A (PP2A) activation in response to cyclic guanosinemonophosphate (cGMP) production7,11. Hdacs are master regulators of the differentiation process and in particular, Hdac2,coupled to its cognate corepressor Hdac1, is involved in maintenance of mESC pluripotency through cooperation with Oct4and Nanog14. Recently, the role of these two Hdacs has beenfurther dissected15,16. Although Hdac1 has been found importantfor early cardiovascular commitment of mESC, while Hdac2 couldbe apparently dispensable15, later work16 demonstrated the relevance of both class I Hdacs in mESC proliferation and pluripotency. Interestingly, Hdac1 and Hdac2 are differentiallyregulated by numerous post-translational modifications (PTMs)17.Hdac1 has been reported phosphorylated, acetylated, SUMOylated,and ubiquitinylated, while Hdac2, similarly to Hdac618, was alsofound S-nitrosylated. Surprisingly, in skeletal muscle, Hdac2 Snitrosylation seemed to have negative effects on the function ofboth Hdacs10. Moreover, the diverse Hdac-specific PTMs havebeen found relevant to the pathophysiology of cardiovascular diseases19. Whether Hdac2 S-nitrosylation might play a role duringthe early mesendodermal commitment of naive mESC and whether, in the presence of NO, Hdac2 might affect Hdac1 function,remains unexplored.The Zinc finger E-box binding homeobox 1 and 2 transcriptionrepressor factors (Zeb1; Zeb2) are essential players in theepithelial-to-mesenchymal transition (EMT), a process able toreorganize epithelial cells to become migratory mesenchymalcells20–22. Zeb factors, in fact, directly target E-cadherintranscription, determining its downregulation, a hallmark ofEMT21,23. Interestingly, genetic inactivation studies indicated acrucial role of Zeb1 also during embryonic development24–27.Specifically, Zeb1 knock-out mice exhibited alterations compatible with neuroectodermal defects, neural crest EMT impairment, and aberrant bone formation26,27. In recent studies, thesporadic insurgence of vascular changes and hemorrhages werealso reported25. Hence, Zeb1 genetic inactivation determinedcomplex phenotypes affecting the development of ectodermal andmesendodermal structures24–27.2NATURE COMMUNICATIONS (2018)9:1281According to prior work, the miR-200 family is induced by NOdonors and contributes to Zeb2 downregulation during mESCmesendodermal differentiation28. Although evidence implicatesZeb2 in the repression of mesendodermal commitment inmESC28, this phenomenon has not been mechanisticallyaddressed nor has the role of Zeb1 been established in thiscontext. Recently, Zeb1 has been reported associated with class IHdacs as part of a larger repressor complex23,29. This evidencesuggests the presence of a molecular circuitry involving mir-200,Zeb factors, Hdacs and pluripotency genes contributing to keepmESC undifferentiated30. This hypothesis is supported by the roleof Zeb1 in the maintenance of cancer stem cells21, an effectmediated by transcriptional repression of miRs involved in EMTprogression control22. Nevertheless, from all these studies littleinformation emerges about Zeb1 and its role as a negativedeterminant of embryonic differentiation.In the present manuscript, we describe Zeb1 orchestrating,together with Hdac2, a transcriptional repression network ofimportant mesendodermal-associated genes whose expression isfacilitated in a Zeb1-reduced environment. Among the repressedgenes we found eNOS, a determining factor for early mesendodermal commitment of naive mESC8. In this context, cellsexpressing eNOS and synthesizing NO, in the presence ofS-nitrosylated Hdac2 and low levels of Zeb1, have been identifiedas early precursors that, once isolated, were able to recapitulatethe mesendodermal/cardiovascular lineage differentiationprogram.ResultsNO activates mesendodermal commitment in naive mESC.Unless otherwise indicated, all experiments in mESC wereperformed in GS condition31 according to the 2i/L protocol. Asexpected, in comparison to culture medium with serum and LIFalone (defined as standard medium, SM), GS cultures appeared asrelatively spherical colonies with homogenous morphology andbetter-defined borders (Supplementary Fig. 1a). In this condition,mESC expressed higher levels of pluripotency-associated proteinsincluding Klf4, Nanog, Oct4, and Sox2 (Supplementary Fig. 1b).To compare the biological responses to NO of mESC grown inSM vs. GS, cells were released for 24 h from inhibitors andcultured in complete medium supplemented with 10% fetalbovine serum in the absence (differentiation medium, DM) orpresence of the NO donor diethylenetriamine NONOate32 (DMplus DETA/NO, NO). This treatment changed the shape of cellclusters characterized by enlarged flat colonies with irregularmargins (Supplementary Fig. 1a, DM vs. NO). To assess NOresponsiveness at the molecular level, we evaluated the expressionof the miR-200 family members. In SM, miR-200b, miR-200a,and miR-429 were induced after LIF withdrawal (DM), an effectenhanced in NO (Supplementary Fig. 1c, middle upper graph)28.Of note, miR-200c and miR-141, belonging to the miR-200 familycluster 2 and mapping to mouse chromosome 6 (SupplementaryFig. 1c, left lower cartoon), were not significantly upregulated byNO compared to controls (Supplementary Fig. 1c, middle lowergraph). Conversely, in cells released from GS in the presence ofNO, miR-200 family member induction was robust and significant for all cluster components (Supplementary Fig. 1c, rightgraphs). The relative primiR expression was also analyzed inmESC released from GS with or without NO. Specifically, theprimiR transcribed from cluster 1 was significantly induced byNO while that of cluster 2 was less sensitive being already significantly expressed in cells cultured in DM alone (SupplementaryFig. 1d). The reason why cluster 2 was less responsive to NOsignaling is currently unknown. However, published data suggestthat the two clusters might be differentially regulated at DOI: 10.1038/s41467-018-03668-0 www.nature.com/naturecommunications
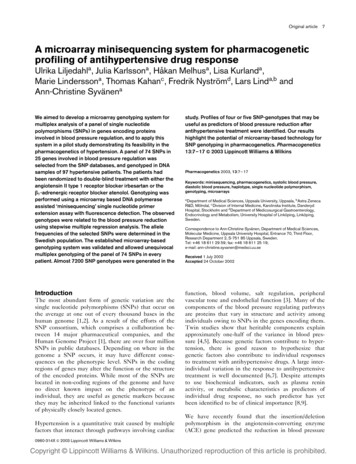
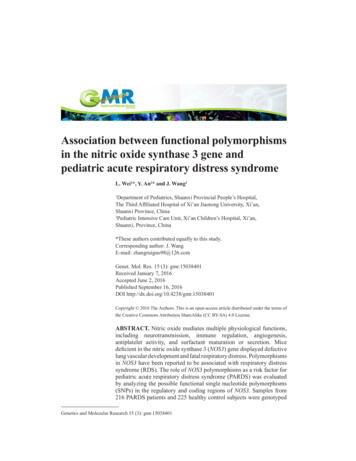
ARTICLENATURE COMMUNICATIONS DOI: 10.1038/s41467-018-03668-0CountsacColor keyand histogramGO: 50789 biological processGO: 8152 metabolic processGO: 32502 developmental processGO: 48513 organ developmentalGO: 30154 cell differentiationGO: 9653 body morphogenesisGO: 9888 tissue developmentGO: 9887 organ morphogenesisGO: 9790 embryonic developmentGO: 35295 tube developmentGO: 1501 skeletal system developmentGO: 30097 hemopiesisGO: 48514 blood vessel morphogenesisGO: 61061 muscle tissue developmentGO: 7507 heart developmentGO: 1525 angiogenesisGO: 3013 circulatory system process500–1 –0.5 00.51NO / GS4logFC20–20510051015303540GO: 32875 localizationGO: 43068 cell deathGO: 32103 response to external stimulusGO: 48690 axonogenesisGO: 21626 CNS maturationGO: 21578 hindbrain maturationGO: 48691 axon extensionGO: 48687 injered axon sproutinglogCountsGS2520Percentage (%)–4NO15DM05101520Percentage (%)bUpregulated transcriptsdNO / DMNO / GSeZeb1 91011f130.814151607371718314PromoterCoding exonDownstreamIntron5′UTRDistal intergenic3′UTR12123819XZeb1 ChIPY0DM / GS2468Percentage (%)Input10Read count permillion mapped readsNO / DMChromosomeDownregulated transcripts233%8DM / GSNO / GS5%11%29%39%Zeb1 1Zeb1 2Zeb1 30.60.40.212–5000TSS33%66%TES5000Genomic regions (5′ – 3′)Fig. 1 Identification of NO-responsive transcripts and Zeb1-associated genomic regions. a Heatmap showing the 50 most differentially regulated genes inmESC cultured for 24 h in GS, DM, or NO identified by total RNA sequencing analysis (n 3 each group). Red and blue represent over- and underexpressed genes, respectively. b Venn diagrams depicting the distribution of upregulated (upper panel) and downregulated (lower panel) unique orcommon transcripts among GS, DM, or NO conditions. c Left panel: MA plot of differentially regulated genes expressed in mESC cultured for 24 h in NOcompared to GS condition. Red dots show genes with a p adjusted value 0.05. Right panels: Gene ontology analysis of NO-differentially regulatedtranscripts between mESC cultured in GS and NO. Upregulated genes depicted in the upper panel, red bar graph; downregulated genes in the lower panel,blue bar graph. d Distribution of chromatin–associated Zeb1 regions over mouse chromosomes. Black bars: percentage of all chromatin/Zeb1-associatedregions; gray bars: background derived from input samples (n 3). e The pie chart illustrates the distribution of chromatin-associated Zeb1 regions (Zeb1ChIP) over specific genomic features depicted as follows: (i) promoters encompassing 3000 bp upstream of the transcription start site (TSS) (blue sector);(ii) downstream regions encompassing 3000 bp from transcription end site (TES) (red sector); 5′ UTRs (green sector) and 3′ UTRs (purple sector) as wellas coding exons (turquoise sector) and introns (orange sectors) relative to the gene bodies; iii) distal intergenic regions (light blue sectors). Input andZeb1-ChIP represented in the left and right pie chart respectively. f Gene body profile depicting Zeb1-ChIP regions distribution in association with TSS orTES produced by ngsplotNATURE COMMUNICATIONS (2018)9:1281 DOI: 10.1038/s41467-018-03668-0 www.nature.com/naturecommunications3
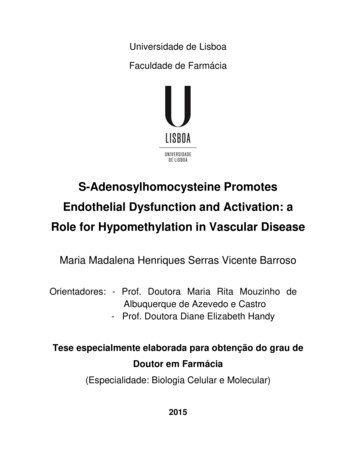
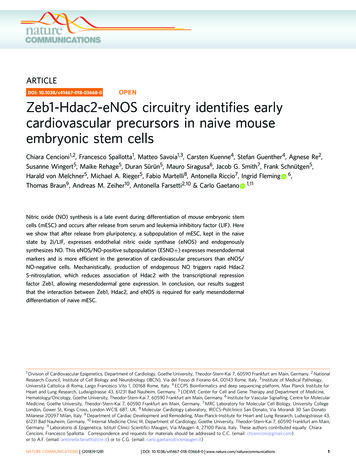
ARTICLENATURE COMMUNICATIONS DOI: 10.1038/s41467-018-03668-0aNO up-genesGO: 32502 developmental processGO: 48856 anatomical structure development583GO: 48869 cellular developmental processGO: 48513 organ developmentRNA-SeqGO: 30154 cell differentiationGO: 9653 anatomical structure morphogenesis442GO: 9887 organ morphogenesisGO: 9790 embryonic developmentChIP-SeqGO: 8015 blood circulationGO: 48598 embryonic morphogenesisGO: 48514 blood vessel morphogenesis9757Wnt3, Wnt7b,Dll1, Tbx4, Mesp2GO: 48332 mesoderm morphogenesisGS Zeb1 targets0510152025303540Percentage (%)ChIP SeqRNA 10GS088GS00RNA Input070Input070GS0120ChIP SeqTSSDll10120088GSGS000TSSTSSTSSFig. 2 Zeb1 binds chromatin at NO-responsive mesendodermal gene promoters. a Left panel: Venn diagram showing intersection between 1025 NOupregulated genes (NO up-genes) identified by RNA Seq analysis (red circle) and 10199 gene promoters in which Zeb1 has been found associated withchromatin at TSS in cells cultured in GS condition (GS Zeb targets; blue circle). 442 common targets were found (gray area). Right panel: The gray arrowpoints to the result of gene ontology analysis based on the 442 common targets at the intersection between RNA-seq and ChIP-seq (left panel). The fivemost represented genes, alias Mesp2, Wnt3, Wnt7b, Tbx4, and Dll1, listed in the blue colored inset. b Sashimi plots showing detailed peak positioning asdetermined by RNA-seq and ChIP-seq data for each selected mesendodermal gene. Specifically, for each plot, RNA-seq data related to GS (light green) orNO (red) culture conditions and ChIP-seq data related to GS for input (dark green) and Zeb1 localization (blue) were representedtranscription level by mechanisms involving DNA methylationand Polycomb complex function33. Furthermore, p53 positivelyregulates the miR-200 family transcription34,35 and NO is amongthe signaling molecules regulating p5335. Specifically, DETA/NOstabilizes p53 level and increases its acetylation at lysine residue379 (Supplementary Fig. 1e). In this condition, chromatinimmunoprecipitation (ChIP) showed p53 bound to the miR-200cluster 1 promoter region (Supplementary Fig. 1f).The effect of DETA/NO on naive mESC has been furtherassessed comparing GS, DM, and NO by transcriptome analysis.Specifically, 39,178 differentially expressed genes (DEGs) werefound after analysis of GS and DM or NO for 24 h. After pairwisecomparison of GS/DM, NO/GS, and NO/DM, 883, 2286, and1815 genes, respectively, were found differentially expressed atmore than 1 log2 fold change (base-mean 5, FDR 0.05).Among those, the 50 most significant DEGs of each pair (GS/NO,GS/DM, NO/DM), based on the multiple testing adjusted p-value4NATURE COMMUNICATIONS (2018)9:1281criteria, were selected resulting in 123 different genes (Supplementary Table 2). DESeq normalized counts of the selectedsequences were averaged per condition and depicted as a heatmapusing a hierarchical clustering generated by Pearson correlation ofthe z-score (Fig. 1a). The result revealed that NO treatmentinduced important changes in mESC transcriptome. Further, theoverlapping extent of DEGs among the experimental conditionswas utilized to identify condition-specific regulated genes, and aVenn diagram was created to group RNAs into up- anddownregulated transcripts (Fig. 1b), We identified 982 transcriptsupregulated in NO compared to GS and 23 downregulated.The comparison of NO/DM alone identified 24 upregulatedtranscripts and 737 downregulated (Fig. 1b). To assign a role toNO-modulated transcripts, gene-ontology (GO) analysis wasperformed on significantly up- or downregulated RNAs. Theinterconnections among the upregulated transcripts indicatedthat these genes belonged to biological processes associated with DOI: 10.1038/s41467-018-03668-0 www.nature.com/naturecommunications
ARTICLENATURE COMMUNICATIONS DOI: 10.1038/s41467-018-03668-0mesendodermal lineage. Specifically, blood vessel morphogenesis(GO-ID:48514), muscle tissue development (GO-ID:61061), andheart development (GO-ID:7507). In the same condition, themost downregulated genes were enriched in RNAs associatedwith neuroectodermal development, such as axonogenesis (GOID:50770), central nervous system maturation (GO-ID:21626),and hindbrain maturation (GO-ID:21578) (Fig. 1c). Altogether,these results implicate DETA/NO as a molecular inducer ofmesendodermal differentiation. Intriguingly, bioinformatics analysis of NO/DM comparison further reinforced the indicationthat NO promotes mesendodermal commitment also byZeb1 enrichment on mesendodermal gene chromatin. Previousstudies indicate Zeb1 and Zeb2 as targets of miR-200s20,33 andZeb2 negatively regulated by NO28. Remarkably, although Zeb1has been implicated in self-renewal maintenance of cancer cells22little information is available about its role in GS or in NOenriched medium. Hence, specific experiments were performed toassess the NO effect on Zeb1 in our system. Zeb1 protein levelswere significantly reduced by DETA/NO in mESC released eitherb50*Relative fold enrichment (Zeb1 ab - lgG)45403025**50Arbitrary unitIP: Hdac2 WB: SNO50 kDaDII1Mesp2GOMIgG550 kDa4350 kDaIP: Zeb1 WB: Hdac2IP: Hdac2 WB: Zeb1Input Hdac2Input Zeb1250 kDa1Input Hdac2Tbx4NSGIgONMD*650 kDaWnt7bd7SWnt3DcG0DM DM DM DM DMDM NO NODM3 h 3 h 3 h 3 h 24 h 24 h2h2h1h PTIO PTIO PTIO ODQ L-NAME PTIOSDM1hGDM30 m5MGS10G1015O1520Ig20DM PTIODMNArbitrary unit3525Darepression of neurogenesis and epithelial differentiation (Supplementary Fig. 2).0GSNO274ADM160 kDafppS l ZH ebda 1c2 wtplpS ZH ebd 1IgG ac2 C*IP: Zeb1 WB: Hdac2160 kDaInput Zeb1Arbitrary unit50 kDa50 kDa2.01.5160 kDa260 kDaiNOS1.0α-tub0.550 kDaEv6420*8*64*20eNOSnNOSiNOSLCv2 NTCGSDMNO*LCv2 Hdac2 1/ 225*20151050eNOSNATURE COMMUNICATIONS (2018)9:1281130LCv2 Zeb1 1/ 2mRNA fold increase8DMi10mRNA fold increaseNO2LCv2 NTCDM10GSeNOSh123Zeb1 Zeb1Hdac2wt Hdac2C262A/C274AGS14400.0g*M125 kDanNOSInput Hdac2Relative fold enrichment(Zeb1 ab - lgG)eNOSmRNA fold increase2.5DS5GEv262A/Ce*GSDMNOeNOS DOI: 10.1038/s41467-018-03668-0 www.nature.com/naturecommunications5
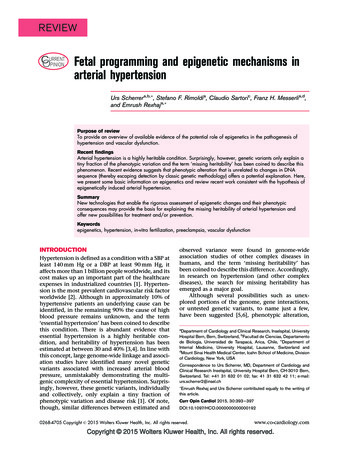
ARTICLENATURE COMMUNICATIONS DOI: 10.1038/s41467-018-03668-0from SM or GS (Supplementary Fig. 3a). Confocal microscopyshowed that Zeb1 is principally nuclear in mESC cultured in GSor DM (Supplementary Fig. 3b). Instead, in the presence of NO,Zeb1 partially relocated out of the nucleus (Supplementary Fig. 3band insets therein). This evidence was confirmed by subcellularfractionation experiments showing enrichment of Zeb1 in thecytoplasm of DETA/NO-treated mESC (Supplementary Fig. 3c).To establish whether the NO-mediated Zeb1 down-modulationwas regulated by induction of miR-200 family, we analyzed Zeb1protein levels in mESC transfected with scramble or anti-miR200b oligonucleotides. Western blot analysis showed that theinhibition of miR-200b, the most NO-sensitive miR-200 familymember, rescued Zeb1 levels both in DM and in NO conditions(Supplementary Fig. 3d). Moreover, ChIP experiments revealed afeedback loop regulation between Zeb1 and miR-200 family inmESC (Supplementary Fig. 3e). Specifically, we observed anenrichment of Zeb1 binding on miR-200 family cluster 1 promoter in mESC kept in GS, suggesting active repression of themiR-200 family in self-renewal condition.To investigate whether Zeb1 is involved in the regulation ofmESC response to NO and in mesendodermal gene expressioncontrol, ChIP-sequencing (ChIP-seq) was performed in GS. Atotal of 17435 Zeb1-associated peaks, present in at least two out ofthree replicates, was considered. ChIP-seq reads were enriched onchromosomes (Chr.) 4, 5, 7, 8, 11, 15, 17 and 19 compared to theInput (Fig. 1d). Considering the genomic features, Zeb1 peaksoccurred particularly at 5 UTR, along promoters and in codingregions (Fig. 1e). However, the majority of these peaks, about11225, clustered around the transcription start site (TSS 5 kb) of10199 genes (Fig. 1f). Of note, about 54% of Zeb1 peaks containedthe canonical human Zeb1 motif [CT]N[CT]ACCTG as registered in the JASPAR database [http://jaspar.genereg.net/],suggesting an important role for Zeb1 in the transcription generegulation in naive mESC. To identify putative Zeb1 targetsregulated by NO, an integrated RNA-seq/ChIP-seq dataset wasgenerated (Fig. 2a). Specifically, we combined the 1025 NOdependent genes identified by RNA-Seq analysis with the 10199genes enriched for Zeb1 TSS binding as indicated by ChIP-seq.About 442 transcribed regions were identified (Fig. 2a, left) inwhich genes with a role in mesendodermal differentiation wereoverrepresented according to the GO analysis (Fig. 2a, right;Fig. 1b, c). This analysis identified five transcripts, Mesp236,37,Wnt338, Wnt7b38, Tbx439, and Dll140, among those mostrepresented and associated with a mesendodermal differentiationprogram (Fig. 2a, right graph, and inset therein). As quantitatively visualized, by the Sashimi plot analysis (Fig. 2b) atchromatin level, each selected gene showed a relative enrichmentin Zeb1 peaks in GS (blue peaks) compared to their input (darkgreen peaks, GS), as well as a significant increase of RNA peaks inNO (red peaks) compared to GS alone (light green peaks). Theseresults suggest that: (i) NO activates a transcriptional programalong the mesendodermal differentiation pathway; (ii) Zeb1binding is enriched in the regulatory regions of mesendodermalassociated genes possibly contributing to their repression. Theexpression of the most represented NO-Zeb1-dependent geneswas validated by qRT-PCR. DM condition determined asignificant increase in the specific mRNA level of themesendodermal-associated genes (gray bars). Notably, DETA/NO enhanced their expression (white bars) (SupplementaryFig. 4a). The presence of the NO scavenger 2-Phenyl-4,4,5,5tetramethylimidazoline-1-oxyl 3-oxide (PTIO)41 abolished themesendodermal marker induction observed in DM conditionsuggesting an endogenous production of NO after release fromself-renewal (Supplementary Fig. 4b). Gene-specific ChIP experiments were performed in the same condition. The Zeb1enrichment was validated on the selected gene promoters inmESC kept in GS (black bars) (Supplementary Fig. 4c). Instead, inDM condition, DNA-bound Zeb1 became undetectable (graybars), an effect independent from the presence of the NO donor(white bars).Hdac1 and Hdac2 are known to associate with Zeb1 forming atranscription repression complex23. We wanted to investigatewhether these members of the Hdac class I family were alsoassociated with the promoter regions of the selected Zeb1 targetgenes. In this context, Hdac1 and Hdac2 showed a similar patternof enrichment and both detached upon transferring mESC in DMor NO medium (Supplementary Fig. 4d, e). These results suggestthat Zeb1 and Hdac1/2, other components of the Zeb1 repressorcomplex, are co-regulated during early differentiation of mESC.Further experiments were performed with LNA oligos designedagainst miR-200b. The results showed a significant reduction ofmesodermal markers expression in the presence of NO suggestingthat Zeb1 targeting is important for the effect of NO(Supplementary Fig. 4f).Endogenous NO synthesis occurs early during differentiation.After release from pluripotency, endogenous NO productionoccurred spontaneously during a time course from 1 to 24 h afterchanging medium (Supplementary Fig. 5a, left panel). However,in NO the number of DAF-positive cells was significantly higher.Interestingly, the normalized DAF fluorescence intensity wassimilar in both conditions (Supplementary Fig. 5a, right panel)suggesting that the amount of DETA/NO used determined aFig. 3 Endogenous NO synthesis and Zeb1-Hdac2 complex formation. a cGMP quantification in GS (black bar), in DM PTIO, ODQ, L-NAME (gray bars)for 1, 2, or 3 h and in NO PTIO (white bars) for 24 h. (n 3; *p 0.05 DM vs. GS; p 0.05 treatments vs. DM). b Zeb1-chromatin binding analysis on:Wnt3, Wnt7b, Tbx4, Dll1, and Mesp2. Chromatins extracted in DM (gray bars) or DM PTIO (striped bars). Data compared to IgG value (striped bars)after Input normalization (n 3). c Left panel: representative immunoprecipitation (IP)/western blotting (WB) analysis of Hdac2 S-nitrosylation in GS (24h), DM or NO (2 h). Right panel: densitometry (n 3; *p 0.05 NO vs. DM). Full-length blot provided in Supplementary Fig. 9a. d Reciprocal co-IP analysisshowing Zeb1:Hdac2 (left) and Hdac2:Zeb1 (right) complex formation in GS, DM or NO (24 h; n 3 each group). Full-length blot provided inSupplementary Fig. 9b and c. e Left panel: representative co-IP analysis showing Zeb1:Hdac2wt and Zeb1:Hdac2C262A/C274A complex formation comparedto empty vector (Ev)-transfected HeLa cells. HeLa transfected with Ev or co-transfected with pCMV6 Zeb1/pCIG2 Hdac2wt or pCMV6 Zeb1/pCIG2 Hdac2C262A/C274A. Right panel: densitometry (n 3; *p 0.05 Zeb1:Hdac2wt vs. Ev; p 0.05 Zeb1:Hdac2C262A/C274A vs. Zeb1:Hdac2wt). Fulllength blot provided in Supplementary Fig. 9d. f Left panel: representative WB analysis of eNOS, nNOS, and iNOS in GS or DM (n 3). Loading control: αtubulin. Full-length blot provided in Supplementary Fig. 9e. Right panel: eNOS, nNOS, and iNOS mRNA analysis in GS (black bars) or DM (gray bars). Dataexpressed as fold increase of GS after subtraction of the housekeeping gene p0 signal (n 3; *p 0.05 DM vs. GS). g Zeb1-chromatin binding analysis oneNOS promoter in GS (black), DM (gray), and NO (white). Data represented as fold increase of GS after input normalization (n 3). h, i eNOS mRNAexpression analysis in GS, DM, and NO prior (control vector LCv2 NTC; black bar) and after CRISPR/Cas9 inactivation of Zeb1 (h; LCv2 Zeb1 1/ 2; graybars) or CRISPR/Cas9 inactivation of Hdac2 (i; LCv2 Hdac2 1/ 2; white bar). Data represented as fold increase compared to control after subtraction ofthe housekeeping gene p0 signal (n 3; *p 0.05 LCv2 Zeb1 1/ 2 or LCv2 Hdac2 1/ 2 vs. LCv2 NTC). Data represented as mean s.e.m. and analyzedby Kolmogorov–Smirnov test6NATURE COMMUNICATIONS (2018)9:1281 DOI: 10.1038/s41467-018-03668-0 www.nature.com/naturecommunications
ARTICLENATURE COMMUNICATIONS DOI: 10.1038/s41467-018-03668-0release of NO comparable to that occurring spontaneously inuntreated cells. To investigate whether the endogenous NO wassufficient to elicit biologically relevant effects, we determinedcGMP production during a time course from 1 to 3 h fromrelease. The cGMP production was assessed in GS or DM and inthe presence or absence of PTIO, the guanylate cyclase inhibitorODQ42, the pan-NO inhibitor L-NAME43, or DETA/NO(Fig. 3a). The results indicate a positive cGMP productiondetectable as early as 2 h after release from GS. This effect is theconsequence of rapid endogenous NO synthesis as suggested bythe ability of PTIO to abrogate cGMP production at all timepoints tested and in the presence of DETA/NO. Similarly, ODQand L-NAME both prevented cGMP synthesis (Fig. 3a).Consistently, the results of gene-specific ChIP experimentsshowed that Zeb1 detachment was reduced or abrogated byPTIO, associating the endogenous NO production (Fig. 3a) toregulation of the Zeb1/chromatin interaction (Fig. 3b) and activation of a lineage-specific gene expression. Interestingly, in NOHdac2 was nitrosylated (Fig. 3c) and its association with Zeb1was significantly decreased (Fig. 3d) suggesting that in this condition the Zeb1:Hdac2 complex formation was destabilized. Toexplore this aspect, a series of co-immunoprecipitations wereperformed by using an Hdac2 mutant13 in which the nitrosylatable Cysteines at
Zeb1-Hdac2-eNOS circuitry identifies early cardiovascular precursors in naive mouse . Institute of Cell Biology and Neurobiology (IBCN), Via del Fosso di Fiorano 64, 00143 Rome, Italy. 3Institute of Medical Pathology, Università Cattolica di Roma, Largo Francesco . Promoter Coding exon Intron Distal intergenic Downstream 5′UTR 3′UTR .