Transcription
UpcomingConferencesURISA’s 46th Annual Conference &Expositionw w w. u r i s a . o r gOctober 7–10, 2008 — New Orleans, LAURISA Leadership AcademyDecember 8–12, 2008 — Seattle, WA13th Annual GIS/CAMA TechnologiesConferenceFebruary 8–11, 2009 — Charleston, SCURISA’s Second GIS in Public HealthConferenceJune 5–8, 2009 — Providence, RIURISA/NENA Addressing ConferenceTBDURISA’s 47th Annual Conference &ExpositionSeptember 29–October 2, 2009 — Anaheim, CAGIS in Transit ConferenceNovember 11–13, 2009 — St Petersburg, FL
Volume 20 No. 1 2008Journal of the Urban and Regional Information Systems AssociationContentsRefereed5Automatic Generation of High-Quality Three-Dimensional Urban Buildingsfrom Aerial ImagesAhmed F. Elaksher and James S. Bethel15Robust Principal Component Analysis and Geographically Weighted Regression:Urbanization in the Twin Cities Metropolitan Area of MinnesotaDebarchana Ghosh and Steven M. Manson27Where Are They? A Spatial Inquiry of Sex Offenders in Brazos CountyPraveen Maghelal, Miriam Olivares, Douglas Wunneburger, and Gustavo Roman35Tools And Methods For A Transportation Household SurveyMartin Trépanier, Robert Chapleau, and Catherine Morency45Mapping Land-Use/Land-Cover Change in the Olomouc Region, CzechRepublicTomáš VáclavíkPlus53Mapping the Future Success of Public Education
JournalPublisher:Urban and Regional Information Systems AssociationEditor-in-Chief:Jochen AlbrechtJournal Coordinator:Scott A. GramsElectronic Journal:http://www.urisa.org/journal.htmEDITORIAL OFFICE: Urban and Regional Information Systems Association, 1460 Renaissance Drive, Suite 305, Park Ridge, Illinois 60068-1348;Voice (847) 824-6300; Fax (847) 824-6363; E-mail info@urisa.org.SUBMISSIONS: This publication accepts from authors an exclusive right of first publication to their article plus an accompanying grant of nonexclusive full rights. The publisher requires that full credit for first publication in the URISA Journal is provided in any subsequent electronic orprint publications. For more information, the “Manuscript Submission Guidelines for Refereed Articles” is available on our website, www.urisa.org, or by calling (847) 824-6300.SUBSCRIPTION AND ADVERTISING: All correspondence about advertising, subscriptions, and URISA memberships should be directed to:Urban and Regional Information Systems Association, 1460 Renaissance Dr., Suite 305, Park Ridge, Illinois, 60068-1348; Voice (847) 824-6300;Fax (847) 824-6363; E-mail info@urisa.org.URISA Journal is published two times a year by the Urban and Regional Information Systems Association. 2008 by the Urban and Regional Information Systems Association. Authorization to photocopy items for internal or personal use, or the internalor personal use of specific clients, is granted by permission of the Urban and Regional Information Systems Association.Educational programs planned and presented by URISA provide attendees with relevant and rewarding continuing education experience. However,neither the content (whether written or oral) of any course, seminar, or other presentation, nor the use of a specific product in conjunction therewith, nor the exhibition of any materials by any party coincident with the educational event, should be construed as indicating endorsement orapproval of the views presented, the products used, or the materials exhibited by URISA, or by its committees, Special Interest Groups, Chapters,or other commissions.SUBSCRIPTION RATE: One year: 295 business, libraries, government agencies, and public institutions. Individuals interested in subscriptionsshould contact URISA for membership information.US ISSN 1045-80772URISA Journal Vol. 20, No. 1 2008
Editors and Review BoardURISA Journal EditorArticle Review BoardEditor-in-ChiefPeggy Agouris, Department of Spatial InformationScience and Engineering, University of MaineJochen Albrecht, Department ofGeography, Hunter College City Universityof New YorkThematic EditorsEditor-Urban and Regional InformationScienceVacantEditor-Applications ResearchLyna Wiggins, Department of Planning,Rutgers UniversityEditor-Social, Organizational, Legal,and Economic SciencesIan Masser, Department of Urban Planningand Management, ITC (Netherlands)Editor-Geographic Information ScienceMark Harrower, Department of Geography,University of Wisconsin MadisonEditor-Information and Media SciencesMichael Shiffer, Department of Planning,Massachusetts Institute of TechnologyEditor-Spatial Data Acquisition andIntegrationGary Hunter, Department of Geomatics,University of Melbourne (Australia)Editor-Geography, Cartography, andCognitive ScienceVacantEditor-EducationKaren Kemp, Director, International MastersProgram in GIS, University of RedlandsSection EditorsSoftware Review EditorJay Lee, Department of Geography, Kent StateUniversityBook Review EditorDavid Tulloch, Department of LandscapeArchitecture, Rutgers UniversityURISA Journal Vol. 20, No. 1 2008Grenville Barnes, Geomatics Program, Universityof FloridaMichael Batty, Centre for Advanced Spatial Analysis,University College London (United Kingdom)Kate Beard, Department of SpatialInformation Science and Engineering,University of MaineYvan Bédard, Centre for Research in Geomatics,Laval University (Canada)Barbara P. Buttenfield, Department ofGeography, University of ColoradoKeith C. Clarke, Department of Geography,University of California-Santa BarbaraKingsley E. Haynes, Public Policy andGeography, George Mason UniversityEric J. Heikkila, School of Policy, Planning, andDevelopment, University of Southern CaliforniaStephen C. Hirtle, Department of InformationScience and Telecommunications, University ofPittsburghGary Jeffress, Department of GeographicalInformation Science, Texas A&M UniversityCorpus ChristiRichard E. Klosterman, Department ofGeography and Planning, University of AkronRobert Laurini, Claude Bernard University ofLyon (France)Thomas M. Lillesand, EnvironmentalRemote Sensing Center, University of WisconsinMadisonPaul Longley, Centre for Advanced Spatial Analysis,University College, London (United Kingdom)David Coleman, Department of Geodesy andGeomatics Engineering, University of NewBrunswick (Canada)Xavier R. Lopez, Oracle CorporationDavid J. Cowen, Department of Geography,University of South CarolinaHarvey J. Miller, Department of Geography,University of UtahDavid Maguire, Environmental Systems ResearchInstituteMassimo Craglia, Department of Town &Regional Planning, University of Sheffield(United Kingdom)Zorica Nedovic-Budic, Department of Urbanand Regional Planning,University of IllinoisChampaign/UrbanaWilliam J. Craig, Center for Urban andRegional Affairs, University of MinnesotaAtsuyuki Okabe, Department of UrbanEngineering, University of Tokyo (Japan)Robert G. Cromley, Department of Geography,University of ConnecticutHarlan Onsrud, Spatial Information Scienceand Engineering, University of MaineKenneth J. Dueker, Urban Studies andPlanning, Portland State UniversityJeffrey K. Pinto, School of Business, Penn State ErieGeoffrey Dutton, Spatial EffectsGerard Rushton, Department of Geography,University of IowaMax J. Egenhofer, Department of Spatial InformationScience and Engineering, University of MaineJie Shan, School of Civil Engineering,Purdue UniversityManfred Ehlers, Research Center forGeoinformatics and Remote Sensing, University ofOsnabrueck (Germany)Bruce D. Spear, Federal Highway AdministrationManfred M. Fischer, Economics, Geography &Geoinformatics, Vienna University of Economicsand Business Administration (Austria)Myke Gluck, Department of Math andComputer Science, Virginia Military InstituteMichael Goodchild, Department of Geography,University of California-Santa BarbaraJonathan Sperling, Policy Development &Research, U.S. Department of Housing andUrban DevelopmentDavid J. Unwin, School of Geography, BirkbeckCollege, London (United Kingdom)Stephen J. Ventura, Department ofEnvironmental Studies and Soil Science,University of Wisconsin-MadisonNancy von Meyer, Fairview IndustriesMichael Gould, Department of InformationSystems Universitat Jaume I (Spain)Barry Wellar, Department of Geography,University of Ottawa (Canada)Daniel A. Griffith, Department of Geography,Syracuse UniversityMichael F. Worboys, Department of ComputerScience, Keele University (United Kingdom)Francis J. Harvey, Department of Geography,University of MinnesotaF. Benjamin Zhan, Department of Geography,Texas State University-San Marcos3
Automatic Generation of High-Quality Three-DimensionalUrban Buildings from Aerial ImagesAhmed F. Elaksher and James S. BethelAbstract: High-quality three-dimensional building databases are essential inputs for urban area geographic information systems.Because manual generation of these databases is extremely costly and time-consuming, the development of automated algorithmsis greatly needed. This article presents a new algorithm to automatically extract accurate and reliable three-dimensional building information. High overlapping aerial images are used as input to the algorithm. Radiometric and geometric properties ofbuildings are utilized to distinguish building roof regions in the images. This is accomplished with image segmentation andneural network techniques. A rule-based system is employed to extract the vertices of the roof polygons in all images. Photogrammetric mathematical models are used to generate the roof topology and compute the three-dimensional coordinates of the roofvertices. The algorithm is tested on 30 buildings in a complex urban scene. Results showed that 95 percent of the building roofsare extracted correctly. The root-mean-square error for the extracted building vertices is 0.35 meter using 1:4000 scale aerialphotographs scanned at 30 microns.IntroductionThree-dimension building information is required for a varietyof applications, such as urban planning, mobile communication,visual simulation, visualization, and cartography. Automaticgeneration of this information is one of the most challengingproblems in photogrammetry, image understanding, computervision, and GIS communities. Current automated algorithmshave shown some progress in this area. However, some deficiencies still remain in these algorithms. This is particularly apparentin comparison to manual extraction techniques, which, althoughslow, are essentially perfect in accuracy and completeness.Recent research covers extracting building information fromhigh-resolution satellite imageries, high-quality digital elevationmodels (DEMs), and aerial images. For example, QuickBird andIKONOS high-resolution satellite imageries are used to acquireplanemetric building information with one-meter horizontal accuracy (Theng 2006, Lee et al. 2003). However, aerial images arethe primary source used to acquire accurate and reliable geospatialinformation. Lin and Nevatia (1998) proposed an algorithm toextract building wireframes from a single image. However, asingle image does not provide any depth information. A pair ofstereo images could also be used to extract building information(Avrahami et al. 2004, Chein and Hsu 2000). Using one pairof images is insufficient to extract the entire building because ofhidden features that are not projected into the image pair.Kim et al. (2001) presented a model-based approach togenerate buildings from multiple images. Three-dimensionalrooftop hypotheses are generated using three-dimensional roofboundaries and corners extracted from multiple images. The generated hypotheses then are employed to extract buildings using anexpandable Bayesian network. Wang and Tseng (2004) proposeda semiautomatic approach to extract buildings from multipleviews. They proposed an abstract floating model to represent realURISA Journal Elaksher, Bethelobjects. Each model has several pose and shape parameters. Theparameters are estimated by fitting the model to the images usingleast-squares adjustment. The algorithm is limited to parametricmodels only. In Shmid and Zisserman (2000), lines are extractedin the images and matched over multiple views in a pair-wisemode. Each line then is assigned two planes, one plane on eachside. The planes are rotated, and the best-fitting plane is found.Planes then are intersected to find the intersection lines.Henricsson et al. (1996) presented another system to extractsuburban roofs from aerial images by combining two-dimensionaledge information together with photometric and chromaticattributes. Edges are extracted in the images and aggregated toform coherent contour line segments. Photometric and chromaticcontour attributes for adjacent regions around each contour areassigned to it. For each contour, attributes are computed-basedon the luminance, color, proximity, and orientation, and savedfor the next step. Contour segments then are matched using theirattributes. Segments in three dimension are grouped and mergedaccording to an initial set of plane hypotheses.Fischer et al. (1997) extracted three-dimensional buildingsfrom aerial images using a generic modeling approach that dependson combining building parts. The process starts by extractinglow-level image features: points, lines, regions, and their mutualrelations. These features are used to generate three-dimensinalbuilding part hypotheses in a bottom-up process. A step-wisemodel-driven aggregation process combines the three-dimensionalbuilding feature aggregates to three-dimensional parameterizedbuilding parts and then to a more complex building descriptor.The resulting complex three-dimensional building hypothesisthen is back-projected to the images to allow component-basedhypothesis verification.A semiautomated approach is used in Förstner (1999) tosolve the building-extraction problem. First, the user has to definethe building model and find the building elements in one image5
by a number of mouse clicks. Then the algorithm finds the corresponding features in other images and matches them to buildthe three-dimensional wireframe of the building. This approachsupports the extraction of more complex buildings; however, itrequires the user to spend a great amount of time interactingwith the system. Rottensteiner (2000) presented a semiautomatedbuilding-extraction technique in which the user can select anappropriate building primitive from a database and then adjustthe parameters of the primitive to the actual data by interactivelymeasuring points in the digital images, and determine the finalbuilding parameters by automated matching tools.High-quality DEMs such as those available from lightdetection and ranging (LIDAR) have been used to generatethree-dimensional building models. Tse et al. (2006) proposed analgorithm based on segmenting the raw data into high and lowregions, and then modeling the walls and roofs by extruding thetriangulated terrain surface (TIN) using CAD-type Euler operators. Tarsha-Kurdi et al. (2006) proposed another algorithm thatdiscriminates terrain and off-terrain clouds in a LIDAR pointcloud. Then it categorizes the off-terrain points to building andvegetation subclasses. Building points then are detected via segmenting the original LIDAR three-dimensional point cloud. InBrunn and Weidner (1997), the digital surface models (DSMs)are extracted using mathematical morphology. The differencesbetween the DEMs and the DSMs are computed and buildingpoints are detected by thresholding these differences. In the nextstep, building wireframes are generated using parametric andprismatic models depending on the complexity of the detectedbuilding. Morgan and Habib (2002) proposed another algorithmfor building detection that has the following steps: segmentation of laser points, classification of laser segments, generationof building hypothesis, verification of building hypothesis, andextraction of building parameters.Several researchers worked on integrating LIDAR andaerial images for building extraction. The approach presentedin Hongjian and Shiqiang (2006) is based on aerial images andsparse laser scanning sample points. Linear features are extractedin the aerial images first. Bidirection projection histogram andline matching then are used to extract the contours of buildings.The height of the building is determined from sparse laser samplepoints that are within the contours of the buildings extractedfrom the images.The presented systems display many deficiencies. Satelliteimageries still do not provide high-quality elevation data. Severalsystems require human interaction. Using a parametric modelto represent buildings limits some systems to specific buildingmodels. Another problem is the excessive reliance on primitivefeatures such as corner points or line segments. Naive matchingof such primitive features yields numerous false matches, andmisses many correct ones. Systems using more than a pair of images perform the feature matching in a pair-wise mode. Systemsutilizing only DEM in building extraction start by segmenting theDEMs. This process is problematic because of outliers and spikes.In addition, such DEMs are expensive to collect and insufficient6to provide surface texture.In this article, a new algorithm to extract building wireframes using more than two images is presented. The algorithmhas the capability to extract a wide range of buildings with different shapes, orientations, and heights. The human operatorneeds only to select an image patch for the building in the firstimage, specify the location of the input data files, and set up thethresholds. The algorithm will then find corresponding patchesin other images, using the input data, and start the extractionprocess. The algorithm is implemented using computer visiontechniques, artificial intelligence algorithms, and rigorous photogrammetric mathematical models. Computer vision techniquesare employed to extract image regions using a modified versionof the split-and-merge image segmentation technique. Artificialintelligent algorithms are used to discriminate roof regions and toconvert the image regions to two-dimensional polygons. Photogrammetric mathematical models are employed to simultaneouslyand rigorously match image polygons and vertices across all views.One of the powerful tools that photogrammetry provides is tosimultaneously match features across multiple images. Inputsare four images for the building. The algorithm has been testedon a large sample of buildings selected quasi-randomly from thePurdue University campus. Four images are used for each building and the automatically extracted wireframes of the extractedbuildings are presented. Results show significant improvement inthe detection rate and accuracy and suggest the completeness andaccuracy of the proposed algorithm. The remainder of this paperis organized as follows. First, the process of extracting buildingpolygons in aerial images is presented. Then the generation ofthree-dimensional building models is proposed. Results are givenin the next section, followed by discussions and conclusions.Extracting BuildingPolygons in Aerial ImagesImage Region ExtractionSeveral researchers worked on segmenting aerial and satellite images in urban environments. Muller and Zaum (2005) proposedan algorithm to detect and classify buildings from a single aerialimage using a region-growing algorithm. Lari and Ebadi (2007)proposed another segmentation algorithm to detect building regions in satellite images. The results, although applied to a singleimage, showed the significance of implementing segmentationstrategies to detect buildings in aerial and satellite images. In thisresearch, a modified split-and-merge image segmentation process,Horowitz and Pavlidis (1974) and Samet (1982), is applied tosegment the aerial images. This technique obtains good results if ahigh contrast exists between the foreground and the backgroundobjects and if the segmented objects are internally homogenous.For urban aerial images this is not always the case. Objects suchas roads, cars, trees, and buildings are common to a typical urbanaerial image. Although this wide variety of objects is expected tobe seen in aerial images, building roofs have an important attriURISA Journal Vol. 20, No. 1 2008
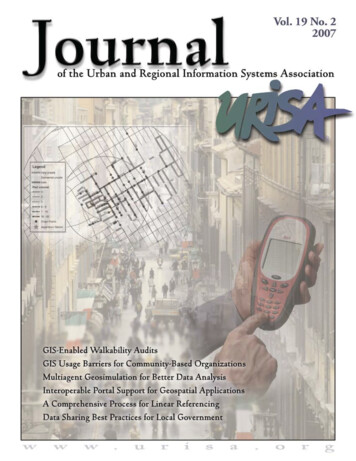
bute that distinguishes them from other spatial features. Buildingroofs often are homogenous objects that can be segmented fromother image features. Homogeneity is a scale-dependent attribute,but for small-scale images (1:4000), roof regions often appearhomogeneous. However, utility pipelines and ducts can disturbthe building roof homogeneity. Texture is another problem thatcan decrease the ability to segment building roofs. To account forthese problems, several modifications are proposed to the originalsplit-and-merge algorithm. The algorithm presented differs fromthe conventional split-and-merge algorithm in its capability tojoin neighboring regions based on their intensity and size differences and in its potential for detecting and filling region gaps.The segmentation process is implemented as follows. Theimage first is divided into smaller regions until a homogeneitycondition is satisfied. This is implemented by constructing aquadtree of the image, progressing down the tree, splitting asnecessary when inhomogeneities exist. Then a merging algorithmis implemented. The merging is carried out in two steps. Adjacentregions are first merged based on the differences between the minimum and maximum intensities. Large regions then are mergedwith their small neighbors if the differences in their intensities aresmaller than a given threshold. Intensity thresholds for splittingand merging range between 10 and 15, while the size thresholdis kept fixed relative to the image size.One of the problems noticed after segmenting the image isthe presence of holes inside the segmented regions. This can occur because of texture and/or utility features. Holes are detectedand removed as follows. First for each region its pixels are locatedand copied to a template image with a background intensity of(a)(b)(c)Figure 1. Split-and-merge segmentation results for the image of onebuilding: (a) original image, (b) image after splitting, (c) final regionszero. A region-growing algorithm then is used to connect allthe pixels that do not belong to either the background or theregion. These pixels are described as holes and are attached tothe original region. Another problem also observed in the resultsis the splitting of some roof patches into two or more regions.To overcome this problem, an average intensity is computed foreach region and any two neighboring regions are merged if thedifference between their average intensities is smaller than a giventhreshold, regardless of their sizes. Small regions, very dark regions,and very bright regions are eliminated. Thresholds for the regionmerging and elimination are kept fixed relative, at this stage, tothe intensity range of the images and the image size. The resultsof the segmentation process for one sample building are shownin Figure 1. Figure 2 shows the results of segmenting the imagesof five other buildings.Region ClassificationBuildings usually are elevated blobs in the DEMs. On the otherhand, building regions possess linear borders. Other featuressuch as trees also are elevated; however, they do not have linearborders. Roads and sidewalks have linear borders, but are notelevated. Therefore, in this research the high elevation and borderlinearity attributes are used to discriminate building roof regionsfrom other regions using a neural network. Each image region isassigned two attributes for the discrimination process. The firstattribute measures the linearity of the region boundaries, whilethe second attribute measures the percentage of the points in theregion that are above a certain height.Border linearity is measured using a modified version ofHough transformation (Hough 1962). First, border points areextracted and sorted so they traverse the border clockwise. Foreach border point, the previous five points and the next five pointsare found to form a local line at each point. The adjusted lineparameters (αa, Pa) and the quadratic form of the residuals forthe local line at each point are computed using the least-squaresestimation technique. The algorithm is implemented in three runsat each point; the first run is when the point is in the middle of theline; in the second run, the local line is shifted so that the pointis at the end. In the third run, the local line is shifted so that thespecified point is the first point. If the minimum quadratic formvalue is small, the parameter space cell at the location of the localline parameters, i.e., αa, Pa, is increased by one. The parameter(a)(b)Figure 2. Split-and-merge segmentation results for the images of five buildings: (a) original images, (b) final regionsURISA Journal Elaksher, Bethel7
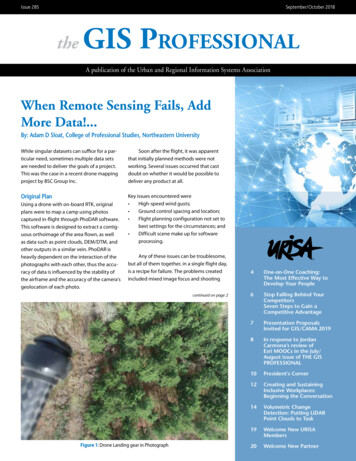
(a)(b)Figure 3. The parameter space for a roof region (a) and a nonroof region (b)(a)(b)Figure 4. DEM (a) and DSM (b) for an area with several buildings, same vertical scalespace then is searched and analyzed to determine a measure forborder linearity. Border linearity is measured as the percentage ofthe number of points in the larger four cells to the total number ofborder points. Figure 3 shows a parameter space for a roof regionand another parameter space for a nonroof region.A digital elevation model (DEM) is used to quantify theheight of each region. First, the digital surface model (DSM),i.e., representing bare ground, is extracted. Minimum filters areused to perform this task (Masaharu and Ohtsubo 2002, Wackand Wimmer 2002). The filtering process detects and consequently removes points above the ground surface to recognizehigh points in the data set. The minimum filter size should belarge enough to include data points that are not noise. However,iterative approaches could be used to avoid the effect of noise.In this research, the size of the filter is 9x9 pixels. The filtering is8repeated iteratively until the DSM is extracted. The differencesbetween the DEM and the DSM then are computed and used torepresent height information. The use of the height informationin preference to the elevations makes the algorithm applicable forboth flat and slope terrains. Figure 4 shows the DEM and DSMof an area with several buildings.Each point in the image then is assigned a height value byprojecting the differences between the DEM and the DSM backto the image using the image registration information, the pixellocation in the image, and the DEM elevation. For each imagepoint a ray is generated, starting from the exposure station of thecamera and directed toward the point. The intersection betweenthe ray and the DEM defines the location of the correspondingDEM post. The height information at this location then is usedas the height of the corresponding image point. The region heightURISA Journal Vol. 20, No. 1 2008
measure is defined as the percentage of the number of points inthe region that are above a certain height to the total number ofpoints in the same region.The neural network implemented in this research is a feedforward back-propagation network (see Figure 5). The networkconsists of three layers: an input layer, one hidden layer, and anoutput layer. The number of neurons in the first layer is two.The number of neurons in the second layer is selected to be ten.The number of neurons in the third, i.e., last, layer is one. Theoutput of this neuron is either one in case the region is a roofregion or zero in case the region is not a roof region. The activation function for all neurons in the first and second layers is thesigmoid functions (Principe et al. 1999). For the output neuron,the step function is chosen as the activation function. To study theperformance of the neural network, a variety of training data setsare used with different sizes: 20, 50, 100, 200, and 400 samples,including 2, 5, 10, 20, and 40 roof samples, respectively, whilethe other samples are nonroof samples. The average detectionrate and false alarm rate for each training data set is recorded andshown in Figure 6. Results show that increasing the size of thetraining data set does not affect the detection rate significantly.However, increasing the size of the training data set does have asignificant effect on the false alarm rate.Image Polygon ExtractionThe two-dimensional modified Hough space is utilized in extracting the borderlines for the roof regions. Given all points contributing to a certain cell, a nonlinear least-squares estimation modelis used to adjust the line parameters of that cell. Lines then aregrouped recursively until no more lines with similar parametersare left and short lines are rejected. The next step is to convert theextracted lines to polygons via a rule-based system. The rules aredesigned as complex as possible to cover a wide range of polygons.The mechanism works in three steps. The first step is to find allthe possible intersections between the borderlines. However, iftwo lines are almost parallel, i.e., intersecting angle out of therange (30o—150o), the intersection point is not considered. Thenext step is to generate a number of polygons from all recordedintersections. Each combination of three and four intersectionpoints is considered a polygon hypothesis. Hypotheses are ignoredif the difference in area between the region and the hypothesizedpolygon is large. The best polygon that represents the region ischosen from the remaining hypotheses using a template-matchingprocess. The template is chosen to be the region itself, while it ismatched across all polygon hypotheses. The hypothesis with thelargest correlation and minimum number of vertices is chosen tobe the best-fitting polygon. The extracted polygons for six samplebuildings are shown in Figure 7. This algorithm succeeded inovercoming several limitations of the segmentation process, suchas partially occluded regions, overshooting and undershootingborders, and incomplete regions. This is observed by comparingFigures 1, 2, and 7.Three-Dimensional Polygon
Harlan Onsrud, Spatial Information Science and Engineering, University of Maine Jeffrey K. Pinto, School of Business, Penn State Erie Gerard Rushton, Department of Geography, University of Iowa Jie Shan, School of Civil Engineering, Purdue University Bruce D. Spear, Federal Highway Administration Jonathan Sperling, Policy Development &