Transcription
Scrambling for Dollars: InternationalLiquidity, Banks and Exchange Rates Javier Bianchi†, Saki Bigio‡, and Charles Engel§January 2022AbstractWe develop a theory of exchange rate fluctuations arising from financial institutions’demand for dollar liquid assets. Financial flows are unpredictable and may leavebanks “scrambling for dollars.” Because of settlement frictions in interbank markets, aprecautionary demand for dollar reserves emerges and gives rise to an endogenousconvenience yield on the dollar. We show that an increase in the dollar funding riskleads to a rise in the convenience yield and an appreciation of the dollar, as banksscramble for dollars. We present empirical evidence on the relationship betweenexchange rate fluctuations for the G10 currencies and the quantity of dollar liquidity,which is consistent with the theory.Keywords: Exchange rates, liquidity premia, monetary policyJEL Classification: E44, F31, F41, G20We would like to thank the discussants Benjamin Hebert, Oleg Itskhoki, Rohan Kekre, Ernest Liu, DmitryMukhin, Jesse Schreger, Jenny Tang, and Motohiro Yogo, as well as Andy Atkeson, Roberto Chang, PierreOlivier Gourinchas, Arvind Krishnamurthy, Martin Eichenbaum, Sebnem Kalemli-Ozcan, Matteo Maggiori,Ken Miyahara, Sergio Rebelo, and Hélène Rey for excellent comments. We also thank participants at variousconferences and seminars.†Federal Reserve Bank of Minneapolis, email javier.i.bianchi@gmail.com‡Department of Economics, University of California, Los Angeles and NBER, emailsbigio@econ.ucla.edu§Department of Economics, University of Wisconsin, Madison, NBER and CEPR, emailcengel@ssc.wisc.edu
1IntroductionThe well-known “disconnect” in international finance holds that foreign exchange ratesshow little empirical relationship to the macro variables, such as interest rates and output(Obstfeld and Rogoff, 2000). More recent work contends that the source of the disconnect isin financial markets (Itskhoki and Mukhin, 2021). Moreover, there has long been evidenceof time-varying expected excess returns in foreign exchange markets, and furthermore, itappears that the US dollar is particularly special, as dollar assets offer lower average returnsrelative to the rest of the major currencies when measured on historical data (Gourinchasand Rey, 2007a). To account for the exchange rate disconnect and associated puzzles, theliterature has turned to models with currency excess returns as the potential “missing link.”The source or sources of these excess returns, however, remains an unsolved mystery.In this paper, we develop a theory of exchange rate fluctuations arising from the liquiditydemand by financial institutions within an imperfect interbank market. We build on twoobservations of the international financial system. First, US dollars are the dominantsource of foreign-currency funding. According to the BIS locational banking statistics, inMarch 2021, the global banking and non-bank financial sector had cross-border dollarliabilities of over 11 trillion. Second, dollar funding may turn unstable. As documented,for example, in Acharya, Afonso, and Kovner (2017), banks are occasionally subject tolarge funding uncertainty or interbank market freezing that can leave them “scramblingfor dollars.” Narrative discussions attribute fluctuations in the US dollar exchange rate tosuch vicissitudes in the short-term international money markets. A contribution of ourpaper is to develop a framework to formally articulate this channel and provide empiricalevidence consistent with it.We construct a model in which financial institutions, which we refer to simply as “banks,”hold assets and liabilities in two currencies. Banks face the risk of sudden outflows ofliabilities. If a bank ends up short of liquid assets to settle those flows, it needs to find acounterparty, but there may be times when banks may lose confidence in one another andcreate frictions in the interbank market. As insurance against these outflows, banks maintaina buffer of liquid assets—especially dollar liquid assets, in line with the aforementionedobservations on the international financial system. To the extent that funding risk andthe frictions in the interbank markets vary over time, this changes the relative demand forcurrencies, resulting in movements in the exchange rate.The theory uncovers how frictions in the settlement of international deposit flowsemerge as a dollar liquidity premium. This dollar liquidity premium generates a time1
varying wedge in the interest parity condition, or “convenience yield,” which plays apivotal role in the determination of the exchange rate. Critically, the convenience yieldis endogenous and depends on the quantity of outside money (liquid assets) and policyrates, as well as the matching frictions in the interbank market and the volatility of depositflows in different currencies. Through this endogenous convenience yield, we link thenominal exchange rates and the dollar liquidity premium to the reserve position of banksin different currencies, funding risk, and confidence in the interbank market.On the surface, the model resembles the seminal monetary exchange rate model ofLucas (1982). In that model, two currencies earn a liquidity premium over bonds becausecertain goods must be bought with corresponding currencies. A money demand equationdetermines prices in both currencies, and relative prices determine the exchange rate. Ourmodel shares Lucas’s segmentation of transactions and exchange rate determination. However, in our model, the demand for reserves in either currency stems from the settlementdemand by banks, giving rise to different predictions of how the exchange rate reacts toshocks and to policy. In particular, our model rationalizes why the dollar tends to appreciate in times of high volatility, therefore acting as a “safe haven”. This is a phenomenonthat has been challenging to reconcile with existing models of financial intermediaries (see,Maggiori, 2017).1Many recent theories have focused primarily on risk premia or external financing premiato explain excess currency returns and exchange rate movements. Risk premium modelsexplain excess dollar returns as stemming from how currencies other than the dollar havegreater exposure to global pricing factors. External financing premium models accountfor excess dollar returns as emerging from banks’ balance sheet constraints and limits tointernational arbitrage.2 We provide an alternative theory based on a liquidity premium.Our baseline model abstracts from risk premia and limits to international arbitrage to focussquarely on liquidity. At the center of the model is the idea that funding risk may leavebanks scrambling for dollars.We provide empirical evidence consistent with the theory by relating the bankingsector’s balance sheet data to the foreign currency price of US dollars. According tothe theory, the financial sector increases its demand for liquid dollar assets relative todollar funding—US government obligations, including Treasuries and reserves held atthe Federal Reserve—when funding becomes more uncertain, and this in turn translatesMaggiori (2017) shows that in a global downturn, US households bear a larger share of the losses relativeto the rest of the world. With home bias, this means that the dollar must experience a real depreciation in aglobal downturn.2See Lustig, Roussanov, and Verdelhan (2011, 2014) and Gabaix and Maggiori (2015) for importantexamples in these two strands of the literature.12
into an appreciation of the dollar. Our analysis shows that the dollar liquidity ratio, theratio of dollar liquid assets relative to dollar funding, does indeed positively correlate withthe relative value of the dollar. Notably, this relationship is robust to controlling for theVIX index, a variable that captures a broad measure of uncertainty and has been shown tohave significant explanatory power for exchange rates (Brunnermeier, Nagel, and Pedersen,2008; Lilley, Maggiori, Neiman, and Schreger, 2019). The liquidity ratio is, of course, notan exogenous driver of exchange rates—neither in our model nor in the data. However, wedemonstrate that, theoretically, funding risk drives this empirical correlation. Moreover, weshow that a calibrated version of our model produces a positive relationship between thechange in the liquidity ratio and the value of the dollar, and we argue through quantitativecounterfactuals that funding risk is an important driver of exchange rate fluctuations.Literature Review. A large strand of the literature has developed models of the risk premium to address the forward premium puzzle and the large excess returns of the carrytrade.3 On the empirical side, Lustig, Roussanov, and Verdelhan (2014) identify a dollar riskfactor that makes the dollar carry-trade profitable, while Hassan and Mano (2019) providea decomposition of the factors that drive the dollar carry-trade and the cross-sectionaldeviations from uncovered interest parity. Kalemli-Özcan (2019) and Kalemli-Özcan andVarela (2021) document that the factors driving risk premia among advanced economiesand emerging markets are different.An important development in the literature has been the modeling of the “safe haven”status of the US dollar and its association with the “exorbitant privilege” that the US enjoysfrom the returns on its net foreign asset position (Gourinchas and Rey, 2007a,b). Caballero,Farhi, and Gourinchas (2008) provide a model that links the special ability of the US toproduce financial assets to the evolution of capital flows and excess returns. Other papershave modeled the US as a country that is willing to assume more risk, perhaps because itsinternal financial markets are more developed and therefore willing to hold riskier assetsthat yield a higher expected return (see, for example, Mendoza, Quadrini, and Rios-Rull,2009; Gourinchas, Rey, and Govillot, 2010; Gourinchas, Rey, and Govillot, 2010; Maggiori,2017; Farhi and Maggiori, 2018). Gourinchas, Rey, and Sauzet (2019) provide an overviewof this literature.Another strand of the literature has focused on the interaction between risk-averseinvestors and preferred habitat investors or noise traders, who may not be motivated bySee Bansal and Shaliastovich (2013); Colacito (2009); Colacito and Croce (2011, 2013); Colacito, Croce,Gavazzoni, and Ready (2018); Colacito, Croce, Ho, and Howard (2018); Lustig and Verdelhan (2007); Verdelhan (2010), Burnside, Eichenbaum, Kleshchelski, and Rebelo (2011), Farhi and Gabaix (2016), and Farhi,Fraiberger, Gabaix, Ranciere, and Verdelhan (2015). Engel (1996, 2014) surveys empirical and theoreticalmodels.33
risk/return considerations in their portfolio choice. These studies include Koijen and Yogo(2020)’ general model of portfolio choice, the preferred habitat models of Gourinchas, Ray,and Vayanos (2021), and Greenwood, Hanson, Stein, and Sunderam (2020).Our paper is also related to a recent literature that places special emphasis on international financial intermediaries (see Gabaix and Maggiori 2015; Amador, Bianchi, Bocola,and Perri 2020; Fanelli and Straub 2020; Itskhoki and Mukhin, 2021 and the review byMaggiori (2021)).4 Different from these papers, we do not introduce collateral constraintsor other limits to lending. The failure of covered interest parity since the global financialcrisis is often interpreted as evidence of limits to arbitrage (see e.g., Baba and Packer (2009);Du, Tepper, and Verdelhan (2018), Avdjiev, Du, Koch, and Shin (2019); Liao (2020); andthe survey of Du and Schreger (2021)). Our study offers an alternative channel by whichdeviations from covered interest parity might arise.Our model is closely connected to the recent literature on convenience yields in foreignexchange markets. Engel (2016), Valchev (2020), Jiang, Krishnamurthy, and Lustig (2020,2021), Engel and Wu (2018), and Kekre and Lenel (2021) provide simple, descriptivemodels of the convenience yield using bonds in the utility function and show how thisaffect exchange rates. In particular, Jiang, Krishnamurthy, and Lustig (2021) and Kekreand Lenel (2021) provide equilibrium models in which the appreciation of the dollar isdriven by an increase in its convenience yield and show how this can potentially accountfor the resolution of reserve currency paradox documented in Maggiori (2017). Our studymight be described as providing “microfoundations” for the convenience yield, which isessential for a deeper understanding of the factors that drive changes in the demand forUS dollar assets and exchange rates. In particular, our model can account for why times ofelevated funding risk translate into appreciations of the dollar and thus make the dollar a“safe haven”.Our paper also relates to an emerging literature on interbank market frictions andmonetary policy (see e.g. Bianchi and Bigio (2021); Piazzesi and Schneider (2021); andWeill (2020) for a review) To the best of our knowledge, our paper provides a first attemptat incorporating these frictions in an open economy framework. Our model builds moreclosely on Bianchi and Bigio (2021). We extend their model by considering multiplecurrencies and allowing for aggregate uncertainty.Finally, our paper is related to the literature on the preeminence of the dollar in international financial markets. Rey (2013, 2016) and Miranda-Agrippino and Rey (2020) identifyUS monetary policy as a key factor in the global financial cycle. Gopinath (2016) andA related literature also emphasizes domestic asset market segmentation (Alvarez, Atkeson, and Kehoe,2009) and constraints on portfolio choices (Bacchetta and Van Wincoop, 2010).44
Gopinath, Boz, Casas, Dı́ez, Gourinchas, and Plagborg-Møller (2020) stress the dominantrole of the dollar unit of account as one possible key channel. Gopinath and Stein (2021)provide a link between trade invoicing and the role of the dollar as a safe store of value. Wepropose a different channel based on dominant role of the dollar in the funding market.Organization. The paper is organized as follows. Section 2 presents the empirical analysis.Section 3 presents the model, and Section 4 characterizes properties of the model. Section5 presents the calibration of the model and the quantitative results. Section 6 concludes.All proofs are in the Appendix.2Empirical Analysis of Liquidity and Exchange RatesWe begin with a look at the data relating the banking sector’s balance sheet and the foreigncurrency price of US dollars. Our thesis, at its simplest, is that the financial sector increasesits demand for liquid dollar assets, including US government obligations and reserves heldat the Federal Reserve, when funding becomes more uncertain, and this drives movementsin exchange rates. Before the analysis, it is useful to provide some of the institutionalbackground that underlies the thesis.Institutional background. The US dollar serves as the leading funding currency. Close tohalf of all cross-border bank loans and international debt securities are denominated indollars. In addition to serving as the key international unit of account, the dollar serves asa vehicle currency for foreign exchange transactions and an invoicing currency for globaltrade. In fact, 85% of all foreign exchange transactions occur against the US dollar, and 40%of international payments are made in US dollars.5,6The central role of the US dollar in the international financial and monetary systemmeans that billions of US dollars circulate within and across countries every day. As the2020 BIS working group report (Davies and Kent, 2020, p. 29) puts it,US dollar funding is channeled through the global financial system, involvingentities across multiple sectors and jurisdictions. Participants in these marketsface financial risks typically associated with liquidity, maturity, currency andcredit transformation. What makes global US dollar funding markets specialis the broad participation of non-US entities from all around the world. Theseparticipants are often active in US dollar funding markets without access to aSee Davies and Kent (2020) and the references therein.The global status of the US dollar dates to the Bretton Woods agreement, and this dominance has onlydeepened since then (Ilzetzki, Reinhart, and Rogoff, 2019).565
stable US dollar funding base or to standing central bank facilities which cansupply US dollars during episodes of market stress.At the same time Ivashina, Scharfstein, and Stein (2015) note that “[European] banks relyon wholesale dollar funding, while raising more of their euro funding through insuredretail deposits” (p. 1241), implying that dollar funding is more volatile and potentiallyless certain during times of instability.The other pillar of our thesis is that financial institutions are subject to liquidity mismatch. To the extent that banks are not able to liquidate loans or other relatively illiquidassets, financial institutions’ demand for dollars can fluctuate considerably, depending onfunding risk and the vicissitudes of foreign exchange transactions. We will next argue thatchanges in these conditions translate in the data into movements in the dollar exchangerates.Data and empirical analysis. We examine the behavior of the dollar against that of the othernine G10 currencies, with special attention given to the euro. The euro area is especiallyimportant in our analysis because it encompasses a large economy with a financial systemthat relies heavily on short-term dollar funding. The other currencies are the Australiandollar, the Canadian dollar, the Japanese yen, the New Zealand dollar, the Norwegiankrone, the Swedish krona, the Swiss franc, and the UK pound.We look at two sources of data for the US banking system. Detailed data on short-termdollar funding and on liquid dollar assets are not readily available for the global financialsystem, so we use the US data as a proxy for the dollar-denominated elements of theglobal banking balance sheets. That is, we assume that when faced with uncertainty aboutdollar funding, foreign banks’ demand for liquid dollar assets responds in a similar way tothat of banks located in the US (including US-based subsidiaries of foreign banks). Thisapproach is also followed by Adrian, Etula, and Shin (2009), a study that aims to showhow the price of risk is related to banks’ balance sheets and the expected change in theexchange rate (rather than the current level of the exchange rate, which is our concernhere). More precisely, Adrian, Etula, and Shin focus on the state of the balance sheet at timet in forecasting et 1 et , as they are concerned with understanding the expected excessreturn on foreign bonds between t and t 1. Our interest is in how changes in the balancesheet between t 1 and t contribute to changes in the exchange rate between t 1 andt—that is, et et 1 .We consider two measures of short-term funding to financial intermediaries. The first,used by Adrian, Etula, and Shin (2009), is US dollar financial commercial paper, seriesDTBSPCKFM from Federal Reserve Economic Data (FRED). Another major source of6
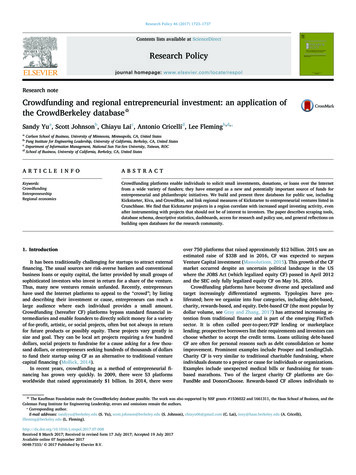
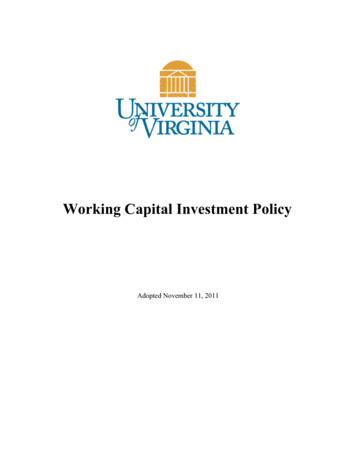
short-term funding to U.S. banks is demand deposits, measured by DEMDEPSL fromFRED. We construct a variable that measures the level of funding and the response offinancial intermediaries to uncertainty about that funding. We look at the ratio of the sumof reserves held at Federal Reserve banks and government securities (Treasury and agency)held by commercial banks (the sum of RESBALNS and USGSEC from FRED) to short-termfunding (DTBSPCKFM DEMDEPSL from FRED). This variable is endogenous in ourmodel, but its movements are a key indicator of how the demand for dollars is affectedby the financial sector’s demand for liquid assets when funding risk increases. As dollarfunding becomes more volatile for banks, they will increase their ratio of safe dollar assetsto liabilities. That in turn will lead to a global increase in dollar demand, leading to a dollarappreciation.The model we build describes financial intermediaries and their demand for liquid dollarassets. We see the intermediaries as representing a global collection of financial institutionsfrom the U.S. and the rest of the world, including money market funds, insurance firms,mutual funds, etc. However, we use proxies based on the U.S. banking system for tworeasons. First, while certain measures of short-term assets and liquid liabilities for the U.S.banking system are readily available and easily reproducible, this is not the case for otherfinancial intermediaries, including foreign banks. Second, different intermediaries havedifferent institutional and legal constraints, and so even if all the data were available, thereis no clear way to aggregate the short-term funding and liquid assets of all intermediaries.Thus, we argue it is preferable to use as a basis liquidity measures of the U.S. bankingsystem.Figure 1 plots this ratio of liquid government asset holdings to short-term funding ofthe financial sector.7 During this period, bank government asset holdings balances rosefrom around 10 billion dollars in August 2008 to nearly 800 billion dollars one year later,then reached a peak of around 2.3 trillion dollars by late 2017. They gradually declined to1.4 trillion dollars by the end of 2019. However, the liquidity ratio does not show movementanywhere near that magnitude. It is true that it rose during the onset of the global financialcrisis, but for the most part, this movement was not driven by the increase in reserves,because demand deposits rose almost proportionately. Instead, a large part of the rise inthe overall liquidity ratio was driven by a fall in financial commercial paper funding, whichworked to lower the denominator of the ratio. Subsequently, even as reserves continuedto increase, the liquidity ratio fell. The liquidity ratio is not mechanically determined bya decision of the central bank to inject or drain reserves from the banking system. Thepolicies of the central bank do affect the liquidity ratio, as our model explains, but from a7The figure also plots alternative measures described below.7
.5.11.21.5.32.42.53.5mechanical standpoint, the immediate effect of, for example, an open market purchase ofbonds by the Federal Reserve to increase reserves held by banks is an equal increase in theirliquid assets. However, as individual banks choose their optimal liquidity ratio, interestrates for various forms of funding adjust, and the liquidity ratio for the banking systemas a whole rebalances. As Acharya and Rajan (2021) put it: “central banks effectivelyissue these reserves to commercial banks, which have to finance them. For a variety ofreasons, the best way for a bank to finance short-term assets is with short-term liabilitiessuch as deposits. In times of liquidity stress, this offsetting liability could claim some ofthe liquidity created by the central bank.”2001m2 2003m8 2006m2 2008m8 2011m2 2013m8 2016m2 2018m8 2021m2Liquidity Ratio (LHS)Alternative Measure of Liquidity Ratio (LHS)Alternative Measure of Liquidity Ratio, M2 Currency (RHS)Figure 1: The Ratio of Liquid Assets to Short-Term LiabilitiesEmpirical results. In Table 1, we present the parameter estimates of the regression: et α β1 (LiqRatt ) β2 (πt πt ) β3 LiqDepRatt 1 ϵt .(1)In this regression, (xt ) means “the change from t 1 to t” in the variable xt ; et is thelog of the exchange rate expressed as the G10 currency price of a US dollar; LiqRatt is thelog of the liquidity ratio described above; πt πt is the difference between year-on-year8
inflation rates in each of the nine countries and the US. All data are monthly.8 The inflationvariable is meant to capture the effects of monetary policy on exchange rates. As much ofthe empirical literature has found, there is a negative relationship between the change in acountry’s inflation rate and its exchange rate. When inflation is rising in a country, underinflation-targeting regimes, markets anticipate future monetary tightening, and that leadsto a currency appreciation.If dollar funding risk is driving the LiqRatt , then we also expect a positive relationshipbetween this variable and et ; that is, β1 should be positive. During times of high uncertainty,banks hold greater amounts of liquid dollar assets (reserves and Treasury securities)relative to demand deposits, hence LiqRatt is higher. That increased demand for safe dollarassets leads to a stronger dollar (an increase in et .)We also include the lagged level of LiqRatt . We do so because the depreciation of thedollar might depend on lagged as well as current levels of this variable. The regressionswe report would have the same fit if we included current and lagged levels of this variable,instead of the change in the variable and the lagged level. We specify the regression asabove for two reasons: First, specifying the regression so that the change in the liquidityvariable influences the change in the exchange rate leads to a more natural interpretation.Second, while the current and lagged levels of the variable are highly correlated, whichleads to multicollinearity and imprecise coefficient estimates, the change and the laggedlevel are much less correlated.Table 1 reports the regression findings for the nine exchange rates. The sample periodis February 2001 to July 2021. (Data on financial commercial paper start in January 2001.)With the exception of Japan, the liquidity ratio variable has the expected sign and is statistically significant at the 1% level for all exchange rates.9 The relative inflation variable alsohas the correct sign for all the currencies and is statistically significant for most countries.It is common to look at short-term interest rate movements to account for the effects ofmonetary policy changes on exchange rates. During much of our sample period, interestrates were near the zero lower bound, and they do not appear to do a good job measuringthe monetary policy stance. We have included year-on-year inflation to capture the effectsof inflation targeting through unconventional monetary policy through the market’s anticipation of the policy response to past inflation. However, in Table A1 in the Appendix,we include it i t , the interest rate in each of the nine countries relative to the US, as aAn exception is that inflation for Australia and New Zealand are reported only quarterly. We linearlyinterpolate the data to get monthly series.9We will discuss a theoretical explanation for the regression coefficient and why it could be different forJapan after we present the model.89
regressor. None of the major conclusions are altered by its inclusion, but the interest ratevariables are mostly not statistically significant.We highlight that the key regressor, LiqRatt , is not simply a price variable, but aquantity variable. That is, these regressions above “explain” exchange rate movements butdo not rely on other market prices to do the job. It is a balance sheet variable that plays thepivotal role.We argue that funding risk drives the balance sheet variables, but a remaining concernis that funding risk is related to market uncertainty. What if we include a direct measureof uncertainty in the regressions? Many asset-pricing studies have used VIX to quantifymarket uncertainty, and VIX has explanatory power in accounting for the movementsof many asset prices. However, VIX does not directly measure uncertainty about dollarfunding for banks. Indeed, VIX might measure some dimensions of uncertainty, but itmight also be capturing global risk, which might be driving the dollar, as in the modelof Farhi and Gabaix (2016). Rey (2013) has found a strong correlation between VIX andprivate credit provided by banks, which suggests another dimension along which globalrisk affect the economy through banks’ intermediation function. In Table 2, we include thechange in VIX along with the other variables.As expected, VIX has positive coefficients in all cases (except again for Japan) and isstatistically significant. An increase in VIX is associated with an appreciation of the dollar.However, the introduction of this variable does not reduce the significance of the liquidityratio variable for any of the countries. For most, it has only a small effect on the magnitudeof the coefficient. This suggests that the uncertainty that is quantified by VIX does notinclude all of the forces that drive the liquidity ratio and lead to its positive associationwith dollar appreciation. (Appendix Table A2 also includes the interest rate differential.As in Table A1, we see that its inclusion has little influence on the findings, and its effect ismostly small and insignificant.)It is important to note that the liquidity ratio is not an exogenous driver of exchangerates—neither in our model nor in the data. We will show that regressions based onsimulated data from the model generate a positive association between the change in theliquidity ratio and the value of the dollar, in line with the empirical findings. Proposition 3below shows that the regression coefficient will depend on the variance and persistenceof the shocks. We note that much of the statistical significance of the liquidity ratio inthis regression arises from the period of the Global Financial Crisis when funding to thefinancial system was particularly uncertain, which is in line with our model.We can, however, use instrumental variables to isolate the effects of uncertainty on10
the liquidity ratio and their transmission to exchange rates. To that end, Table 3 uses twomeasures of uncertainty as instruments for the liquidity ratio: the cross-section standarddeviation of the inflation rates of the G10 countries at each time period, and the crosssection standard deviation of the rates of depreciation for these currencies. The findingsare largely the same as in Table 2. For most of the countries, the magnitude of the effect ofthe liquidity ratio on the
source of foreign-currency funding. According to the BIS locational banking statistics, in March 2021, the global banking and non-bank financial sector had cross-border dollar liabilities of over 11 trillion. Second, dollar funding may turn unstable. As documented, for example, inAcharya, Af