Transcription
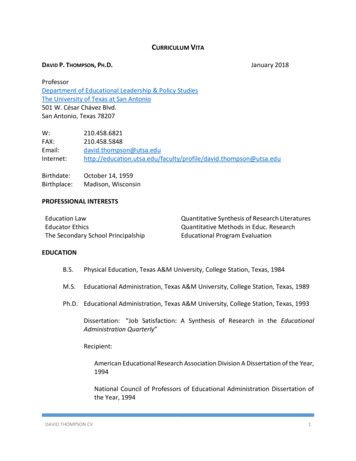
The Behavior Analyst2010, 33, 153–170No. 2 (Fall)Climate Change: The Evidence and Our OptionsLonnie G. ThompsonThe Ohio State UniversityGlaciers serve as early indicators of climate change. Over the last 35 years, our research team hasrecovered ice-core records of climatic and environmental variations from the polar regions andfrom low-latitude high-elevation ice fields from 16 countries. The ongoing widespread melting ofhigh-elevation glaciers and ice caps, particularly in low to middle latitudes, provides some of thestrongest evidence to date that a large-scale, pervasive, and, in some cases, rapid change inEarth’s climate system is underway. This paper highlights observations of 20th and 21st centuryglacier shrinkage in the Andes, the Himalayas, and on Mount Kilimanjaro. Ice cores retrievedfrom shrinking glaciers around the world confirm their continuous existence for periods rangingfrom hundreds of years to multiple millennia, suggesting that climatological conditions thatdominate those regions today are different from those under which these ice fields originallyaccumulated and have been sustained. The current warming is therefore unusual when viewedfrom the millennial perspective provided by multiple lines of proxy evidence and the 160-yearrecord of direct temperature measurements. Despite all this evidence, plus the well-documentedcontinual increase in atmospheric greenhouse gas concentrations, societies have taken littleaction to address this global-scale problem. Hence, the rate of global carbon dioxide emissionscontinues to accelerate. As a result of our inaction, we have three options: mitigation,adaptation, and suffering.Key words: climate, global warmingClimatologists, like other scientists,tend to be a stolid group. We are notgiven to theatrical rantings aboutfalling skies. Most of us are far morecomfortable in our laboratories orgathering data in the field than weare giving interviews to journalists orThis paper is based on the PresidentialScholar’s Address given at the 35th annualmeeting of the Association for BehaviorAnalysis International, Phoenix, Arizona. Iam grateful to Bill Heward for inviting me togive the address. I thank Mary Davis for herhelp editing the text and figures. I wish tothank all the field and laboratory teammembers from the Byrd Polar ResearchCenter who have worked so diligently overthe years. I am especially indebted to the hardwork of our current research team: EllenMosley-Thompson, Henry Brecher, MaryDavis, Paolo Gabrielli, Ping-Nan Lin, MattMakou, Victor Zagorodnov, and all of ourgraduate students. Funding for our researchover the years has been provided by theNational Science Foundation’s PaleoclimateProgram, the National Oceanic and Atmospheric Administration’s Paleoclimatologyand Polar Programs, the National Aeronauticand Space Administration, Gary ComerFoundation, and The Ohio State University’sClimate, Water and Carbon Program. This isByrd Polar Research Center Publication 1402.Address correspondence to Lonnie G.Thompson (e-mail: thompson.3@osu.edu).speaking before Congressional committees. Why then are climatologistsspeaking out about the dangers ofglobal warming? The answer is thatvirtually all of us are now convincedthat global warming poses a clear andpresent danger to civilization (‘‘Climate Change,’’ 2010).That bold statement may seem likehyperbole, but there is now a veryclear pattern in the scientific evidencedocumenting that the earth is warming, that warming is due largely tohuman activity, that warming iscausing important changes in climate,and that rapid and potentially catastrophic changes in the near futureare very possible. This pattern emerges not, as is so often suggested,simply from computer simulations,but from the weight and balance ofthe empirical evidence as well.THE EVIDENCEFigure 1 shows northern hemisphere temperature profiles for thelast 1,000 years from a variety of highresolution climate recorders such asglacier lengths (Oerlemans, 2005), treerings (Briffa, Jones, Schwerngruber,153
154LONNIE G. THOMPSONFigure 1. A variety of temperature records over the last 1,000 years, based on a variety ofproxy recorders such as tree rings, ice cores, historical records, instrumental data, etc., shows theextent of the recent warming. The range of temperature projected by Meehl et al. (2007) to 2100AD is shown by the shaded region, and the average of the range is depicted by the filled circle.Shiyatov, & Cook, 2002; Esper, Cook,& Schweingruber, 2002), and combined sources that include some or allof the following: tree rings, sedimentcores, ice cores, corals, and historicalrecords (Crowley & Lowery, 2000;Jones, Briffa, Barnett, & Tett, 1998;Mann, Bradley, & Hughes, 1999;Moberg, Sonechkin, Holmgrem, Datsenko, & Karlen, 2005). The heavygray line is a composite of all thesetemperatures (Mann & Jones, 2003),and the heavy black line depicts actualthermometer readings back to 1850(see National Research Council, 2006,for a review of surface temperaturereconstructions). Although the various curves differ from one another,their general shapes are similar. Eachdata source shows that average northern hemisphere temperatures remained relatively stable until the late20th century. It is the agreement ofthese diverse data sets and the patternthat make climatologists confidentthat the warming trend is real.Because these temperature numbers are based on northern hemi-
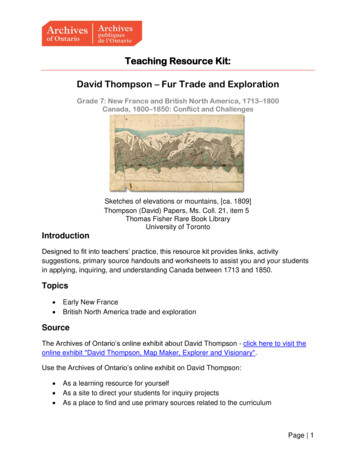
CLIMATE CHANGEsphere averages, they do not reflectregional, seasonal, and altitudinalvariations. For example, the averagetemperature in the western UnitedStates is rising more rapidly than inthe eastern part of the country, andon average winters are warmingfaster than summers (Meehl, Arblaster, & Tebaldi, 2007). The mostsevere temperature increases appearto be concentrated in the Arctic andover the Antarctic Peninsula as wellas within the interior of the largecontinents. This variability complicates matters, and adds to the difficulty of convincing the public, andeven scientists in other fields, thatglobal warming is occurring. Becauseof this, it may be useful to examineanother kind of evidence: melting ice.Retreat of Mountain GlaciersThe world’s mountain glaciers andice caps contain less than 4% of theworld’s ice cover, but they provideinvaluable information about changes in climate. Because glaciers aresmaller and thinner than the polar icesheets, their ratio of surface area tovolume is much greater; thus, theyrespond more quickly to temperaturechanges. In addition, warming trendsare amplified at higher altitudeswhere most glaciers are located(Bradley, Keimig, Diaz, & Hardy,2009; Bradley, Vuille, Diaz, & Vergara, 2006). Thus, glaciers provide anearly warning system of climatechange; they are our ‘‘canaries inthe coal mine.’’Consider the glaciers of Africa’sMount Kilimanjaro (Figure 2). Using a combination of terrestrial photogrammetric maps, satellite images,and aerial photographs, we havedetermined that the ice fields onKibo, the highest crater on Kilimanjaro, have lost 85% of their coverage since 1912 (Thompson, Brecher,Mosley-Thompson, Hardy, & Mark,2009).Figure 3 shows a series of aerialphotographs of Furtwängler glacier,155in the center of Kibo crater, takenbetween 2000 and 2007, when theglacier split into two sections. AsFurtwängler recedes, it is also thinning rapidly, from 9.5 m in 2000 to4.7 m in 2009 (for more images ofFurtwängler’s retreat, see urtwängler-Glacier-in-retreat). If youconnect the dots on the changes seento date and assume the same rate ofloss in the future, within the next decade many of the glaciers of Kilimanjaro, a Swahili word meaning ‘‘shiningmountain,’’ will have disappeared.The Quelccaya ice cap, which islocated in southern Peru adjacent tothe Amazon Basin, is the largesttropical ice field on Earth. Quelccayahas several outlet glaciers, glaciersthat extend from the edges of an icecap like fingers from a hand. Theretreat of one of these, Qori Kalis,has been studied and photographedsince 1963. At the beginning of thisstudy, Qori Kalis extended 1,200 mout from the ice cap, and there wasno melt water at the end (Figure 4,map top left). By the summer of2008, Qori Kalis had retreated to thevery edge of Quelccaya, leavingbehind an 84-acre lake, 60 m deep.Over the years, a boulder near thebase camp has served as a benchmarkagainst which to record the changesin the position of the edge of the ice.In 1977 the ice was actually pushingagainst the boulder (Figure 5, top),but by 2006 a substantial gap hadappeared and been filled by a lake(Figure 5, bottom). Thus, the loss ofQuelccaya’s ice is not only on theQori Kalis glacier but also on themargin of the ice cap itself. Since1978, about 25% of this tropical icecap has disappeared.The Himalayan Mountains arehome to more than 15,000 glaciers.Unfortunately, only a few of theseglaciers have been monitored over anextended period, so reliable groundobservations that are crucial for
156LONNIE G. THOMPSONFigure 2. The retreat of glaciers on Mount Kilimanjaro can be seen in the photographs from1912, 1970, 2000, and 2006; from 1912 to 2006, 85% of the ice has disappeared.
CLIMATE CHANGE157Figure 3. Deterioration of the Furtwängler glacier in the center of Kibo crater on MountKilimanjaro. Since 2000 the ice field has decreased in size and thickness and has divided in two.
158LONNIE G. THOMPSONFigure 4. Retreat of the Qori Kalis outlet glacier on the Quelccaya ice cap. Each line showsthe extent of the ice. The photos along the bottom provide a pictorial history of the melting ofthe Qori Kalis outlet glacier and the formation of a lake. The retreat of Qori Kalis is similar tothe loss of several Peruvian glaciers, as shown in the graph insert.determining regional retreat rates donot yet exist. However, a recent studyof an ice core from the Naimona’nyiglacier in the southwestern Himalayas (Kehrwald et al., 2008) showsthat ice is disappearing from the topof the glacier, as shown by the lack ofthe radioactive bomb layers from the1950s and early 1960s that appear inall Tibetan and Himalayan ice corerecords (Thompson, 2000; Thompson et al., 1990, 1997, 2006).Glaciologists at the Institute ofTibetan Plateau Research in Beijinghave been monitoring 612 glaciersacross the High Asian region since1980. These scientists found thatfrom 1980 to 1990, 90% of theseglaciers were retreating; from 1990 to2005, the proportion of retreatingglaciers increased to 95% (Yao, Pu,Lu, Wang, & Yu, 2007).A study of 67 glaciers in Alaskafrom the mid-1950s to the mid-1990sshows that all are thinning (Arendt,Echelmeyer, Harrison, Lingle, & Valentine, 2002). In northern Alaska’sBrooks Range, 100% of the glaciersare in retreat, and in southeasternAlaska 98% are shrinking (Molnia,2007). Glacier National Park in Montana contained more than 100 glacierswhen it was established in 1910.Today, just 26 remain, and at thecurrent rate of decrease it is estimatedthat by 2030 there will be no glaciersin Glacier National Park (Hall &Fagre, 2003). The oldest glacier photos come from the Alps. Ninety-ninepercent of the glaciers in the Alps areretreating, and 92% of Chile’s Andeanglaciers are retreating (Vince, 2010).The pattern described here is repeated around the world. Mountain
CLIMATE CHANGE159Figure 5. Top: photo taken in 1978 shows a margin of the Quelccaya ice cap pushing against aboulder. Bottom: the same margin is shown in a 2005 photo. The ice has receded and has beenreplaced by a small lake. The boulder shown in the top photo is located in the center of the whitecircle to the right.
160LONNIE G. THOMPSONglaciers nearly everywhere are retreating.Loss of Polar IceSatellite documentation of the areacovered by sea ice in the Arctic Oceanextends back three decades. This area,measured each September, decreasedat a rate of about 8.6% per decadefrom 1979 to 2007. In 2007 alone,24% of the ice disappeared. In 2006the Northwest Passage was ice freefor the first time in recorded history.As noted earlier, polar ice sheetsare slower to respond to temperaturerise than the smaller mountain glaciers, but they, too, are melting. TheGreenland ice sheet has also experienced dramatic ice melt in recentyears. There has been an increase inboth the number and the size of lakesin the southern part of the ice sheet,and crevices can serve as conduits(called moulins) that transport meltwater rapidly into the glacier. Waterhas been observed flowing throughthese moulins down to the bottom ofthe ice sheet where it acts as alubricant that speeds the flow of iceto the sea (Das et al., 2008; Zwally etal., 2002).The ice in Antarctica is alsomelting. The late John Mercer, aglacial geologist at The Ohio StateUniversity, long ago concluded thatthe first evidence of global warmingdue to increasing carbon dioxide(CO2) would be the breakup of theAntarctic ice shelves (Mercer, 1978).Mean temperatures on the AntarcticPeninsula have risen 2.5u C (4.5u F) inthe last 50 years, resulting in thebreakup of the ice shelves in just theway Mercer predicted. One of themost rapid of these shelf deteriorations occurred in 2002, when theLarsen B, a body of ice over 200 mdeep that covered an area the size ofRhode Island, collapsed in just 31 days(see images 2351).An ice shelf is essentially an icebergattached to land ice. Just as an icecube does not raise the water level ina glass when it melts, so a melting iceshelf leaves sea levels unchanged.But ice shelves serve as buttresses toglaciers on land, and when those iceshelves collapse it speeds the flow ofthe glaciers they were holding backinto the ocean, which causes sealevel to rise rapidly.Just days before this paper went topress, a giant ice island four times thesize of Manhattan broke off thePetermann glacier in Greenland. Thisevent alone does not prove globalclimate change, because half of theice loss from Greenland each yearcomes from icebergs calving from themargins. It is the fact that this eventis part of a long-term trend ofincreasing rates of ice loss, coupledwith the fact that temperature isincreasing in this region at the rateof 2u C (3.6u F) per decade, thatindicates that larger scale globalclimate change is underway.The loss of ice in the Arctic andAntarctic regions is especially troubling because these are the locationsof the largest ice sheets in the world.Of the land ice on the planet, 96% isfound on Greenland and Antarctica.Should all this ice melt, sea levelwould rise over 64 m (Church et al.,2001; Lemke et al., 2007), and ofcourse the actual sea level would bemuch higher due to thermal expansion of the world’s oceans as theywarm.Although research shows somevariability in the rate of ice loss, it isclear that mountain glaciers andpolar ice sheets are melting, and thereis no plausible explanation for thisbut global warming. Add to this thelaboratory evidence and the meteorological measurements, and the casefor global warming cannot be denied.So what causes global temperaturesto rise?CAUSES OF GLOBAL WARMINGClimatologists strive to reconstructpast climate variations on regional
CLIMATE CHANGEand global scales, but they also try todetermine the mechanisms, calledforcers, that drive climate change.Climatologists recognize two basiccategories of forcers. Natural forcersare recurring processes that havebeen around for millions of years;anthropogenic forcers are more recent processes caused by humanactivity.One familiar natural forcer is theearth’s orbit around the sun, whichgives us our seasons. In the northernhemisphere, June is warm because thesun’s rays fall more directly on it, andthe sun appears high in the sky; in thesouthern hemisphere, June is coolbecause the sun’s rays hit the earth ata deep angle, and the sun appears lowin the sky.Less obvious natural forcers include short- and long-term changes inthe atmosphere and ocean. For example, when Mount Pinatubo erupted in the Philippines in 1991, itspewed millions of tons of sulfuricgases and ash particles high into theatmosphere, blocking the sun’s rays.This lowered global temperatures forthe next few years. Another naturalforcer is the linked oceanic andatmospheric system in the equatorialPacific Ocean known as the El NiñoSouthern Oscillation (ENSO). ENSOoccurs every 3 to 7 years in thetropical Pacific and brings warm,wet weather to some regions andcool, dry weather to other areas.Other natural forcers include periodic changes in energy from the sun.These include the 11- to 12-yearsunspot cycle and the 70- to 90-yearWolf-Gleissberg cycle, a modulationof the amplitude of the 11-year solarcycle. These changes in solar energycan affect atmospheric temperatureacross large regions for hundreds ofyears and may have caused the‘‘medieval climate anomaly’’ in thenorthern hemisphere that lasted fromabout 1100 AD to 1300 AD. Solarcycles may also have played a role inthe cause of the ‘‘little ice age’’ inNorth America and Europe during161the 16th to 19th centuries. Thesechanges in climate, which are oftencited by those who dismiss globalwarming as a normal, cyclical event,affected large areas, but not the Earthas a whole. The medieval climateanomaly showed warmth that matches or exceeds that of the past decadein some regions, but it fell well belowrecent levels globally (Mann et al.,2009).The most powerful natural forcersare variations in the orbit of theEarth around the Sun, which lastfrom 22,000 to 100,000 years. These‘‘orbital forcings’’ are partly responsible for both the ice ages (the glacialperiods during which large regions athigh and midddle latitudes are covered by thick ice sheets), and for thewarm interglacial periods such as thepresent Holocene epoch which beganabout 10,000 years ago.There is consensus among climatologists that the warming trend wehave been experiencing for the past100 years or so cannot be accountedfor by any of the known naturalforcers. Sunspot cycles, for example,can increase the sun’s output, raisingtemperatures in our atmosphere. Weare seeing a temperature increase inthe troposphere, the lower level of ouratmosphere, and a temperature decrease in the stratosphere, the upperlevel. But this is the exact opposite ofwhat we would get if increased solarenergy were responsible. Similarly,global temperatures have increasedmore at night than during the day,again the opposite of what wouldoccur if the sun were driving globalwarming. In addition, temperatureshave risen more in winter than insummer. This, too, is the opposite ofwhat would be expected if the sunwere responsible for the planet’swarming. High latitudes have warmed more than low latitudes, andbecause we get more radiation fromthe sun at low latitudes, we againwould expect the opposite if the sunwere driving these changes. Thus,changes in solar output cannot ac-
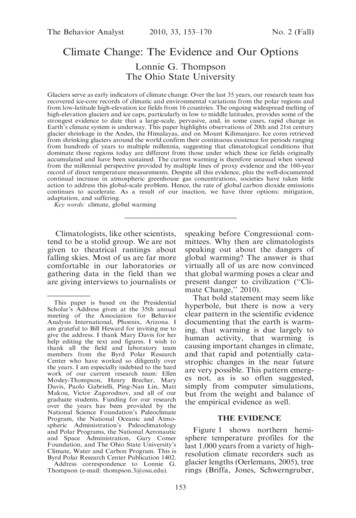
162LONNIE G. THOMPSONcount for the current period of globalwarming (Meehl et al., 2007). ENSOand other natural forcers also fail toexplain the steady, rapid rise in theearth’s temperature. The inescapableconclusion is that the rise in temperature is due to anthropogenic forces,that is, human behavior.The relatively mild temperatures ofthe past 10,000 years have beenmaintained by the greenhouse effect,a natural phenomenon. As orbitalforcing brought the last ice age to anend, the oceans warmed, releasingCO2 into the atmosphere, where ittrapped infrared energy reflectedfrom the earth’s surface. This warmedthe planet. The greenhouse effect is anatural, self-regulating process that isabsolutely essential to sustain life onthe planet. However, it is not immutable. Change the level of greenhousegases in the atmosphere, and theplanet heats up or cools down.Greenhouse gases are captured inice, so ice cores allow us to see thelevels of greenhouse gases in agespast. The longest ice core everrecovered (from the European Project for Ice Coring in Antarctica)takes us 800,000 years back in time,and includes a history of CO2 andmethane levels preserved in bubblesin the ice (Loulergue et al., 2008;Lüthi et al., 2008). The CO2 andmethane curves illustrated in Figure 6 show that the modern levels ofthese gases are unprecedented in thelast 800 millennia.Globally, CO2 concentrations havevaried between 180 and 190 parts permillion per volume (ppmv) duringglacial (cold) periods and between270 and 290 ppmv during interglacial(warm) periods. However, since theonset of the Industrial Revolution,when fossil fuel use (chiefly coal andoil) began to burgeon, CO2 concentration has increased about 38% overthe natural interglacial levels (Forsteret al., 2007). Between 1975 and 2005,CO2 emissions increased 70%, andbetween 1999 and 2005 global emissions increased 3% per year (Mar-land, Boden, & Andres, 2006). As ofthis writing, the CO2 concentration inthe atmosphere is 391 ppmv (MaunaLoa CO2 annual mean data from theNational Oceanic and AtmosphericAdministration, 2010), a level notseen at any time in 800,000 years.Climatologists have identified nonatural forcers that could accountfor this rapid and previously unseenrise in CO2.Methane raises temperature evenmore than CO2, and the amount ofmethane in the atmosphere, like thatof CO2, is also at a level not seen in800 millennia. Two thirds of currentemissions of methane are by-productsof human activity, things like theproduction of oil and natural gas,deforestation, decomposition of garbage and sewage, and raising farmanimals.Many people find it difficult tobelieve that human activity can affecta system as large as Earth’s climate.After all, we are so tiny compared tothe planet. But every day we tinyhuman beings drive cars; watchtelevision; turn on lamps; heat orcool our houses and offices; eat foodtransported to us by planes, ships,and trucks; clear or burn forests; andbehave in countless other ways thatdirectly or indirectly release greenhouse gases into the air. Together, wehumans emitted eight billion metrictons of carbon to our planet’s atmosphere in 2007 alone (Boden, Marland, & Andres, 2009). (CO2 weighs3.66 times more than carbon; thatmeans we released 29.3 billion metrictons of CO2.) The evidence is overwhelming that human activity isresponsible for the rise in CO2,methane, and other greenhouse gaslevels, and that the increase in thesegases is fueling the rise in meanglobal temperature.A global temperature rise of a fewdegrees may not seem such a badthing, especially to people living inharsh, cold climates. But globalwarming does not mean merely thatwe will trade parkas for T-shirts or
CLIMATE CHANGE163Figure 6. Concentrations of carbon dioxide (CO2) and methane (CH4) over the last800,000 years (eight glacial cycles) from East Antarctic ice cores. Data from Loulergue et al.(2008) and Lüthi et al. (2008). The current concentrations of CO2 and CH4 are also shown(Forster et al., 2007).turn up the air conditioning. Awarming planet is a changing planet,and the changes will have profoundconsequences for all species that liveon it, including humans. Thosechanges are not just something ourchildren and grandchildren will haveto deal with in the future; they aretaking place now, and are affectingmillions of people.EFFECTS OFGLOBAL WARMINGOne effect of global warming thateveryone has heard about is a rise insea levels. About half of this rise is dueto thermal expansion: Ocean temperatures are rising, and as water warmsit expands. Put a nearly full cup ofwater in a microwave and heat it, andthe water will spill over the cup.In addition to thermal expansion,the oceans are rising because ice ismelting, and most of that waterinevitably finds its way to the sea.So far, most of that water has comefrom mountain glaciers and ice caps(Meier et al., 2007). As global temperatures increase, sea level rise willmainly reflect polar ice melt. So far,ocean rise has been measured in
164LONNIE G. THOMPSONmillimeters, but there is enough waterin the Greenland ice sheet alone toraise sea levels by about 7 m, WestAntarctica over 5 m, and EastAntarctica about 50 m (Lemke etal., 2007). If the Earth were to losejust 8% of its ice, the consequencesfor some coastal regions would bedramatic. The lower part of theFlorida peninsula and much ofLouisiana, including New Orleans,would be submerged, and low-lyingcities, including London, New York,and Shanghai, would be endangered(to see the effects of various magnitudes of sea level rise in the SanFrancisco Bay area, go to shtm).Low-lying continental countriessuch as the Netherlands and muchof Bangladesh already find themselves battling flooding more thanever before. Many small island nations in the western Pacific (e.g.,Vanuatu) are facing imminent destruction as they are gradually overrun by the rising ocean. Indonesia isan island nation, and many of its17,000 islands are just above sealevel. At the 2007 United NationsClimate Change Conference in Bali,Indonesian environmental ministerRachmat Witoelar stated that 2,000of his country’s islands could be lostto sea level rise by 2030. At currentrates of sea level rise, another islandnation, the Republic of Maldives, willbecome uninhabitable by the end ofthe century (http://unfcc.int/resource/docs/napa/mdv01.pdf). In 2008, thepresident of that country, MohamedNasheed, announced that he wascontemplating moving his people toIndia, Sri Lanka, and Australia(Schmidle, 2009). One of the majoreffects of continued sea level rise willbe the displacement of millions ofpeople. Where millions of climaterefugees will find welcome is unclear.The migration of large numbers ofpeople to new territories with different languages and cultures will bedisruptive, to say the least.In addition to the danger ofinundation, rising sea levels bring saltwater into rivers, spoil drinking wells,and turn fertile farmland into uselessfields of salty soil. These effects ofglobal warming are occurring now inplaces like the lowlands of Bangladesh (Church et al., 2001).People on dry land need the freshwater that is running into the sea. Inthe spring, melting ice from mountain glaciers, ice caps, and snowfields furnish wells and rivers thatprovide fresh water for drinking,agriculture, and hydroelectric power. For example, in the dry season,people in large areas of India, Nepal,and southern China depend on riversfed by Himalayan glaciers. Theretreat of these glaciers threatensthe water supply of millions ofpeople in this part of the world.Peru relies on hydroelectric powerfor 80% of its energy (Vergara et al.,2007), a significant portion of whichcomes from mountain streams thatare fed by mountain glaciers and icefields. In Tanzania, the loss ofMount Kilimanjaro’s fabled ice cover would likely have a negativeimpact on tourism, which is thecountry’s primary source of foreigncurrency. The glaciers and snowpacks in the Rocky Mountains areessential for farming in California,one of the world’s most productiveagricultural areas.Global warming is expanding aridareas of the Earth. Warming at theequator drives a climate system calledthe Hadley Cell. Warm, moist airrises from the equator, loses itsmoisture through rainfall, movesnorth and south, and then falls tothe Earth at 30u north and southlatitude, creating deserts and aridregions. There is evidence that overthe last 20 years the Hadley Cell hasexpanded north and south by about2u latitude, which may broaden thedesert zones (Seidel, Fu, Randel, &Reichler, 2008; Seidel & Randel,2007). If so, droughts may becomemore persistent in the American
CLIMATE CHANGESouthwest, the Mediterranean, Australia, South America, and Africa.Global warming can also haveeffects that seem paradoxical. Continued warming may change oceancurrents that now bring warm waterto the North Atlantic region, giving ita temperate climate. If this happens,Europe could experience a coolingeven as other areas of the worldbecome warmer.Accelerating ChangeIt is difficult to assess the fulleffects of global warming, and harderstill to predict future effects. Climatepredictions are made with computermodels, but these models have assumed a slow, steady rate of change.Our best models predict a temperature rise in this century of between2.4u and 4.5u C (4.3u and 8.1u F), withan average of about 3u C (5.4u F;Meehl et al., 2007; Figure 1). Butthese models assume a linear rise intemperature. Increasingly, computermodels have underestimated thetrends because, in fact, the rate ofglobal temperature rise is accelerating. The average rise in globaltemperature was 0.11u F per decadeover the last century (National Oceanic and Atmospheric Administration, 2009). Since the late 1970s,however, this rate has increased to0.29u F per decade, and 11 of thewarmest years on record have occurred in the last 12 years. May,2010, was the 303rd consecutivemonth with a global temperaturewarmer than its 20th-century average(National Oceanic and AtmosphericAdministration, 2010).The acceleration of global temperature is reflected in increases in therate of ice melt. From 1963 to 1978,the rate of ice loss on Quelccaya wasabout 6 m per year. From 1991 to2006, it averaged 60 m per year, 10times faster than the initial rate(Thompson et al., 2006). A recentpaper by Matsuo and Heki (2010)reports uneven ice loss from the high165Asian ice fields, as measured by theGravity Recovery and Climate Experiment satellite observations between 2003 and 2009. Ice retreat inthe Himalayas slowed slightly duringthis period, and loss in the mountainsto the northwest increased markedlyover the last few years. Nevertheless,the average rate of ice melt in theregion was twice the rate of fourdecades before. In the last decade,many of the glaciers that drainGreenland and Antarctica have accelerated their discharge into theworld’s oceans from 20% to 100%(Lemke et al., 2007).Increasing rates of ice melt shouldmean an increasing rate of sea levelrise, and this is in fact the case. Overmost of the 20th century, sea levelrose about 2 mm per year. Since1990, the
togrammetric maps, satellite images, and aerial photographs, we have determined that the ice fields on Kibo, the highest crater on Kiliman-jaro, have lost 85% of their cover-age since 1912 (Thompson, Brecher, Mosley-Thompson, Hardy, & Mark, 2009). Figure 3 shows a series of aerial photographs of Furtwa ngler glacier, in the center of Kibo .