Transcription
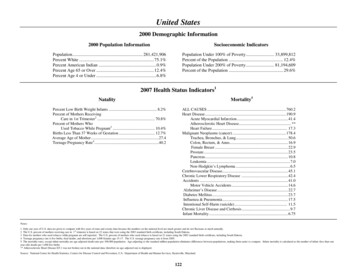
United States2000 Demographic Information2000 Population InformationSocioeconomic IndicatorsPopulation . 281,421,906Percent White . 75.1%Percent American Indian . 0.9%Percent Age 65 or Over . 12.4%Percent Age 4 or Under . 6.8%Population Under 100% of Poverty . 33,899,812Percent of the Population . 12.4%Population Under 200% of Poverty . 81,194,609Percent of the Population . 29.6%2007 Health Status Indicators1Mortality5NatalityPercent Low Birth Weight Infants . 8.2%Percent of Mothers ReceivingCare in 1st Trimester2 . 70.8%Percent of Mothers WhoUsed Tobacco While Pregnant3 . 10.4%Births Less Than 37 Weeks of Gestation . 12.7%Average Age of Mother .27.4Teenage Pregnancy Rate4.40.2ALL CAUSES . 760.2Heart Disease . 190.9Acute Myocardial Infarction . 41.4Atherosclerotic Heart Disease. **Heart Failure . 17.3Malignant Neoplasms (cancer) . 178.4Trachea, Bronchus, & Lung. 50.6Colon, Rectum, & Anus. 16.9Female Breast . 22.9Prostate . 23.5Pancreas. 10.8Leukemia . 7.0Non-Hodgkin’s Lymphoma . 6.5Cerebrovascular Disease . 45.1Chronic Lower Respiratory Disease . 42.4Accidents . 41.0Motor Vehicle Accidents . 14.6Alzheimer’s Disease . 22.7Diabetes Mellitus . 23.7Influenza & Pneumonia . 17.5Intentional Self-Harm (suicide) . 11.5Chronic Liver Disease and Cirrhosis . 9.7Infant Mortality . 6.75Notes:1 Only one year of U.S. data are given to compare with five years of state and county data because the numbers on the national level are much greater and do not fluctuate as much annually.2 The U.S. percent of mothers receiving care in 1st trimester is based on 22 states that were using the 2003 standard birth certificate, including South Dakota.3 Data for mothers who used tobacco while pregnant are self-reported. The U.S. percent of mothers who used tobacco is based on 21 states using the 2003 standard birth certificate, including South Dakota.4 Teenage pregnancy rate is live births, fetal deaths, and abortions per 1,000 females age 15-17. The U.S. teenage pregnancy rate is from 2005.5 The mortality rates, except infant mortality are age-adjusted death rates per 100,000 population. Age-adjusting to the standard million population eliminates differences between populations, making them easier to compare. Infant mortality is calculated as the number of infant (less than oneyear old) deaths per 1,000 live births.** Atherosclerotic Heart Disease I25.1 was not broken out in the national data; therefore no age-adjusted rate is displayed.Source: National Center for Health Statistics, Centers for Disease Control and Prevention, U.S. Department of Health and Human Services, Hyattsville, Maryland.122
South DakotaDemographic InformationHealth Status Indicators12005-2009Natality Percent Low Birth Weight Infants . 6.6%*Percent of Mothers ReceivingCare in 1st Trimester . 71.2%*Percent of Mothers WhoUsed Tobacco While Pregnant2. 18.7% Births Less Than 37 Weeks of Gestation . 8.8%*Average Age of Mother . 26.8 Teenage Pregnancy Rate3 . 19.9Mortality42000 Population InformationPopulation . 754,844Percent White . 88.7%Percent American Indian . 9.0%Percent Age 65 or Over . 14.3%Percent Age 4 or Under . 6.8%Socioeconomic IndicatorsPopulation Under 100% of Poverty. 95,900Percent of the Population . 13.2%Population Under 200% of Poverty. 240,886Percent of the Population . 33.1%1All rates based on population are calculated according to the 2000 U.S.Census.2Data for mothers who used tobacco are self-reported.3Teenage pregnancy rate is live births, fetal deaths, and abortions per 1,000females age 15-17.4All mortality rates except infant mortality are age-adjusted death ratesper 100,000 population. Infant mortality is the number of infant (lessthan one year) deaths per 1,000 live births.*Due to lack of comparable data from all 50 states, significantdifferences cannot be calculated.**Atherosclerotic Heart Disease I25.1 was not broken out in thenational data; therefore, significant differences cannot be calculated. ALL CAUSES . 802.0Heart Disease . 191.3 Acute Myocardial Infarction. 67.3**Atherosclerotic Heart Disease . 60.7 Heart Failure . 8.3 Malignant Neoplasms (cancer) . 188.1Trachea, Bronchus, & Lung . 52.6 Colon, Rectum, & Anus . 18.9Female Breast . 23.5 Prostate . 26.7Pancreas . 11.2Leukemia . 7.5Non-Hodgkin’s Lymphoma . 7.0Cerebrovascular Disease . 47.0 Chronic Lower Respiratory Diseases . 50.1 Accidents . 47.8 Motor Vehicle Accidents . 20.3 Alzheimer’s Disease . 36.3 Diabetes Mellitus . 26.9 Influenza & Pneumonia. 19.9 Intentional Self-Harm (suicide). 16.0 Chronic Liver Disease and Cirrhosis . 11.7Infant Mortality . 7.09 Denotes a health status indicator which is significantly lower thanthe national average. Denotes a health status indicator which is significantly higherthan the national average.LNE (Low Number of Events): is used because the rate or percentmay be unreliable.123Health Care ResourcesAmbulatory Surgery Center . 15Disease Intervention Office . 6Federally Qualified Health Center . 28Inpatient Chemical Dependency Facilities. 8Intermediate Care for Mentally Retarded . 1Medicare Certified End Stage Renal Dialysis . 24Rural Health Clinic . 61Community Health ServicesPublic Health Alliance . 11Community Health Services Offices . 64Family Planning Clinics. 17WIC Only Sites . 16All Women Count! . 212Bright Start Home Visitation Program . 2Children’s Special Health Services . 4HospitalsHospitals . 11Critical Access Hospitals . 37Specialized Hospitals. 12Veterans Administration Hospitals . 3Indian Health Service Hospitals . 4Long-Term CareNursing Facilities . 111Assisted Living Centers . 159Residential Living Centers . 47Home Health Agencies . 53Medicare Certified Hospices . 28Licensed Inpatient Hospices . 4See Technical Notes for more information.Source: South Dakota Department of Health, Office of Data, Statistics, andVital Records
Aurora CountyDemographic InformationHealth Status Indicators12005-2009NatalityPercent Low Birth Weight Infants . 10.8%Percent of Mothers ReceivingCare in 1st Trimester . 78.8%Percent of Mothers WhoUsed Tobacco While Pregnant2. 13.1%Births Less Than 37 Weeks of Gestation . 12.7% Average Age of Mother . 28.0Teenage Pregnancy Rate3 . LNEMortality4Aurora County is located in the south central portion ofthe state and averages 4.3 persons per square mile.2000 Population InformationPopulation . 3,058Percent White . 95.7%Percent American Indian . 2.1%Percent Age 65 or Over . 21.6%Percent Age 4 or Under . 5.7%Socioeconomic IndicatorsPopulation Under 100% of Poverty. 327Percent of the Population . 11.4%Population Under 200% of Poverty. 1,095Percent of the Population . 38.3% ALL CAUSES . 555.9 Heart Disease . 130.8 Acute Myocardial Infarction . 35.1 Atherosclerotic Heart Disease . 31.2Heart Failure . LNE Malignant Neoplasms (cancer) . 118.6 Trachea, Bronchus, & Lung . 24.5Colon, Rectum, & Anus . 28.4Female Breast . 37.3Prostate . LNEPancreas . LNELeukemia . LNENon-Hodgkin’s Lymphoma . LNECerebrovascular Disease . 33.9Chronic Lower Respiratory Diseases . 35.1 Accidents . 25.8Motor Vehicle Accidents . LNEAlzheimer’s Disease . 40.9Diabetes Mellitus . 21.9Influenza & Pneumonia . 20.3Intentional Self-Harm (suicide) . LNEChronic Liver Disease and Cirrhosis . LNEInfant Mortality . LNEHealth Care ResourcesFederally Qualified Health Center:Aurora County Clinic, PlankintonRural Health Clinic:Prairie Health Clinic, StickneyCommunity Health ServicesCommunity Health Services & WIC:Aurora County Courthouse, PlankintonAll Women Count!Aurora County Clinic, PlankintonHospitalsNoneLong-Term CareNursing Facilities:Aurora-Brule Nursing Home, White Lake . 52 bedsAssisted Living Centers:NoneResidential Living Centers:NoneHome Health Agencies:NoneMedicare Certified Hospices:None1All rates based on population are calculated according to the 2000 U.S.Census.2Data for mothers who used tobacco are self-reported.3Teenage pregnancy rate is live births, fetal deaths, and abortions per 1,000females age 15-17.4All mortality rates except infant mortality are age-adjusted death ratesper 100,000 population. Infant mortality is the number of infant (lessthan one year) deaths per 1,000 live births. Denotes a health status indicator which is significantly lower thanthe state average. Denotes a health status indicator which is significantly higherthan the state average.LNE (Low Number of Events): is used because the rate or percentmay be unreliable.124See Technical Notes for more information.Source: South Dakota Department of Health, Office of Data, Statistics,and Vital Records
Beadle CountyDemographic InformationHealth Status Indicators12005-2009NatalityPercent Low Birth Weight Infants . 8.4% Percent of Mothers ReceivingCare in 1st Trimester . 61.2%Percent of Mothers WhoUsed Tobacco While Pregnant2. 21.8%Births Less Than 37 Weeks of Gestation . 10.0% Average Age of Mother. 26.1Teenage Pregnancy Rate3 . 22.9MortalityBeadle County is located in the center of easternSouth Dakota and averages 13.5 persons persquare mile.2000 Population InformationPopulation . 17,023Percent White . 96.9%Percent American Indian . 1.3%Percent Age 65 or Over . 19.4%Percent Age 4 or Under . 5.7%Socioeconomic IndicatorsPopulation Under 100% of Poverty. 1,977Percent of the Population . 11.9%Population Under 200% of Poverty. 5,740Percent of the Population . 34.5%1All rates based on population are calculated according to the 2000 U.S.Census.2Data for mothers who used tobacco are self-reported.3Teenage pregnancy rate is live births, fetal deaths, and abortions per 1,000females age 15-17.4All mortality rates except infant mortality are age-adjusted death ratesper 100,000 population. Infant mortality is the number of infant (lessthan one year) deaths per 1,000 live births.4ALL CAUSES . 770.5Heart Disease . 187.2 Acute Myocardial Infarction . 51.9 Atherosclerotic Heart Disease . 78.6Heart Failure . 7.4Malignant Neoplasms (cancer) . 186.1Trachea, Bronchus, & Lung . 48.0Colon, Rectum, & Anus . 26.8Female Breast . 23.9Prostate . 44.2Pancreas . 9.3Leukemia . 5.6Non-Hodgkin’s Lymphoma . 10.4Cerebrovascular Disease . 50.6 Chronic Lower Respiratory Diseases . 28.3 Accidents . 30.7Motor Vehicle Accidents . 13.7 Alzheimer’s Disease . 22.7Diabetes Mellitus . 35.9Influenza & Pneumonia . 22.1Intentional Self-Harm (suicide) . 12.8Chronic Liver Disease and Cirrhosis . 5.6Infant Mortality . 7.60 Denotes a health status indicator which is significantly lower thanthe state average. Denotes a health status indicator which is significantly higherthan the state average.LNE (Low Number of Events): is used because the rate or percentmay be unreliable.Health Care ResourcesInpatient Chemical Dependency Facilities:Rediscovery Drug & Alcohol Treatment Program, HuronMedicare Certified End Stage Renal Dialysis:Huron Regional Medical Center, HuronCommunity Health ServicesCommunity Health Services & WIC:495 3rd SW, HuronFamily Planning Clinics:Women’s Health & Education Center, HuronAll Women Count!Belyea Balvin Clinic, HuronDr. Michael Becker, HuronDr. Nathan Loewen, HuronHuron Clinic, HuronTschetter & Hohm Clinic, HuronWomen’s Health & Educational Center, HuronHospitalsCritical Access Hospital:Huron Reg Med Cntr, Huron . 25 beds/10 swingLong-Term CareNursing Facilities:Huron Nursing Home, Huron . 140 bedsViolet Tschetter Memorial Home, Huron . 58 bedsAssisted Living Centers:Stoneybrook Suites, Huron . 47 bedsResidential Living Centers:Caring Hearts, Huron . 4 bedsCountry View Estates, Huron . 19 bedsHome Health Agencies:Huron Regional Medical Center HHA, HuronMedicare Certified Hospices:Huron Regional Medical Center Hospice, HuronSee Technical Notes for more information.Source: South Dakota Department of Health, Office of Data, Statistics, andVital Records125
Bennett CountyDemographic InformationHealth Status Indicators12005-2009NatalityPercent Low Birth Weight Infants . 7.1% Percent of Mothers ReceivingCare in 1st Trimester . 46.5%Percent of Mothers WhoUsed Tobacco While Pregnant2. 18.3%Births Less Than 37 Weeks of Gestation . 10.0% Average Age of Mother. 24.6Teenage Pregnancy Rate3 . 29.1Mortality4Bennett County is located on the southern borderin western South Dakota and averages 3.0 personsper square mile.2000 Population InformationPopulation . 3,574Percent White . 40.9%Percent American Indian . 58.1%Percent Age 65 or Over . 11.1%Percent Age 4 or Under . 8.9%Socioeconomic IndicatorsPopulation Under 100% of Poverty. 1,367Percent of the Population . 39.2%Population Under 200% of Poverty. 2,144Percent of the Population . 61.5%ALL CAUSES . 902.7Heart Disease . 154.5Acute Myocardial Infarction . 70.6Atherosclerotic Heart Disease . 43.8Heart Failure . LNEMalignant Neoplasms (cancer) . 184.4Trachea, Bronchus, & Lung . 39.0Colon, Rectum, & Anus . 33.9Female Breast . LNEProstate . LNEPancreas . LNELeukemia . LNENon-Hodgkin’s Lymphoma . LNECerebrovascular Disease . 39.2Chronic Lower Respiratory Diseases . 66.6Accidents . 57.5Motor Vehicle Accidents . 31.6Alzheimer’s Disease . LNEDiabetes Mellitus . 56.1Influenza & Pneumonia . 43.5Intentional Self-Harm (suicide) . LNEChronic Liver Disease and Cirrhosis . 48.0Infant Mortality . LNE1All rates based on population are calculated according to the 2000 U.S.Census.2Data for mothers who used tobacco are self-reported.3Teenage pregnancy rate is live births, fetal deaths, and abortions per 1,000females age 15-17.4All mortality rates except infant mortality are age-adjusted death ratesper 100,000 population. Infant mortality is the number of infant (lessthan one year) deaths per 1,000 live births. Denotes a health status indicator which is significantly lower thanthe state average. Denotes a health status indicator which is significantly higherthan the state average.LNE (Low Number of Events): is used because the rate or percentmay be unreliable.126Health Care ResourcesFederally Qualified Health Center:Bennett County Community Health Center, MartinRural Health Clinic:Main Street Medical Clinic, MartinCommunity Health ServicesCommunity Health Services, WIC & FamilyPlanning: Bennett County Courthouse, MartinAll Women Count!Bennett County Clinic Horizon Health, MartinMain Street Medical Clinic, MartinHospitalsCritical Access Hospital:Bennett County Hospital and Nursing Home,Martin . 20 beds/10 swingLong-Term CareNursing Facilities:Bennett County Hospital and NH, Martin . 45 bedsAssisted Living Centers:Bennett County Hospital and NH, Martin . 2 bedsResidential Living Centers:NoneHome Health Agencies:Bennett County Home Health, MartinMedicare Certified Hospices:NoneSee Technical Notes for more information.Source: South Dakota Department of Health, Office of Data, Statistics,and Vital Records
Bon Homme CountyDemographic InformationHealth Status Indicators12005-2009NatalityPercent Low Birth Weight Infants . 5.5%Percent of Mothers ReceivingCare in 1st Trimester . 78.3%Percent of Mothers WhoUsed Tobacco While Pregnant2. 19.1% Births Less Than 37 Weeks of Gestation . 4.9% Average Age of Mother . 27.6 Teenage Pregnancy Rate3 . 5.8Mortality4 ALL CAUSES. 680.9Bon Homme County is located on the Nebraska borderin eastern South Dakota and averages 12.9 persons persquare mile.2000 Population InformationPopulation . 7,260Percent White . 95.5%Percent American Indian . 3.3%Percent Age 65 or Over . 20.8%Percent Age 4 or Under . 4.9%Socioeconomic IndicatorsPopulation Under 100% of Poverty. 802Percent of the Population . 12.9%Population Under 200% of Poverty. 2,274Percent of the Population . 36.5%Heart Disease . 183.4Acute Myocardial Infarction . 65.8Atherosclerotic Heart Disease . 71.2Heart Failure . 5.2Malignant Neoplasms (cancer) . 183.0Trachea, Bronchus, & Lung . 61.5Colon, Rectum, & Anus . 22.2Female Breast . 17.1Prostate . 19.1Pancreas . 13.9Leukemia . 8.5Non-Hodgkin’s Lymphoma . 7.9Cerebrovascular Disease . 47.0Chronic Lower Respiratory Diseases . 35.9Accidents . 43.9Motor Vehicle Accidents . 24.3 Alzheimer’s Disease . 17.3Diabetes Mellitus . 36.8Influenza & Pneumonia . 12.1Intentional Self-Harm (suicide) . LNEChronic Liver Disease and Cirrhosis . LNEInfant Mortality . LNEHealth Care ResourcesRural Health Clinic:Bon Homme Family Practice, AvonBon Homme Family Practice, TyndallCommunity Health ServicesCommunity Health Services, WIC & FamilyPlanning: Bon Homme County Courthouse, TyndallAll Women Count!Avera Bon Homme Family Practice, AvonSpringfield Family Clinic, SpringfieldBon Homme Family Practice Clinic, TyndallLandmann-Jungman Memorial Hospital, ScotlandScotland Medical Clinic, ScotlandHospitalsCritical Access Hospitals:Landmann-Jungman Memorial Hospital,Scotland . 25 beds/10 swingSt. Michael’s Hospital, Tyndall . 25 beds/15 swingLong-Term CareNursing Facilities:Good Samaritan Society, Scotland . 39 bedsGood Samaritan Society, Tyndall . 71 bedsSt. Michael’s Nursing Home, Tyndall . 9 bedsAssisted Living Centers:Good Samaritan Society, Scotland . 8 bedsSpringfield ALC, Springfield . 36 bedsResidential Living Centers:None1All rates based on population are calculated according to the 2000 U.S.Census.2Data for mothers who used tobacco are self-reported.3Teenage pregnancy rate is live births, fetal deaths, and abortions per 1,000females age 15-17.4All mortality rates except infant mortality are age-adjusted death ratesper 100,000 population. Infant mortality is the number of infant (lessthan one year) deaths per 1,000 live births. Denotes a health status indicator which is significantly lower thanthe state average. Denotes a health status indicator which is significantly higherthan the state average.LNE (Low Number of Events): is used because the rate or percentmay be unreliable.Home Health Agencies:Scotland Area Home Care Agency, ScotlandSt. Michael’s Home Health, TyndallMedicare Certified Hospices:Scotland Area Hos
Inpatient Chemical Dependency Facilities: Rediscovery Drug & Alcohol Treatment Program, Huron Medicare Certified End Stage Renal Dialysis: Huron Regional Medical Center, Huron Community Health Services Community Health Services & WIC: 495 3rd SW, Huron Women's Health & Education Center, Huron All Women Count! Belyea Balvin Clinic, Huron
