Transcription
Armanshahr Architecture & Urban Development, 6(10), 253-266, Spring Summer 2013ISSN: 2008-5079Functional Evaluation of Mazandaran Province Cities Using Factor Analysis,Numerical Taxonomy and Cluster Analysis*Shima Dadfar1**, Naser Azimi2 and Hasan Ahmadi31Master of Urban & Regional Planning, Faculty of Art & Artitecture, Islamic Azad University, Tehran CentralUniversity, Tehran Central Branch, Tehran, Iran.2Assistent Professor of Urban Planning, Faculty of Art & Artitecture, Islamic Azad University, Tehran CentralBranch, Tehran, Iran.3Assistent Professor of Urban & Regional Planning, Faculty of Art & Artitecture, University of Guilan, Guilan,Iran.Received 17 April 2013;Revised 30 April 2013;Accepted 29 July 2013ABSTRACT: One priority of planning at the regional level is to recognize the system of residenceand particularly its urban system. One of the features of urban system in each area or country is theway of population distribution between the cities of these areas which is called city distribution size.In functional analysis of Mazandaran province 41 development indexes of educational, cultural, social,demographic, economic, health and agricultural fields were selected, then by using factor analysis throughSPSS Software, these factors were decreased into 6 main indexes and finally consolidated indexes wereextracted. Then, these six factors were used as the inputs of taxonomy analysis in Excel, and the scores ofcities which were valued between 0 -1 were obtained. Finally, in order to classify Mazandaran provincecities by using cluster analyses, SPSS and Taxonomy scores, all of the cities were classified into 6 levels.To present the results graphically, GIS software was used to present a map entitled “Map of Mazandaranprovince cities classification”. Results indicate that Sari as the center of Mazandaran has located in level 1and Amol, Babol and Qaemshahr as three most populous areas have also located in level 2. At the end ofthe article according to the physical plan of northern coastal region, related suggestions on setting optimaland well-balanced urban system have been proposed.Keywords: Urban System, Factor Analysis, Taxonomy Analysis, Cluster Analysis, Mazandaran Province.functional integration within the area and on the otherhand it contributes to the creation of unity. Therefore it isexpected that by analyzing the urban system of each areain the country, the nature of interactions and the powerof existing services of regional centers and other citiescan be recognized. Moreover, by applying these analysesthe existence, unity and integration of regions will bepredictable.If this system is balanced in a way that population andfacilities are distributed suitably according to all social,economic and political factors, it can be claimed thatwe’ve became close to achieve social justice. In the otherwords, the division of tasks between urban centers withregular system can facilitate the spatial development ofsocial and economic conditions of our country.Mazandaran province with its distinct climatic andINTRODUCTIONUrban system is one of the issues that besidesidentifying the various functional levels of city centerscan specify functional areas. According to the nature ofurban systems, there are hierarchies of different citiesin every area in which one or two regional center areplaying local and regional roles. This center provides topurban services for area’s internal cities at the regionallevel. At the national level it can interact with othercenters around the country. So on the one hand it causes* this article has been extracted from Master thesis of Shima Dadfarentitled «Analysis of Mazandaran Urban Systems».** Corresponding author email: dadfar.ur@gmail.com253
Dadfar, S. et al.physiographic conditions has significant geographicaldifferences from West to the East. the pattern of urbandevelopment, following the geographical space generallyhave evolved alongside connecting point of rivers andcommunication networks on alluvial and coastal plains.Continuous physical formation and development of theurban fabrics is not equal in all parts of the province. Thefour main cities of Mazandaran (Sary, Ghaemshahr, Amoland Babol) while maintaining their positions in the recentcensus, have formed the framework of metropolitancontext in regional space.There are a variety of methods and models forstudying urban systems such as: rank-size model, firsturban indexes, Herfindal decentralization index andthe functional analysis methods such as factor analysisand taxonomy analysis. In this study, the method offunctional analysis has been applied. In this method, thedistribution of services across the region and the citiesare classified in terms of their performances. SPSS, Exceland GIS software and three methods of factor analysis,cluster analysis and taxonomy analysis have been appliedsimultaneously.by population, products and informational trends andmade their overall system, dynamic (Short, 1984, 210).Urban Network: Studying of urban network as “agroup of interdependent cities” has become particularimportant during the twentieth century in national andregional planning. Actually it is unclear when and howthis term was entered in the literature of urban planningof Iran. Possibly “urban network” is a distraction from theFrench word of “Armature Urban” which has used widelyin land preparation of French. The most familiar Englishword is “urban network” (Azimi, 2003).Urban network often refers to the system of externalcommunications of cities with each other and itsborders expand along with development of technology,transportation and communications. Urban networkshapes through trade, cultural, political, religiousinteractions and exchange of experiences and cooperation(Shokooei, 2004).RESEARCH BACKGROUNDUrban systems (urban networks and hierarchies) andthe distribution size of settlements are important topicsas many researches and studies have been conducted.Auerbach (1913) was the first researcher who studiedWest German urban settlements. Discovering the converserelationship between the population and its place in urbansystem, he proposed the term “rank-size”. Zipf in 1949,Richardson in 1973, Hagt in 1972 and Meyer in 1981made some revisions and corrections on the model andtried to improve its effectiveness wh i le there are someother important studies done by scientists such as Ltka(1924), Gvdrykh (1926), Singer (1936) , Brian Barry(1961) and Su (2002).Different studies in this field have been conductedin Iran such as follows. Azimi (2002) in his book“Investigating the urbanization and Principles ofurban systems” has introduced and criticized the mainpatterns of urban system. He believes that surpluseconomic concentration on a specific location leads toactivity concentration, employment and attracting morepopulation and therefore a city can be known as anoutcome of economic sociability. Surplus concentrationand producing and extraction in cities are elements ofurban development.Maleki and Hosseinzadeh (2009) in an article ratedthe fourteen districts of Ilam urban areas in terms ofsustainable development indexes. They used factor andtaxonomy analysis in their study. Based on the resultsof the article two regions were semi-stable, twelve areaswere unstable and none of the regions were stable.LITERATURE REVIEWSystem: The term “system” has its meaning in alltypes of research and disciplined learning. It has enteredthe social sciences from exact sciences especiallyphysics. Hall believes that system is a set of componentswith interlocking elements and goals and relationshipsbetween attributes of elements, including the externalinfluence by which the component has known, seen, orintroduced. It should be mentioned that the relationshipbetween components and features, ties system together(Reif, 1973).Urban System: Urban system consists of a setof interdependent cities which create the structure ofurban settlements in an area, region, country and theworld. Urban system is not limited only to the physicalbuilding of urban settlements but also covers flows andcommunication between them. These flows includeflow of population, capital, production factors, ideas,information and innovations. These systems are opensystems that revising them requires investigation of theirextensive relations with environment. These systemsconstantly adapt themselves to the structural changesof cities and their external connections (Azimi, 2002).Simon has identified two main elements of the urbansystem as follow: parts and connections between them(Simmons, 1978). John René Short defines urban systemsas a set of different cities which are linked to each other254
Armanshahr Architecture & Urban Development, 6(10), 253-266, Spring Summer 2013Mousavi and Hekmatnia (2005) in an article titled“Functional Analysis and indexes synthesis to determinethe factors affecting human development in regions ofIran” have rated 253 districts of Iran by applying thefactor analysis for 38 indexes of human development.Then, they have decreased indexes to 6. In ranking theregions of Iran they have introduced 25 intra-developedregions, 77 high semi-developed regions, 73 low semideveloped regions and 78 deprived areas. Through aregression relationship between the factors and thedegree of development, they provided the plans andinvestment priorities for each region in relation to factorsand indexes.Ebrahimzadeh et al., (2010) in an article entitled“Application of factor analysis, explaining the spatialpattern of urban-regional development in Iran” examinedthe level of development of all Iran cities based onpolitical administrative division of the country. Theyclassified all the cities into four groups titled: developed,high semi-developed, less-developed and deprived areas.Their findings indicate that conditions of provincesof Tehran, Isfahan and Yazd are the most desirable inmost of development factors and Sistan-Baluchestan,Kurdistan, South Khorasan, Kermanshah, and Khuzestanhave the most unfavorable conditions. In their study 32developed, 76 high semi-developed, 126 less-developedand 106 deprived cities were identified.In general, many studies in the field of urban systems(metropolitan and hierarchy network) have been conductedwithin and outside the country, either as a book or essayor article. They have investigated urban and settlementssystems from different perspectives. The present studyutilizes the results of these studies to analyze the factorsaffecting the urban system of Mazandaran province.the cluster analysis, using taxonomic method output datathe SPSS software prioritized cities (Adapted from: Shali& Razavi, 2010) and finally by using GIS software thedistribution of these cities were presented.METHODOLOGYFactor analysis is a generic name for some statisticalmethods of multivariate which main purpose is tosummarize a large number of information, while thesummarized results is a meaningful concept at the sametime. The factor analysis has different applications but inGeographical studies R-type factor analysis is used to rateareas, towns and villages. It this paper the R-type factoranalysis process is outlined (Hekmatnia & Mousavi,2011).INDEX SELECTION AND CONVERSIONOF INDEXES TO HOMOGENEOUSINDEXESIn this study, the mixture of economic, social, cultural,educational, health, agricultural, tourism, etc. indexesare used. The combined index can illustrate the level ofwelfare and development of geographic locations basedon selected criteria (Hekmat nia & Mousavi, 2011). Theselected indexes in this paper has been selected firstlyregarding to similar studies, Iranian economic activitiesclassification (ISIC codes received from the StatisticalCenter of Iran) and at the second stage regarding to thecity's performance. Then the necessary data gained fromthe statistical Center of Iran and indexs of appendix 1were used to identify Mazandaran's cities performances.Since the implemented indices do not have the sharedscales, adding this index with different scales is not possibleand it is essential to converse them to the standard unit.Therefore, at first, it is necessary that the selected indicesconverse to single index and empty of any scale. In thispaper, from all methods of making scale-free index, themethod of indexing was used. Maximum value of eachindex, 100 (or 1), is considered and other values arecalculated regarding to proportionality. In this method theoriginal values will not change and the obtained differentcoefficient is the same as the main one (Kalantary, 2009).FACTOR ANALYSISIn the present study, because of mutual andintegrated interaction between components as well as thesubject, descriptive and analytical methods were usedsimultaneously. The location of this study is Mazandaranprovince between 1956 -2011 and the statistic populationof the study is cities in this province.In this research, three methods of factor analysis,numerical taxonomy and cluster analysis were used forfunctional analysis of Mazandaran’s cities. To provide abetter hierarchical pattern with less and better indexes,using the SPSS software in factor analysis, the numberof main indexes has been decreased to 6. After factoranalysis to obtain factor scores, these scores were usedas input for taxonomic approach in Excel. Then throughNUMERICAL TAXONOMY MODELAnalysis method of taxonomy is one of the commonmethods in the evaluation of level of development of theareas or points, and grouping them in homogeneous setswhich was recommended in 1968 by UNESCO to assess255
Functional Analysis in Mazandaran Citiesthe development level of the countries.In this method, usually one of the parts of the studiedregion is selected and other areas will be rated based onthis. So the difference or distance between each zone ofthe area is determined from the ideal point (Kalantari,2009).2011).DISTRIBUTION OF THE POPULATIONOF MAZANDARAN’S CITIESIn the Census of 2011 in Mazandaran province has19 cities, 53 towns, and 122 villages. In this period therewas a city with more than 250,000 inhabitants in thisprovenance (Sari). 54 percent of cities in the province hasa population of less than 10 thousand (i.e. urban village)located less than 8 percent of the population in province.Most of the population of the province related to theclass with the population of 100-250 thousand peoplewhich includes 40 percent of the province population.The population of cities and towns in the province ofMazandaran is presented in appendix 2 (Statistical Centerof Iran, population and housing census, 2011).CLUSTER ANALYSISA cluster analysis is one of the most popular methodsin regional geographic studies. In fact, this is a method forclassifying regions, towns, villages, etc while the regionsin the same class are fairly similar but so different fromother classes. Classification of homogeneous locations inthis method is done by different techniques.Determining the correlation coefficient andmeasuring the distance (Euclidean distance) is one of themost important methods of determining homogeneouslocations.A cluster analysis is done by two ways of nonhierarchical and hierarchical cluster analysis. In this paperthe hierarchical cluster method is used which is fitted forgeographic studies (Hekmatnia & Mousavi, 2011).In a hierarchical cluster method, each locationstarts with a specific cluster, then the two locations arecombined to make a new cluster. So at each step thenumber of clusters will be decreased. By continuing thisprocess, gradually all location combine with each otherand eventually emerge a greater cluster. To calculate thismethod SPSS software is used (Hekmatnia & Mousavi,RESEARCH FINDINGSFactor GeneratingIn this study, the variance explained by all factors wasmore than 70 percent, which means the first condition ofFactor Generating has met. Also, as noted in table 1, thevalue of kmo index is 0.671 and more than 0.5.It meansthat the data are suitable for performing factor analysis.The value of the Bartlett is also equal to zero whichindicates a significant correlation between variables.Table 1. Bartlett Test and KMO IndexKMO an d Bartlett's TestKaiser-Mey er-Olkin Measure of SamplingAdequacy .Bart let t's Test ofSphericityApprox. Chi-SquaredfSig.The first matrix of factor analysis is primarycomputation matrix which includes a list of variables,their subscribers, special values (including ANOVA),the percentage of the variance of each factor and totalcumulative percentage of all variances. According tothe computed primary matrix, all variables have beensummarized in 6 factors which explain over 90% of thevariances.671952.312210.000The first factor has been clarified around 42.34percent of the total variance of the set. Other factorshave explained 17.29, 13.97, 7.2, 4.93, and 4.57% of theindexes’ variance. In addition to this, the total varianceexplained by the set of these 6 factors equals to 90.32%.The results have been presented in table 2.256
Armanshahr Architecture & Urban Development, 6(10), 253-266, Spring Summer 2013Table 2. Percentage of the Variance and Special Values for Different FactorsComponentRotation Sums of Squared LoadingsTotal% of VarianceCumulative 790.325Operators And Helping Tourists Who Is Not ClassifiedIn Another Place, 15. Veterinary Medicine Activities,16. Hotel, 17. The Number Of Firefighting Stations, 18.Newspaper, Weeklies, Etc. 19. Primary Education, 20.Ground Transportation Companies, 21. Health Center,22. Loading And Unloading Firms, 23. Activities OfClinics And Health Centers, Except Hospitals, 24. SportActivities, 25. Store And Warehouse Companies. The second factor: special value of this factor is6.39 and is able to explain 17.29 percent of thevariance. In this factor 7 index have been loadedas following:1. Sport Activities, 2. Ready-Food ProductionActivities 3. Banking, Except For The Central Bank,4. Livestock, 5. Producing and Storing Fruits AndVegetables, 6. Livestock and Poultry Slaughter, 7.Veterinary Activities The third factor: special value of this factoris 13.97 and is able to explain 5.169 percent ofthe variance. In this factor 10 index have beenloaded as following:1. Firefighting Station, Number, 2. Newspapers,Weeklies and Etc, 3. Ground Transportation Companies4. Helth Home 5. Loading and Unloading Firms, 6.Livestock and Poultry Slaughter, 7. Store and WarehouseCompanies, 8. Passenger Services Agency 9. ActivityRelated to the Assignment of Land, 10. Activities ofArchitectural, Engineering and Related TechnicalConsultancy. The fourth factor: In this factor with specialvalue of 2.67 and 7.209 percent of variance twoitems of 1. loading and unloading companies and2. The numbers of restaurants have been loaded. The fifth factor: this factor with special valueof 1.83 and 4.93 percent of variance includesRotated MatrixThis matrix is the same as factor matrix which itsfactors have been extracted through the method ofdecomposition into main components and have beenrotated using technique of Varimax rotation. In otherwords, because of the difficulty in explaining the factorloading coefficient in factor matrix (of which manyvariables or indexes have average correlations with severalitems) we can use rotated matrix to detect communicationand correlations and clear this communications for finalanalysis of factors. Results of this matrix, have presentedin Appendix 3. These coefficients are very important foranalyzing in the next stages and calculating the factorscores of cities.Interpretation of FactorsRegarding the correlation of each index, the rightnames or titles can be fitted to any of them as following: The First factor: special value of this factoris 15.667 and is able to calculate and explain42.34 percent of the variance. In this factor themaximum numbers of indexes which are 25indexes have been loaded as following.1. Guest House, Motel, Etc., 2. The Number ofLicensed Construction Permits, 3. Planting DecorativePlants, 4. Poultry Farming, 5. Publication Services, 6.Production of Ready-Foods, 7. Cultural, 8. (Cinemasand Museums, Etc.). Medical and Dental Offices’Activities, 9. The Relative Density Of The Population,10. The Activities Of Real State And Land On TheBasis Of Wage Or Contract, 11. Hospital Activities,12. Communication Activity Consists Of Posts AndTelecommunications (Public And Private), 13. HigherEducation, 14. Activities Of Travel Agencies And Tour257
Dadfar, S. et al. three indexes of: 1.processing and preservationof fruits and vegetables, 2. meat companies3.activities related to the transfer of land havebeen loaded.The sixth factor: this factor with special value of 1.69 and a variance of 4.58 indices: 1. activitiesof architectural, engineering and related technicalconsultancy. 2. activities of bus (ziyary, 1999).which has gained after multiplying factor score by thehomogeneous index.By calculating this matrix, the rate-score of each cityregarding to each factor can be identified. Then, using acluster analysis, classification of municipal centers can beachieved. In Appendix 4 the values of these scores areprovided.Analysis of TaxonomyMatrix of Factor ScoresScores of the factors gained from the result of factoranalysis, were used as the input of taxonomy and thereforethe defect of correlation between indexes was fixed(extracted from Shali, 2010). The result of taxonomyanalysis has been shown in table 3.This step involves calculating the factor scoresmatrix. This matrix is obtained from multiplication ofhomogeneous coefficients matrix by rated factor matrix.In the other words, the factor scores is numeral weightof each habitat points (investigated municipal centers)Table 3. The Results of the Taxonomy etalem & 0.68525Khalil oohi 532Salmanshahr0.9525258
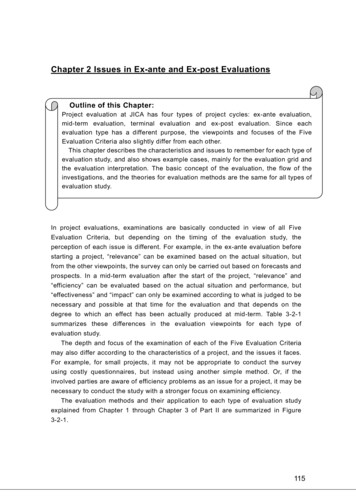
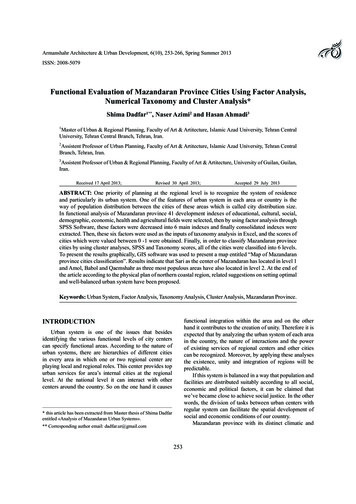
Armanshahr Architecture & Urban Development, 6(10), 253-266, Spring Summer 2013Cluster Analysis and Leveling of Citiescluster analysis, all of cities of province were clustered,and cities were classified in 6 levels. The results of thecluster analysis are presented in Table 4.After taxonomy analysis, the results again weretransferred into SPSS software and through hierarchicalTable 4. Leveling of Mazandaran Province Cities Resulted from Cluster hrood6Babol2Galoogah4Khalil arood6Behshahr3Fereidoonkenar 5 Kiakala6Kalebast6Neka3Ketalem Galoogah(Babol)Koohi KhilDaboodashtBaladeh6666Results of clustering Mazandaran province cities byGIS, is presented in map number1.It is obvious that most of towns and cities especiallycities in the first and second levels affected by natural andcommunicational factors are located in central and eastareas of the province.259
Functional Analysis in Mazandaran CitiesFig. 1. Functional Classification of Mazandaran Provincelevel of service is at the first level. In the second level,there are regional urban centers (centers of large cities)that can compete with the first level. The three mostpopulous cities of Amol, Babol and Ghaemshahr arelocated at this level. In the third level, the smaller urbancenters such as towns around bigger cities are locatedsuch as Neka, Behshahr, Babolsar, Boshahr, Chaloosand Tonekabon which link the urban network to lowerlevels. The fourth level includes cities of Ramsar,Mahmoudabad, Amirkala, Nour and Galougah and aswell the rest of cities are located in fifth and sixth levels.The remarkable point in the sixth level is the existenceof 23 cities from all 53 cities of Mazandaran which ismore than 43 percent of the province’s cities. It showslack of any effective attention to their characteristics inshifting them into towns. Another point is that some ofthese cities have a long history to become the city suchas Khorramabad, Polsefid, Marzanabad, Salmanshahr,Rhine, Shirgah and Nashtarood which became city before1971 (the official Portal of the Ministry) but due to somerestrictions, including lack of access to the main road, orCONCLUSIONS AND SUGGESTIONSIn this study, settlements of Mazandaran province interms of size and location selection; variety of servicesand facilities, infrastructures and productive activities(based on the number and types of performance) havebeen investigated to find out the spatial distribution ofperformances in that area. Using 41 indexes of healtheconomic, agricultural, educational, cultural, tourism,etc; 47 cities from 53 cities (including available statisticsinformation) of Mazandaran province were prioritized interms of their performances, using a combined methodsof factor analysis, numerical and cluster taxonomy to 6levels.Using factor analysis, 41 specified indexes werereduced to 6 main indexes, then this 6 factors wereconverted to a scale with 0-1 scores by taxonomymethod, and finally using a hierarchical cluster analysisthe Mazandaran’s cities were classified to 6 main levelsas follows:City of Sary as the center of province with the highest260
Armanshahr Architecture & Urban Development, 6(10), 253-266, Spring Summer 2013natural factors have not developed and well fitted.At the end, according to the reginal documents andprojects like the physical plan of the coastal region ofNorthern and province preparation project the followingsuggestions are provided:1- Adopting policies to create balance in theurban network of the province through developmentof small urban centers to reduce population andcapital centralizations in large cities. In fact, creatinginfrastructures and active markets; well fitted networkaccess according to the hierarchy and the size ofsettlements in order to cost reduction and available accessand communication; positioning the small and mediumindustrial centers and providing their resources, are somemethods for strengthening small towns.2. In order to reduce the cost of building infrastructuresin small towns regarding to increased construction andland population density, some agricultural and the naturalreserved land should be preserved.3-According to the topography and climateconditions of Mazandaran and existence of numerousvillage center, urban village and the multiplicity anddispersion of cities and towns in the province, creating anew urban center is not a necessity. So it is recommendedthat instead of increasing the number of new cities andconverting villages into towns, existing urban centersshould be developed. The number of cities in lower levelsin comparision with the upper levels in regional urbansystem, is too high. Hence it is necessary to avoid therecent flow of shifting towns to cities, at least in this area.261
Dadfar, S. et al.AppendixesAppendix 1. Used Indexes in Functional Analysis of Mazandaran’s CitiesNo.IndexNo. Index1Hospital Activities22Publication and Book Activities2Newspaper Offices23Therapeutic and Hygienic Centers ActivitiesExcept Hospitals3Sport Activities24Medical And Dental Offices’ Activities4Cultural Activities (Museum, Cinema, )25Veterinary Medicine Activities5Banking Activities26Social Work Activities6Activities Related To The Assignment OfLand27Health Houses7The Activities Of Real State And Land28Primary Education8Activities Of Architectural, Engineering AndRelated Technical Consultancy29Higher Education9The Number Of Licensed ConstructionPermits30Research and Development in Engineeringand Natural Sciences10Ready Food Production Activities31Communication Activity Consists Of PostsAnd Telecommunications (Public AndPrivate)11Producing And Storing Fruits AndVegetables32Firefighting Stations12Animal Husbandry33The relative density of population13Planting Decorative Plants34Ground Transportation Companies14Meat Companies35Loading And Unloading Firms15Poultry Farming36Store And Warehouse Companies16Livestock And Poultry Slaughter37Hotel17Meat Products Activities38Guest House, Motel,.18Vegetable oils Production Activities39Restaurant19Dairy Products Activities40Bus Activities20Activities Related to Rice Production41Travel Agency Activities21Activities Of Travel Agencies And TourOperators And Helping Tourists Who Is NotClassified In Another Place262
Armanshahr Architecture & Urban Development, 6(10), 253-266, Spring Summer 2013Appendix 2. Mazandaran Province’s Cities Population in Censuses 2011RankOfCityCityPopulationof City at2011RankOfCityCityPopulationof City at2011RankOfCityCityPopulationof City l219,91520Abbasabad11,59938Marzan d5,6424Ghaem Shahr196,05022Chamestan10,61740Kola Bast4,0975Beh Shahr89,25123Shirud10,42941Khosh Rud Pey3,3176Neka50,68024Khalil lugah(babol)2,6439Tonekabon45,33827Surk8,93045Kuhi deh1,03712Ramsar32,29430Pole Sefid7,70848Alasht87413MahmoodAbad31,77131Kia Marzikola55515Amirk
numerical taxonomy and cluster analysis were used for functional analysis of Mazandaran's cities. To provide a better hierarchical pattern with less and better indexes, using the SPSS software in factor analysis, the number of main indexes has been decreased to 6. After factor analysis to obtain factor scores, these scores were used