Transcription
342902.qxd5/30/072:22 PMPage 232Revealing the Secrets ofMicrosoft ProjectTo know that one has a secret is to know half the secret itself.—Henry Ward BeecherTopics Covered in This ChapterRecognizing the Underlying Rules of ProjectUnderstanding the Project Data StructureUsing Primary Project Data FieldsProject Behavior and DefinitionsNavigating Project and Some Quick TipsThe Major Project ViewsWhat Are Project Tables?Practice: Navigating and Using Project ViewsSummaryThis chapter reveals most of the secrets of Project. If you have tried using thetool and do not know its secrets, you might think it has a mind of its own.Perhaps you have been frustrated when it changes the duration when youadded a resource on a task. You might have entered work hours on a task,then find that Project changed the number of units (the percentage of theresource’s assignment) a person is working on a task. This chapter describesthe secrets up front, which many books on Project neglect to do. If you learnabout the secrets immediately, you might be more likely to accept themethodology suggested in this book, or at least know that when you addedthe resource to the task why it changes the duration.To help reveal the secrets, I first describe the Project data structure, the mostimportant fields in the data structure, some of the rules and formulas thatexist in the data structure that affect how the schedule behaves, some tipsfor using the tool efficiently, and some of the views you can use to see the23
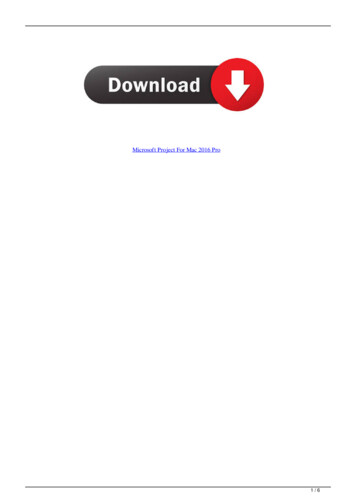
342902.qxd245/30/072:22 PMPage 24Chapter 2data in ways that allow you to understand Project’s behaviors. The beginningof the chapter is designed to introduce concepts, and is not meant as a guideto get around in Project. I then introduce simple navigation concepts. Thechapter ends with practices to give you a feel for using the features and interfaces, called views, that expose the Project data structure and allow you tolook at the data in various ways. You will not have a case study, as this is moreabout the features in the tool than the methodology of building a schedule.Recognizing the Underlying Rules of ProjectAs discussed in Chapter 1 “Introducing Microsoft Office Project” many people start using Project and expect it to act as a spreadsheet. They enter information on a task—such as a date in the Start field—which puts a constraintof “Start No Earlier Than” on the task as shown in Figure 2.1. The figureshows how a constraint is added as soon as a user typed in a date in the Startfield (of 1/8/07). I define constraints in Chapter 4,“Understanding Task Information,” but for now, understand that just by typing in the date, the usercaused a behavior in Project that many people don’t even notice until laterwhen the schedule starts behaving in a way they don’t expect. Just by entering a start date, Project assumes that you now want to make sure that thisparticular task cannot start prior to the date you filled in, even if you laterfind out you could start it earlier.Project icon indicating that a constraint has been added to the taskTool tip describing the constraintFigure 2.1Constraint set by Project when you enter a date in the Start fieldThis behavior is part of the Microsoft Project scheduling engine, a verysophisticated set of rules about the way a schedule should behave, based onfundamental project management scheduling techniques. That’s why the toolis complex: The rules are not apparent. Project is an application that someone has programmed, and if you don’t understand some of the underlyingprogramming, you might be dismayed by the tool’s behavior. I tell students
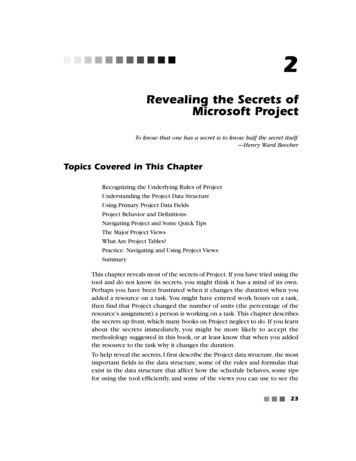
342902.qxd5/30/072:22 PMPage 25Revealing the Secrets of Microsoft Project25that no matter what they think, Project is behaving according to very logicaland proper scheduling behavior even if it might not be what they want it todo. In using this tool, you need to understand its rules to either change someof the defaults that create the rules you don’t want the tool to follow or to usethe default rules to create a schedule as designed.Understanding the Project Data StructureMicrosoft Project is an application with a specific data structure that hasbeen designed with certain assumptions. What you see when you first opena project is the interface to help you input data into the Project data structure. In Figure 2.2 the interface you see is the Gantt Chart view. Notice thevertical strip on the far left side of the screen displaying Gantt Chart.Gantt Chart label on left of interfaceFigure 2.2Gantt Chart viewThe Gantt Chart view expects you to enter a task name, and if you do notenter anything specifically in the Duration, Start, and Finish fields of the row,Project will enter a duration of 1 day and the current date in the Start and
342902.qxd265/30/072:22 PMPage 26Chapter 2Finish date fields. Once you enter anything into a row (even a blank into thetask name) in the view, you have created a row of data in the Project datastructure for the task.To understand that the row in the view contains more data than can be seen,you can expose more fields for the row than what is showing in the defaultGantt Chart view. In Project, you will find the terms column and field usedinterchangeably. When you are inserting a column into any view, you areexposing a field from the Project data structure in the view you are displaying. For instance, to expose the % Complete field, you would perform the following steps:1. Highlight a column (in this case, the Duration column). The columninserted will show up to the left of the column that you highlight.2. Select Insert from the top menu bar and select Column from the drop-down list as shown in Figure 2.3.Figure 2.3Select Insert and Column to expose a data field for a task3. The Column Definition dialog box displays as shown in Figure 2.4.Click the drop-down arrow for the box. Scroll up to find % Completeand select it by clicking it.
342902.qxd5/30/072:22 PMPage 27Revealing the Secrets of Microsoft ProjectClick on the Field name drop downto see all the fields availableScroll barFigure 2.4Select % Complete from the Column Definition dialog box4. Press OK, and the % Complete column will display to the left of theDuration column as shown in Figure 2.5.Figure 2.5% Complete field now exposed in Gantt Chart view.27
342902.qxd285/30/072:22 PMPage 28Chapter 2You can select a field by typing the first character or charactersof its nameYou can easily find a field in the Column Definition dialog box dropdown list by entering the first letter or character of its name. Forinstance, if you wanted to find the Work field quickly in the drop-downlist, you can type “w” to take you to the beginning of all fields startingwith “w.” If you type “wo,” Project will take you to the first field thatbegins with “wo,” which is “Work.”You could insert column after column until you saw every field that is available to describe a task in Project. Figure 2.6 shows the % Complete,WBS, Priority,Actual Work,Work,Actual Duration,Actual Start,Actual Finish, Cost, andActual Cost fields exposed for three tasks in the Gantt Chart. So when youare working with a task row, think about all of these fields, and many, manymore actually existing in the task’s data structure, and that they could possibly have data in them even if you don’t see them in the view.Figure 2.6Several fields exposed from the data structure in the Gantt ChartNotice that each task has been given a number on the far left side and thereis data in the fields for each task. All the exposed fields have been populatedwith calculated or default data. There are hundreds of fields that are available to describe a task in Project. Some are fields just like you see in Figure2.6, with defaults, formulas, or calculations. See “Using Primary Project DataFields” later in this chapter to learn more about formulas or calculations insome of the most important fields of Project. Other fields are empty and youcan customize how you will use them. In Figure 2.7, the field called Text1 inthe Gantt Chart view allows you to enter any kind of text you would like toenter to describe the task.
342902.qxd5/30/072:22 PMPage 29Revealing the Secrets of Microsoft ProjectFigure 2.729Text1 field (column) added to view for customized data.As a general rule, don’t copy rows into other schedulesAs a general rule, unless you know exactly what you are doing, it is a nota good idea to copy a row or rows from one project schedule to another.Now that you know Project has more than 100 fields for each task, consider that you might unknowingly be copying data from one schedule toanother. As an example, if you enter 50% Complete on a task, a value isentered into the Actual Duration field. If another user copies your taskrow with a series of other tasks that she wants to duplicate in her schedule, she has just copied the Actual Duration into her schedule.If you want to remove the column (also known as hiding the column) youentered into a view, you can simply highlight the entire column by selectingthe column header, and press Del on the keyboard. You aren’t really deletingthe field from the data structure—you are merely hiding the column fromthe view. If you highlight a column and right-click it, you will see a dropdown list as well and see (among others) two options that allow you toInsert column or Delete column.Tasks, Resources, and Assignments in the Project Data StructureThere is another concept to understand about the Project data structure.The data, in general, is structured according to these categories: tasks,resources, and assignments. Tasks are the activities in the schedule. You must have tasks to build aschedule. See Chapter 3 “Building Your Schedule: Scoping Your Project” for more about creating and managing tasks in the schedule.
342902.qxd305/30/072:22 PMPage 30Chapter 2 Resources are the people, equipment, or materials available to you toperform the work on your project. Project 2007 has introduced twonew kinds of resources to help you calculate costs: cost and budgetresources. Although not resources in the strictest sense, they will helpyou include cost and budget estimates on a project. See Chapter 6“Understanding Resources and Their Effects on Tasks” for more aboutcreating and managing resources in the schedule. Assignments are specific resources assigned to specific tasks. SeeChapter 6 for more about creating and managing assignments in theschedule.Some of Project’s most important views are designed based on the idea thateach of these categories has particular kinds of data that are typically associated with it. For instance, tasks can have a duration but resources can’t. Youcannot add the Duration field in a view that is designed to describe resourceinformation. An assignment is a resource or resources added on a task soassignment views will contain data about the resource’s work on the task.Project also has settings that affect how each of these categories will behave.The following example illustrates how each category is associated withviews in Project.The Gantt Chart view is designed as an interface into the task data structureof the Project for you to enter information about the task. In Figure 2.8 yousee a row for a task (Task 1) in the Gantt Chart view. If you hover over theInformation icon (it looks like a file folder), a tool tip called Task Informationappears.Tool tip exposed when hovering over an iconInformation iconFigure 2.8Icon selected showing Task Information
342902.qxd5/30/072:22 PMPage 31Revealing the Secrets of Microsoft Project31When you click on the icon, the Task Information dialog box displays, asshown in Figure 2.9. You can enter or review more information about a taskthan what is available in the Gantt Chart view. However, there are many morefields in the data structure relating to tasks. You could also insert any of thefields showing in the Task Information dialog box in the Gantt Chart view.Figure 2.9Task Information dialog boxThe main view for entering information about resources is called theResource Sheet. This view’s main function is to describe the major attributeof the resources on your project. Notice that the exact same Informationicon shown in Figure 2.9 is shown in this resource view. However, if youhover over the same icon, the tool tip displays Resource Information asshown in Figure 2.10.Tool tip exposed when hovering over iconInformation iconFigure 2.10Icon selected showing Resource Information
342902.qxd325/30/072:22 PMPage 32Chapter 2If you click on the icon, you will see the Resource Information dialog box, asshown in Figure 2.11. This dialog box allows you to enter or review additional data about a resource that does not display in the Resource Sheet view.Figure 2.11Resource Information dialog boxOne of the major views for reviewing information about assignments is theResource Usage view. This view’s main function is to show how the work isassigned to the task once you have assigned a resource to the task. Onceagain, the Information icon looks the same as that used for tasks andresources, but it is associated with the assignment as shown in Figure 2.12.Tool tip exposed when hovering over iconInformation iconFigure 2.12Icon selected showing assignment information
342902.qxd5/30/072:22 PMPage 33Revealing the Secrets of Microsoft Project33As you can see, when you click on the icon, the Assignment Information dialog box displays as shown in Figure 2.13. Once again, the Assignment Information dialog box displays much more information about the assignmentthan is shown in the Resource Usage view, but there is more data not displayed in that view as well.Figure 2.13Assignment Information dialog boxIn summary, Project is designed to capture and display information abouttasks, resources, and assignments. Data is associated with each of these categories of data, and there are fields that describe these categories of data andsettings that affect them.Using Primary Project Data FieldsIn the previous section, I described the categories the Project data structureuses, and in this section, I describe some of the most important fields andsettings in Project. At times, you can have fields (e.g., Work) that are associated with each kind of category. For instance, Work can be associated withthe following: A task to indicate the total number of hours expected for the effort ofthe task. A resource to indicate the total number of hours the resource willwork on all tasks in a project.
342902.qxd345/30/072:22 PMPage 34Chapter 2 An assignment to indicate the total number of hours a particularresource will work on just his or her portion of the task on a project.For instance, the task’s work might be 40 hours, but Resource A has anassignment for 20 work hours, and Resource B has an assignment for20 work hours.Remember that Column Definition dialog box you saw earlier when youinserted a column into a view? If you scrolled through it, you saw hundredsof fields that are available to you to describe a task (or a resource in aresource view). I don’t know any book that describes every field. If this bookdid, it would probably be hundreds of pages longer than it is. However, thereare fields in Project that are extremely important to scheduling and howProject works that are worth describing.Use Project Help to learn more about the fields you seeWhen you don’t understand a field you can use Project Help to understand what it means. You can hover your cursor over any column displaying. You will see the name of the field and a hyperlink for Help, as shownin Figure 2.14. Click the hyperlink to open the Project Help dialog boxfor the particular field as shown in Figure 2.15. You might want to inserta column to check help for it. The help information might be slightly different in each version of Project, but this feature works the same in all ofthem.Figure 2.14Tool tip on Task Name that allows you to select help
342902.qxd5/30/072:22 PMPage 35Revealing the Secrets of Microsoft ProjectFigure 2.1535Help dialog box in Project 2007 that describes the task Name fieldWhat fields are important to understand, as there are so many available? Thefollowing fields are important to scheduling and budget information produced by Project (the fields are exposed in Figure 2.16 so you can see howthey look in a project). Work: The amount of time or effort scheduled on a task or for anassignment. In the following example, work is 80 hours for both Task 1and Task 3. Duration: Total span of time to be expended on a task, from start toend date of the task. This differs from work significantly. For instance,a task might be scheduled to start on 10/8/07 and end on 10/19/07,for a total duration of 10 days. However, the amount of work or effortfor someone to complete the task may only be 40 hours. In the following example, the duration is 10 days for both Task 1 and Task 3. Cost: Amount of dollars or other currency that might be expended inperforming the task. Cost in the following example is 8,000 for bothTask 1 and Task 3. This was calculated by Project, which calculated theper hour rate of the resources on the task. You can’t see the rate in thisview, but the resources have been assigned a rate of 100 per hour.
342902.qxd365/30/072:22 PMPage 36Chapter 2 There are many interesting nuances about cost, especially actual cost.See Chapter 7 “Using Project to Enter Cost Estimates” for more information on costs.Start: Date the task and resource assignments for the task wouldbegin. Start date for Task 1 in the following example is Monday,10/8/07.Finish: Date the task and resource assignments for the task wouldend. The Finish date for Task 1 in the following example is Friday,10/19/07.Predecessors: Task or tasks (shown by ID number) that come beforea task can start or finish. The predecessor for Task 2 is Task 1 and thepredecessor for Task 3 is Task 2 in the following example. Of course,the first task does not have any task coming before it, so it has no predecessor.Successors: Task or tasks (shown by ID number) that start or finishafter a task starts or finishes. The successor for Task 1 is Task 2 and thesuccessor for Task 2 is Task 3. Of course, the last task does not haveany task coming after it, so it has no successor. See Chapter 5“Sequencing the Work: Creating the Critical Path” to understand themany ways to set up relationships between tasks.Units (amount available for a resource to be assigned to a task):The percentage or amount of units a resource (or resources) is available to work on a task or tasks. In other words, if a resource is set tobe able to work at 50% units, the resource can only expend half itscapacity on the task. In the following example, for Task 1 in theResource name field, Resource A is set at 50% units, and Resource B isalso set at 50% units (shown in brackets after the resource name). OnTask 3, the resource shows nothing after it, which means thatResource A is set at the default of 100% units on the task.Field definitions vary based on what data field you are displayingThe definition of a field can differ depending on what portion of Projectyou are reviewing. For instance, Work in the Gantt Chart is the totalamount of time (effort) it will take to complete the task. Work on theResource Sheet for a project is the total amount of work the resource hasbeen assigned on all tasks in the project.
342902.qxd5/30/072:22 PMPage 37Revealing the Secrets of Microsoft ProjectFigure 2.1637Important Project fields exposedAlthough there are numerous other fields in Project, the preceding fields aresome of the most important in understanding the scheduling and cost calculations in the scheduling engine. There are other fields that set how thefields react. Although each of the following fields is described briefly here,each is also described in far more detail in later chapters. Some of the mostimportant of these field settings are the following: Effort-driven: This setting drives the task duration when resourcesare added or removed from a task. If the effort-driven field is set toYes, (which is the default setting), then when resources are added to atask, they will share the work assigned to that task. The Work field willstay at the present value, even if you continue to add resources to thetask. For instance, let’s say the Work field is set at 50 hours and theDuration is initially 10 days. If you assign 5 people to the task, Projectwill set each resource to work 10 hours (it assumes an even sharing ofthe work unless you tell it otherwise). The duration of that task willbe reduced to 2 days because, in essence, the work is shared betweenthe resources and will take only 1/5 as long in calendar days if oneperson were working on the task alone. If this is set to No, then nomatter how many people are assigned to the task, the duration willnot change because the work will not be shared among the resources. Task Type: There are three settings for this field: Fixed Units, FixedDuration, and Fixed Work. This setting affects a calculation, Workequals Duration times Units, that sits in the scheduling engine. Thedata in one field might change based on a change in one of the othertwo fields. This is a very important setting that I discuss later in thischapter and in more detail in Chapters 4 and 6. The default Task typesetting is Fixed Units. The Task Type and Effort-driven fields worktogether to affect how duration is affected on a task. Constraint Type: There are eight settings that define how constraints are set for dates in Project. The constraints describe how youwant to constrain or set the start or finish dates for a task:
342902.qxd385/30/072:22 PMPage 38Chapter 2 As Soon As PossibleAs Late As PossibleFinish No Earlier ThanFinish No Later ThanMust Start OnMust Finish OnStart No Earlier ThanStart No Later ThanIf you select one of these settings and indicate a particular start or finish date, then the schedule will react accordingly. I discuss this more inChapter 4 but for now think about this as telling the schedule exactlywhen you want the task to start or end. Work Contour: This is how work will be scheduled day-by-day. Thedefault contour is Flat, which indicates you want Project to schedulework evenly over the duration of a task. See Figure 2.17, which showshow a resource is assigned to work on a 5-day, 40-hour task. Projectapplies the resource’s time on a Flat contour, scheduling the resourceat 8 hours a day. If the resource were assigned to work on a 5-day, 20hour task, Project would schedule the resource at 4 hours a day. Thereare many alternative contours available, such as front- or back-loaded.but most people only use or need to use the Flat contour. In this book,I do not cover the alternative contours available.Figure 2.17How Project scheduled time day-by-day using a Flat contour Timephased: Data within Project can be shown in a timephased format. Project distributes the cost, allocation, and work information fortasks, resources, or assignments across time. Even though you mightenter Duration as being 20 days, when a resource is added to the task,Project distributes the work to be performed over months, weeks,days, hours, and minutes, which is accessible in the Project data structure. Figures 2.18 through 2.23 illustrate this timephased distribution
342902.qxd5/30/072:22 PMPage 39Revealing the Secrets of Microsoft Project39in the Project data structure in the Resource Usage view. The only thingthat has changed in each view is the timescale so that the timephasingis exposed. Depending on the length of your project, you might find aweek-by-week timephased view to be the right level of detail. However,some people use Project to schedule critical operational maintenanceprojects that requires an hour-by-hour or minute-by-minute schedule,and the detailed timephased view might be appropriate.Figure 2.18Timephased data by monthFigure 2.19Timephased data by weekFigure 2.20Timephased data by dayFigure 2.21Timephased data by hour (by half day)
342902.qxd405/30/072:22 PMPage 40Chapter 2Figure 2.22Hourly timephased data (2-hour increments)Figure 2.23Timephased data by minutes.New users of Project are sometimes confused by what the Work, Duration,Start, Finish, and Cost fields really mean. As an example, the Work field isactually the current estimate for the work at completion. You might haveoriginally estimated a task would take 40 hours, but as you enter progressduring the execution of the project, the Work field might change to indicatethat currently, the estimate is 50 hours (based on progress reported by theresource completing the task). The following terms can designate the Work,Duration, Start, Finish, and Cost fields: Current: The current value for the data element which indicates whatwill be accomplished at completion of the project. This term does notappear in front of the data fields. For instance, when you see the data inthe Work, Duration, Start, Finish, or Cost fields, they contain values thatindicate what will happen if the current course of action continues.The Baseline field is the real estimate, not one of the Work or Durationfield. Once you start tracking, the fields contain the current estimatedvalues, based on recording the Actual and Remaining field values. Actual: The data value based on what actually happens when youenter data to track your project progress. For instance, the plannedDuration field might be 10 days, but when you ask the team membershow long it really took to get the work done, they tell you 12 days. Youwould enter 12 in the Actual duration field. What is perplexing (untilyou know better) is that when you enter 12 in the Actual durationfield, the current duration field will change to 12, too. This is becauseof a formula described in the next section of this chapter. If you usethe baseline field described next, you don’t have to worry about thisphenomenon.
342902.qxd5/30/072:22 PMPage 41Revealing the Secrets of Microsoft Project41 Baseline: The data value in the field based on your recording of theplanned fields at a point in time. When you are satisfied with the estimates in the planned Duration and Work fields, you can perform anaction that baselines the schedule. This captures a record of thoseplanned values. Then, when you enter actual values into a field, youcan see the variance between your original planned estimates and theactual values. For instance, if your planned Duration is 10 and youbaseline the schedule, Baseline Duration is entered with 10. Once yourecord an Actual Duration value of 12, the Duration field will changeto 12, but the Baseline Duration field will remain at 10 so you knowwhat your original estimate was. Remaining: This designation in front of a field indicates how much isremaining in the planned estimate when an actual value is applied.For instance, let’s say you have a planned Duration of 10 days. Youapply an Actual Duration of 2 days. That means the Remaining Duration is 8 days.See Figure 2.24 to illustrate this concept. Your planned duration estimate fora task was 10 days. Let’s say your team tells you they have completed 2 dayson the task. You enter the information in the Actual Duration field as shown.Notice that the Remaining Duration field displays 8 days.Figure 2.24reportedDuration fields exposed for a task with 2 days actual progressThen, 10 days later, the team tells you they are actually done, and it took atotal of 12 days. Figure 2-25 shows what this would look like in the fields.Notice that the Duration field is 12 days, the Remaining Duration field is 0,and the Baseline Duration field is the only one that shows the original estimate of 10 days.
342902.qxd425/30/072:22 PMPage 42Chapter 2Figure 2.25 Duration fields reflecting values after actual progress is enteredon the scheduleTable 2.1 shows the various designations for schedule and budget fields.Table 2.1 Various Field al workBaseline workRemaining workDurationActual durationBaseline durationRemaining durationCostActual costBaseline costRemaining costStartActual startBaseline startNot applicableFinishActual finishBaseline finishNot applicableKeep these fields in mind as you schedule tasks and review actual progressfor costs, work, and duration of tasks in the schedule.Project Behavior and DefinitionsNot only does Project have a data structure around task, resource, and assignment categories and fields that are core to the way project schedulingworks, Project also uses formulas, calculations, and rules that affect scheduling behavior. You cannot see these formulas, calculations, and rules, except inthe behavior of Project itself. In this section, I describe some of the behaviors, but this by no means is all-encompassing.SchedulingProject uses particular settings, fields, and formulas when scheduling basedon the information you enter. First and foremost, the calculations occur tothe schedule because by default Project is set to automatically calculatescheduling changes. This setting can be turned off by selecting Tools fromthe menu bar, then clicking Options and setting the Calculation mode to
342902.qxd5/30/072:22 PMPage 43Revealing the Secrets of Microsoft Project43manual on the Calculation tab. Experienced schedulers, or those familiarwith other scheduling systems, sometimes turn the setting off, but youshould leave it on initially to learn how it works.The most important calculation in Project is this:Duration Units Workalso known asWork/Units DurationorWork/Duration UnitsThe calculation and its result are easier to remember if you keep in mind thatunits refers to resources (1 resource at 100% allocation is 1 unit).Figure 2.26 shows the result of this formula for a task in Project. Work hasbeen inserted as a column in the Gantt Chart view and the columns havebeen moved to better reflect the formula.Figure 2.26Duration Units WorkThe task has a Duration value of 5 da
Project icon indicating that a constraint has been added to the task Tool tip describing the constraint Figure 2.1 Constraint set by Project when you enter a date in the Start field This behavior is part of the Microsoft Project scheduling engine, a very sophisticated set of rules about the way a schedule should behave,based on