Transcription
The Dark Energy Survey and Operations: Year 1H. T. Diehl 1a, T. M. C. Abbottb, J. Annisa, R. Armstrongc, L. Baruahd, A. Bermeod, G. Bernsteinc, E.Beynone, C. Brudererf, E. J. Buckley-Geera, H. Campbelle, D. Capozzie, M. Carterd, R. Casasg, L.Clerkinh, R. Covarrubiasi, C. Cuhnaj, C. D’Andreae, L. da Costak, R. Dasl, D. L. DePoym, J.Dietrichn,o, A. Drlica-Wagnera, A. Elliottp, T. Eiflerc, J. Estradaa, J. Etheringtone, B. L. Flaughera, J.Friemana, A. Fausti Netok, M. Gelmani, D. Gerdesl, D. Gruenn,q, R. Gruendli,r, J. Haoa, H. Heads, J.Helsbyt, K. Hoffmang, K. Honscheidp, D. Jamesb, M. Johnsoni, T. Kacprzach, J. Katsarosd, R.Kennedyd, S. Kenta, R. Kesslert, A. Kimu, E. Krausec, R. Krona, S. Kuhlmannv, A. Kunderb, T. Lim,H. Lina, N. Maccrannw, M. Marchc, J. Marshallm, E. Neilsena, P. Nugentu, P. Martinix, P. Melchioro,x,F. Menanteaui,r, R. C. Nichole, B. Norda, R. Ogandok,y, L. Oldz, A. Papadopoulose, K. Pattonx, D.Petravicki, A. A. Plazasaa, R. Poultond, A. Pujolg, K. Reilj, T. Rigbyd, K. Romerd, A. Roodmanj, P.Rooneyd, E. Sanchez Alvaroab, S. Serranog, E. Sheldonaa, A. Smiths, R. C. Smithb, M. SoaresSantosa, M. Soumagnach, H. Spinkav, E. Suchytap, D. Tuckera, A. R. Walkerb, W. Westera, M.Wiesnera, H. Wilcoxe, R. Williamsd, B. Yannya, Y.-Y. ZhanglaFermi National Accelerator Laboratory, P.O. Box 500, Batavia, IL,60510 USA; bNational OpticalAstronomy Observatory, Cerro Tololo Inter-American Observatory, Casilla 603, La Serena, Chile;cDept. of Physics and Astronomy, University of Pennsylvania, Philadelphia, PA, 19104 USA; dDept.of Physics and Astronomy, Sussex, UK; eInstitute of Cosmology and Gravitation, University ofPortsmouth, Portsmouth, PO1 3FX, UK; fInstitute for Astronomy, Department of Physics, ETHZurich, Wolfgang-Pauli-Srasse 27, CH-8093 Zurich, Switzerland; gInstitut de Ciéncies de l’Espai(ICE, IEEC/CSIC), E-08193 Bellaterra (Barcelona), Spain; hDept. of Physics and Astronomy,University College London, Gower St., London, WC1E 6BT, UK; iNational Center forSupercomputing Applications, 1205 West Clark St., Urbana, IL 61801, USA; jKavli Institute forParticle Astrophysics and Cosmology, 452 Lomita Mall, Stanford University, Stanford, CA, 94305USA; kLaboratório Interinstitucional de e-Astronomia - LIneA, Rua Gal. José Cristino 77, Rio deJaneiro, RJ - 20921-400, Brazil; lDepartment of Physics, University of Michigan, Ann Arbor, MI,48109 USA; mGeorge P. and Cynthia Woods Mitchell Institute for Fundamental Physics andAstronomy, and Department of Physics and Astronomy, Texas A&M University, College Station,TX 77843, USA; nUniversity Observatory Munich, Scheinerstrasse 1, 81679 Munich, Germany;oExcellence Cluster Universe, 85748 Garching b. Munich, Germany; pDept. of Physics, The OhioState University, Columbus, OH, 43210 USA; qMax Planck Institute for Extraterrestrial Physics,Giessenbachstrasse, 85748 Garching, Germany; rDepartment of Astronomy, University of Illinois atUrbana-Champaign, W. Green Street, Urbana, IL 61801, USA; sDept. of Physics and Astronomy,Austin Peay State University, Clarksville, TN, 37044 USA; tKavli Institute for CosmologicalPhysics, University of Chicago, Chicago, IL 60637 USA; uLawrence Berkeley National Laboratory,1 Cyclotron Road, Berkeley, CA 94720, USA; vArgonne National Laboratory, 9700 South CassAve., Lemont, IL, 60439 USA; wJodrell Bank Center for Astrophysics, School of Physics andAstronomy, University of Manchester, Oxford Road, Manchester, M13 9Pl, UK; xCenter forCosmology and Astro-Particle Physics, The Ohio State University, Columbus, OH, 43210 USA;yObservatório Nacional, R. Gal. José Cristino 77, BR Rio de Janeiro, RJ 20921-400, Brazil; zCrippsCentre for Astronomy and Particle Theory, University Park, Nottingham, NG7 2RD, UK;1Diehl@FNAL.GOV; phone 1-630-840-8307.
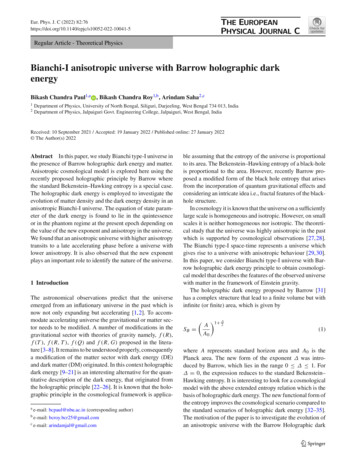
aaBrookhaven National Laboratory, Building 510, Upton, NY, 11973 USA; abCentro deInvestigaciones Energéticas, Medioambientales y Tecnológicas (CIEMAT), Madrid, SpainABSTRACTThe Dark Energy Survey (DES) is a next generation optical survey aimed at understanding the accelerating expansion ofthe universe using four complementary methods: weak gravitational lensing, galaxy cluster counts, baryon acousticoscillations, and Type Ia supernovae. To perform the 5000 sq-degree wide field and 30 sq-degree supernova surveys,the DES Collaboration built the Dark Energy Camera (DECam), a 3 square-degree, 570-Megapixel CCD camera thatwas installed at the prime focus of the Blanco 4-meter telescope at the Cerro Tololo Inter-American Observatory(CTIO). DES started its first observing season on August 31, 2013 and observed for 105 nights through mid-February2014. This paper describes DES “Year 1” (Y1), the strategy and goals for the first year's data, provides an outline of theoperations procedures, lists the efficiency of survey operations and the causes of lost observing time, provides detailsabout the quality of the first year's data, and hints at the “Year 2” plan and outlook.Keywords: Cosmology, Dark Energy Survey, Dark Energy Camera, Operations, CTIO1. INTRODUCTIONThe Dark Energy Survey (DES) is an international collaboration, with over 200 scientists from over 20 institutions in theUS, the UK, Spain, Brazil, Switzerland, and Germany. The DES [1-2] will measure dark energy parameters using fourcomplementary techniques: galaxy cluster counting, baryon acoustic oscillations, weak gravitational lensing, and TypeIa supernovae. The wide-field (WF) survey will produce images of 5000 square degrees of the southern galactic capcollected during 525 nights of observing from 2013 to 2018. The WF survey will be accomplished in 10 dither patterns(tilings). Ten 3-square-degree fields will be imaged repeatedly to produce a supernovae survey. In order to carry outthese surveys, the DES Collaboration constructed a new instrument, the Dark Energy Camera.The Dark Energy Camera (DECam) [3-7] was designed and built from 2004 to 2010. The camera uses 5 fused-silicaoptical elements to attain an f/2.7, 2-degree-wide image on the focal plane. The focal plane itself has 42 cm radius and ispopulated with 62 2048x4096 pixel 250 µm thick, fully-depleted, red-sensitive CCDs [8], for imaging. It was firstassembled and tested at Fermilab on a full-scale reproduction of the telescope top-rings that we called the “TelescopeSimulator” [9-10]. It was delivered to CTIO in a series of shipments starting in early 2010. The imager was the lastmajor component to be shipped [11], arriving in December 2011.CTIO led [12-13] the camera installation with intense and active participation by the DECam design and constructionteam. Installation started in January 2011 with the setup of the new f/8 handling system, necessary because the inner topend ring would no longer be able to pivot 180 degrees on its axle (thus facing the f/8 mirror towards the primary mirror)after DECam was installed. From June to August 2011 the camera infrastructure was installed into the Blanco Dome,including the LN2 system that cools the CCDs to operating temperature [14], and the chillers for the readout electronics.Starting in February 2012 the old Prime Focus cage was removed and the new DECam cage and optical corrector, “thebarrel”, were installed. Over the next months the support services for the camera were installed onto the telescope andthe mountain top computer system was installed and tested. The imager was attached to the barrel on August 30th. Thefilter-changer and shutter were installed on September 6th. “Official First Light” was achieved on September 12, 2012[15]. DECam achieved 0.8” seeing across the focal plane within 45 minutes of its first exposure. Fig. 1 shows a photo ofthe Dark Energy Camera mounted at the Prime Focus of the Blanco telescope.DECam was commissioned during September and October 2012. During that period the active-optics “focus” system[16-17] and the guide-star system [6] were enabled and debugged. A survey and instrument testing period called“Science Verification” was carried out by the DES Collaboration and “Community Astronomers” during November.Regular “Community Observing” began on December 1, 2012. Primarily because of concerns over elongation of theimages due to telescope tracking oscillations, principally in RA [18], Science Verification was extended into 2013 andthe first observing season for DES was postponed. The image quality problems were finally resolved in late Januarywhen the RA bearing oil-scraper was set to the proper clearance and the Primary Mirror cooling system was enabled.Science Verification ended after the night of February 22, 2013. For the period December 1, 2012 to February 28, 2013,
the Community Observers and DES equally divided the 80 nights of telescope time. After that, the camera was used bythe astronomical community. May and July 2013 brought “hardening” of camera infrastructure systems including theliquid-nitrogen (LN2) pump and the front-end electronics cooling, which had unexpected failures. This work wascarried-out by technical staff from Fermilab and CTIO and is part of the training of the CTIO staff in some unfamiliartechnologies. DES scientists participated in the planning and analysis of camera and telescope engineering observationsthroughout this period. DES continues to investigate improvements to the LN2 pump operation so that those will notneed to be replaced at the cost of at least 2-3 nights of operations every 7 months. The first observing season of the DarkEnergy Survey started on August 31, 2013.This paper describes DES “Year 1” (Y1), the strategy and goals for the first year's data, provides an outline of theoperations procedures, lists the efficiency of survey operations and the causes of lost observing time, provides detailsabout the quality of the first year's data, and hints at the “Year 2” plan and outlook.Figure 1. The Dark Energy Camera is mounted at the Prime Focus of the Blanco 4m telescope at CTIO. The PrimaryMirror is just out of the photo, low and to the left. The camera assembly is approximately 14 feet long and is secured to theinner telescope ring. The aluminum covers of three of the four readout electronics crates are visible on the upper right, as isthe stiff cable tray dangling from the inner ring and supported by the telescope truss assembly.
2. YEAR 1 PLAN & OPERATIONS PROCEDURE2.1 The Dark Energy Survey “Year 1” Schedule and Survey FieldsThe first Y1 night of DES observing started on the night of August 31, 2013. Y1 concluded during the night that startedon February 9, 2014. There were 91 full nights through January 4, 2014 and 28 first-half nights after that, for a total of105 nights. The western part of the part of the survey field was no longer observable by the end of the run and theeastern part of the survey field was setting in the first half of the night by the end of January. During Y1 there were 17nights assigned to “Engineering” and these also tended to be during periods of Full Moon. “Community Users” wereassigned the remaining 24 full nights and 28 second-half nights during the period Aug. 31st to Feb. 9th.The 5000 square-degree DES observing “wide-field” (WF) has three main regions. See Fig. 2. There is a broad roughlycircular region from RA of roughly 0 to 120 degrees and DEC -70 to -10 degrees that provides a large contiguous areafor the large-scale structure measurements. There is a wide roughly box-shaped region around the South Pole Telescope(SPT) observing area [19]. Finally, the survey encompasses a part of SDSS Stripe 82 [20], primarily for calibrationpurposes.For Y1 we chose to observe a 2000 square-degree subset of the entire DES footprint. We planned to observe that 2000square-degrees four times each in each of the five filters, g, r, i, z, and Y-bands. Due to curvature of the sky, gapsbetween the CCDs, non-functioning CCDs, and edge effects, a single, complete tiling covers approximately 84% of thesurvey footprint area. The g, r, i, and z-band exposures are 90 seconds duration. The Y-band exposures are 45 secondsduration.Figure 2. The Dark Energy Survey observing “wide fields” are shown in black on this plot of RA and DEC. During Y1DES planned to observe the areas outlined in blue, which encompass SDSS Stripe 82 (upper) and the SPT area (lower). Thered line is an artifact, showing a previous version of the survey field.The 10 supernova fields are shown in Table 1. The 8 “shallow fields” are observed for single exposures in g-band(175s), r-band (150s), and i-band (200s) and for two images in z-band (200s each). The limiting magnitudes are 24.9,24.3, 23.9, and 23.8 for g-, r-, i-, and z-bands, respectively. The 5 exposures of a shallow field are considered a“sequence” and the sequence is observed consecutively. The two “deep fields” are observed for 3 exposures of 200seach in g-band, for 400s each in r-band, for 5 exposures of 360s each in i-band, and for 11 exposures of 330s each in zband. The exposures in each given filter for the deep fields are considered a sequence. The exposures for each filter aresequential but the different filters might be observed at different times during a single night or on different nights. Thelimiting magnitudes for the deep field sequences are 25.6, 25.4, 25.1, and 24.8 for g-, r-, i-, and z-bands, respectively.Because the telescope pointing is accurate to 5” to 7” in both RA and DEC, each SN sequence is preceded by a 10sexposure that is processed to find the pointing offset correction applied before the first exposure in the sequence starts.
Table 1. RA and DEC (J2000) of the 10 DES supernova fields. Fields C3 and X3 are “deep fields”. The other 8 fields are“shallow fields”.2.2 OBSTACDuring the course of the season a variety of weather, seeing, and sky-brightness (Moon) conditions are expected tooccur. A computer application, the “Observer Tactician” (ObsTac) [21] uses this information to select the highestpriority fields to observe during the next 15 minute interval throughout the night. A simplified version of the ObsTacdecision tree is shown in Fig. 3. On the first night of the survey ObsTac will prefer to select SN fields because all ofthose will not have been observed in the previous 6 nights. In practice ObsTac waits for those fields to rise. An“Exposure Table” keeps track of those images that have been completed. ObsTac selects the highest-priority wide-fieldimages left to complete, where priority includes whether the field is approaching the air-mass limit of 1.4.Figure 3. A simplified version of the scheduling algorithm implemented by the Observer Tactician algorithm “ObsTac”. The“seeing” is that expected based on current conditions when projected to an equivalent i-band observation taken at zenith.“wide” is short for “wide-field” observations.
2.3 Observation Schedule & StaffingThe DES observations are staffed by collaboration members and are done at the telescope. The Operations Scientistschedules the observing team. There are three observing roles during full nights. “Observer 1” controls the camerathrough the data-acquisition interfaces [6] and executes the nightly program by following standard DES observingprocedures [22]. This observer ensures that images are being recorded, pays attention to the alarms and warnings, andsolves routine problems where procedures have been established. “Observer 2” performs quality control procedures,checks the images for problems and ensures that the image quality is as expected given the current conditions. The “RunManager” is the lead observer and is responsible for ensuring that the two other observers understand how to performtheir roles. The Run Manager also has some daytime responsibilities described below, so they are not expected to stayup for the full night. During half-night observations we usually have two observers with the Run Manager taking on oneof the roles. Sometimes there are additional observers due to overlapping travel schedules and when we want to haveincreased observer training.Generally, the “Observer 1” role can be performed by an inexperienced but attentive observer. We often fill thesepositions with students and post-docs who have no previous observing experience. We prefer to have more-experiencedobservers as “Observer 2” for their expertise in image quality. Run Managers are required to have performed bothobserving roles effectively.Support is available to the observers through the CTIO Telescope Operator (on hand), the CTIO Observer SupportSpecialist (on-site), the CTIO Instrument Scientist (typically by phone), and the DES Operations Support Team (byinternet connection).2.4 Daily Operations CycleThe typical [23] “Daily Cycle” starts with the Run Manager’s Meeting held daily at 16:00 CTIO time. The Run Managermeets by phone with the Operations Support and Data Management [24] (DESDM) Teams. We discuss any technical orprocedural problems that occurred during the previous night, provide additional information to DESDM about individualimages that might be problematic (for example, if the telescope slewed during the image), receive the DESDMcalculated data quality from previous night’s imaging (see Section 2.5), and discuss what to expect from ObsTac basedon the expected weather conditions. After this meeting the Run Manager implements the data quality, updating theExposure Table so that ObsTac has up-to-date information on which images need to be redone.The period before twilight is used for calibrations and to establish the basic functionality of the instrument. An LEDsystem [25] illuminates a flat-field screen attached to the inside of the dome. We take a set of biases and flats in each ofthe filters. These images are used in the daily calibration. An hour before sunset the telescope operator will open thedome. At minus 10 degree twilight (roughly 40 minutes after sunset) the observers execute three standard star field [26]exposure scripts, one at high airmass (X 1.65 to 2.1), one at medium airmass (X 1.25-1.65), and one at low airmass(X 1.25). At minus 12 degree twilight (roughly 48 minutes after sunset) the observers begin ObsTac observations.These continue during the night until minus 10 degree morning twilight, for standard star observations, and finally domeflats. In addition to the nightly standard star observations, a) an all-sky infrared camera [27] measures the distributionand amount of water in the atmosphere, b) a GPS receiver mounted on one of the small domes at CTIO measures theamount of water vapor, and c) during some of the observations a 4-narrow-band filter camera system [28] was used tomonitor precipitable water vapor and aerosols in the atmosphere. This information is used in the final calibrationprocess.The observers maintain commentary and notes in an electronic logbook. At the end of each night the observers createtwo night summaries. The “CTIO Night Report” lists weather conditions, problems encountered, and the fraction of timelost to each. The “DES Night Summary” provides the narrative of the shift including the expected plan with ephemeris,the conditions, accomplishments, problems encountered, and notes for the DESDM team. A series of automaticallygenerated plots and statistics follows, including transparency, PSF, and ellipticity of stars for each image, a note of anygaps between exposures of greater than 60 seconds, the progress on wide-field and SN surveys (figures similar to thoseshown in Section 4), and a list of exposures. This summary provides a concise history of what happened during thatparticular night.
The images are transferred by the NOAO Data Transport System [29] (DTS) to NCSA/UIUC in Urbana-Champaign,Illinois, usually within 5 minutes after the moment that the shutter closed. Copies of the data are stored in La Serena andat the NOAO Science Archive in Tucson [30]. To conserve both disk space and network bandwidth the DECam data arelosslessly FITS tile-compressed [31] using FPACK. Note that both the DESDM pipeline, described below, and theCommunity Pipeline [32] use a lossy FPACK compression [33].The camera and telescope are returned to a safe condition after observations are finished.2.5 Data Processing & Data QualityThe DESDM pipeline performs image detrending and calibration that we referred to as “First Cut” in order to assess thequality of each exposure with respect to the minimum requirements necessary for DES to obtain its scientific objectives.The overscan and bias is subtracted and the image is divided by the mean dome flat. The CCD crosstalk is removedusing a premeasured matrix, a linearity correction applied, fringe and pupil ghost corrections are combined, and a starflat is applied to subsections on each CCD. An astrometric solution for each image is found by comparing to knownstellar positions in the 4th USNO Astrograph Catalog (UCAC-4) [34]. Finally, the point spread function (PSF) isdetermined by examining the shapes of stellar images and then the position, brightness, and rudimentary shape of objectsdetected in each image are cataloged.We determine if the image is adequate for the wide-field survey by requiring that the “Effective Time”,t effective (0.9k/FWHM)2(Bkgd dark /Bkdg)(10-2C/2.5) exceeds a minimum. Here k is a filter-dependent “Kolmogorov Factor”scaled relative to i-band that takes into account the natural seeing dependence on wavelength, FWHM is the deliveredpoint-spread-function for stars, Bkgd and Bkgd dark are the measured sky background and dark sky condition, and C is theatmospheric extinction offset calculated from a comparison of the brightness of stars within the image to those in theAPASS DR7 and/or NOMAD public catalogs [35-36]. We require that t effective 0.2 for g, and Y-bands and 0.3 for r, i,and z-bands. Each image is then checked for artifacts, such as satellites and airplane trails, and these images are flagged.Supernovae are discovered by searching for temporal variations in brightness between SN template images and SNexposures. These SN search images are first processed through a detrending pipeline similar to First Cut, and thenthrough a difference imaging pipeline. The SN difference imaging pipeline aligns the template and search images,adjusts the template image to match the seeing conditions of the search image, then subtracts the two images to producea “differenced” image. Object detection software runs over the differenced image to identify transient objects, thesetransient objects are then passed through machine learning algorithms and human scanning to identify transients whichare supernova candidates. The data quality and the efficiency of this pipeline is monitored by inserting fake supernovaeinto the search images and monitoring how well these fake events are recovered by the pipeline. In particular, four fakesupernovae of fixed magnitude (magnitude 20) are inserted into each CCD in each search image. The search images areconsidered to be of acceptable quality if 90 % of the fixed magnitude fakes is recovered and the S/N of the magnitude20 fakes is 20 for shallow fields and 80 for deep fields. There is an additional requirement that seeing is 2.0 arcseconds if projected to i-band at zenith instead of the filter/airmass combination of the exposure.The First Cut processing and data quality evaluation and the SN image pipeline are typically turned around in 2 to 3days. The results are applied to the Exposure Table by the Run Manager as described in the previous subsection.3. Y1 EFFICIENCY & LOSSES3.1 Efficiency from CTIO Night ReportsThe CTIO Night Reports (see Section 2.4) were collated to produce the estimate of efficiency shown in Table 2. Of theapproximately 890 hours of potential observing time, DES lost 10.2% due to weather that was bad enough that the domedid not open (mostly during September and October), and just under 5% due to problems with the camera or telescope.A tiny amount of time was lost due to “observer error” (perhaps that means that the procedures need an increase in fontsize).The time lost due to the camera or telescope failures was dominated by two incidents. A night was lost during Octoberdue to a software error in the Telescope Control System. A night was lost during November when it was realized that a
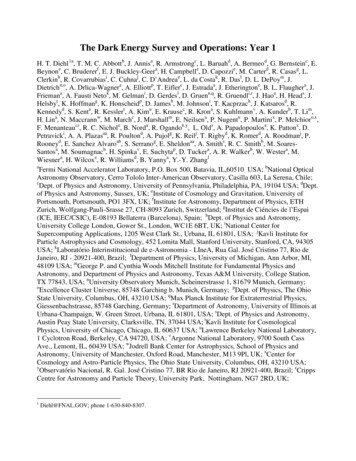
CCD on the focal plane was not responding correctly to clock signals. Subsequent investigation showed that it hadfailed. This is the second CCD on the focal plane that has failed since installation. The first failed in November 2012because of exposure to the morning twilight sky. Both broken CCDs are on the outside edge of the array. Oddly, they areopposite to each other; symmetry has been restored to the CCD array. Most of the remainder of the lost time is a numberof minor delays in observing due to computer interface and software problems. We are working with CTIO to reduce[37] the frequency of these glitches. There were occasional problems with the encoders that report the dome position,which resulted in partially occluded primary mirror. These were eliminated in December 2013 when CTIO installed anew dome position encoder system. Finally, roughly once per night a shutter hardware error occurred, at the cost of animage plus about a minute of recovery time. Though this was not a major factor in lost observing time, it indicated apotential for a serious hardware failure (and substantial downtime). DES arranged for the shutter repair, and performedregular servicing of the filter changer mechanism in March 2014, after Y1 had been completed.Table 2. DES Operational efficiency sums accumulated through Y1. These are based on the observer’s reports in the CTIONight Summaries. Time Available is the time we should spend with the shutter open. Observing time is the number of hoursthe observers were engaged in observing. Next is indicated the number of hours lost to bad weather that results in closingthe dome instead of observing, to a failure of the telescope, dome, or mountaintop infrastructure, to the camera, and toobvious observer error.DES Yr. 1Accumulated Hrs.888.25(%)Observing Time751.5084.6Bad Weather90.2510.2182.0Camera Systems Failure25.752.9Observer Error2.750.3OperationObserving Time AvailableTelescope or Infrastructure Failure1003.2 Open Shutter EfficiencyA second measure of the efficiency is determined from the exposure history. A sum of the open-shutter exposure timecompared to elapsed time is calculated from the start of the first ObsTac image to the end of the last on a given night.That calculation indicated we performed ObsTac observing for 548.6 out of 870.1 hours, amounting to 63% of thenights. The time between shutter-closed and shutter-open was 26s to 30s when there was no telescope slew. Slewsrequired additional time. The open-shutter efficiency increased by about 4% during January and February 2014 after thedome encoders were replaced. From then on, if there was a slew to a new position, the settling-time of the telescopedetermined when we could open the shutter.3.3 DIMM & Delivered SeeingDuring planning for the survey we expected the camera and telescope would degrade the image quality by approximately0.55” in quadrature with the night’s optimal site seeing. Y1 started with nights with cold air temperatures. We foundthat the image quality was not as expected from the CTIO DIMM. See Fig. 4. ObsTac responded (correctly) by taking gband and Y-band images in the condition shown on the RHS edge of Fig. 3. This was alarming and of increasing concernto DES. Towards the end of October it was discovered that the dome floor cooling was not functioning well (floor waswarm compared to the ambient air). In early November CTIO made the primary mirror cooling more aggressive byrunning it all day (instead of just a part of the afternoon) and repaired the floor cooling. At about the same time theweather warmed up.
Figure 4. The difference in arc-seconds between the DECam-delivered seeing, corrected to zenith, and the site-seeing asdetermined from the CTIO DIMM for each survey night. The red line, at 0.55”, is what we expected during the surveydesign. The improvements to the dome floor cooling and primary mirror cooling algorithm were made by the afternoon ofthe indicated date.4. WIDE FIELD AND SUPERNOVA SURVEY PROGRESS IN DES YEAR 14.1 Wide Field Survey ProgressIn total we recorded 17671 WF images. Of those, 82% passed the t effective data quality measure. Of the 18% that weredeclared “unusable”, 78% were recorded before the changes to the dome floor and primary mirror cooling and theweather warmed up. The bulk of the bad exposures were g- and Y-band exposures directed by ObsTac during poorachieved seeing. Fig. 5 shows the number of good exposures in each of the four Y1 tilings for each of the five filters.Fig 5 shows we successfully covered the eastern part of the Y1 field with four tilings in all five filters. Fig. 5 also showsthat there are survey areas in the western part of the Y1 field where we did not achieve four tilings in each filter (becauseof the early seeing struggles), that there are areas in Stripe 82 where we did not achieve any tilings in dark-time filters(due to the proximity of the Moon), and that there is a considerable part of the eastern Y2 area that was finished in Y1,especially in z- and Y-band (because we ran out of accessible Y1 targets in the latter weeks of the Y1 observing season).We have successful exposures in 82% of the Y1 field and 16% of the Y2 fields as of the end of Y1.The seeing achieved in the Y1 WF exposures is shown in Fig. 6. The g- and Y-band (LHS) exposures that passed thet effective DQ criterion had a median FWHM of 1.17”. The histogram shows features consistent with exposures being takenunder the two different ObsTac observing criteria for g- and Y-band. That there were so many more unusable exposurestaken in g- and Y-band is a further consequence of ObsTac, for as we noted in Section 2.2, ObsTac schedules g- and Yband exposures when the seeing is poor. The good r-, i-, and z-band exposures (RHS) had a median seeing of 0.94”.The survey goal in this latter set of filt
University College London, Gower St., London, WC1E 6BT, UK; i. . Clarksville, TN, 37044 USA; t. Kavli Institute for Cosmological Physics, University of Chicago, Chicago, IL 60637 USA; u. . carried-out by technical staff from Fermilab and CTIO and is part of the training of the CTIO staff in some unfamiliar