Transcription
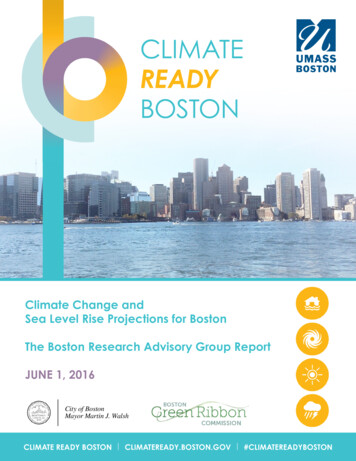
CLIMATEREADYBOSTONClimate Change andSea Level Rise Projections for BostonThe Boston Research Advisory Group ReportJUNE 1, 2016City of BostonMayor Martin J. WalshCLIMATE READY BOSTON CLIMATEREADY.BOSTON.GOV #CLIMATEREADYBOSTON
This report was prepared for the Climate Ready Boston project,an initiative led by the City of Boston in partnershipwith the Green Ribbon Commission.The goal of Climate Ready Boston is to generate solutionsfor resilient buildings, neighborhoods, and infrastructureto help Boston and its metro region prosperin the face of long-term climate change impacts.The Boston Research Advisory Group would like to acknowledge the generoussupport of the following organizations in making this project possible:The Green Ribbon CommissionThe Barr FoundationThe Sherry and Alan Leventhal Family FoundationThe Boston FoundationWe would like to thank the following panel of experts for reviewing the BRAG report.Robin Bell, Columbia UniversityIndrani Ghosh, KleinfelderEddy Moors, Alterra Wageningen University and VU University AmsterdamAnji Seth, University of ConnecticutGeoffrey Trussell, Northeastern UniversityRichard Vogel, Tufts UniversityMichael Wehner, Lawrence Berkeley National LaboratoryDonald Wuebbles, University of IllinoisThank you to the copyediting, design and printing teams at The Ink Spot.Cover photo courtesy of Bud Ris
Climate Change and Sea Level Rise Projections for BostonThe Boston Research Advisory Group ReportManagement TeamEllen Douglas, University of Massachusetts Boston, Ellen.Douglas@umb.eduPaul Kirshen, University of Massachusetts Boston, Paul.Kirshen@umb.eduRobyn Hannigan, University of Massachusetts Boston, Robyn.Hannigan@umb.eduRebecca Herst, University of Massachusetts Boston, Rebecca.Herst@umb.eduAvery Palardy, University of Massachusetts Boston, Avery.Palardy001@umb.eduSea Level RiseRobert DeConto, University of Massachusetts Amherst, Team LeaderDuncan FitzGerald, Boston UniversityCarling Hay, Harvard UniversityZoe Hughes, Boston UniversityAndrew Kemp, Tufts UniversityRobert Kopp, Rutgers UniversityCoastal StormsBruce Anderson, Boston University, Team LeaderZhiming Kuang, Harvard UniversitySai Ravela, Massachusetts Institute of TechnologyJonathan Woodruff, University of Massachusetts AmherstExtreme PrecipitationMathew Barlow, University of Massachusetts Lowell, Team LeaderMathias Collins, NOAAArt DeGaetano, Cornell UniversityC. Adam Schlosser, Massachusetts Institute of TechnologyExtreme TemperaturesAuroop Ganguly, Northeastern University, Team LeaderEvan Kodra, risQ CompanyMatthias Ruth, Northeastern University
The scientific results and conclusions, as well as any views or opinions expressed herein, are those of the author(s) and do notnecessarily reflect those of NOAA or the Department of Commerce.
Table of ContentsA. Introduction 21.2.3.4.B.The need for a climate consensus. 2Risk factors evaluated in the report. 2Process for reaching consensus. 2Process for updating the BRAG projections in the future. 3A Brief Primer on Climate Scenarios 31.2.3.Understanding greenhouse gas (GHG) emissions scenarios. 3How GHG emissions scenarios are used. 5Climate change projections used in this report. 5C. BRAG Findings 61.Sea Level Rise. 6a.b.c.d.2.Coastal Storms.14a.b.c.d.e.3.Key findings. 14Review of existing science . 15Projections. 17Open questions and data gaps. 18Joint flooding between rain- and storm surge-driven flooding. 19Extreme Precipitation.21a.b.c.d.4.Key findings . 6Review of existing science. 6Projections. 9Open questions and data gaps. 14Key findings. 21Review of existing science. 21Projections. 23Open questions and data gaps. 26Extreme Temperatures.27a.b.c.d.Key findings. 27Review of existing science . 27Projections. 29Discussion and data gaps. 33D. Conclusion 34E.Appendix A 39F.References 44Introduction:. 44Sea Level Rise:. 45Coastal Storms:.47Extreme Precipitation:.49Extreme Temperatures:.51Appendix A. 54Sea Level Rise key findings. 6Coastal Storms key findings.14Extreme Precipitation key findings. 21Extreme Temperatures key findings. 271
While there were already many ongoing activitiesprior to October 2012, Superstorm Sandy spurred Bostonand surrounding communities to accelerate planning andaction on climate change resilience. This activity has led to anumber of vulnerability assessment and adaptation strategyreports which include, but are not limited to, Preparing for theRising Tide (Douglas, 2013), Greenovate Boston Climate ActionPlan (Spector, 2013), The Boston Water and Sewer CommissionMaster Plan (BWSC, 2015), and The City of Cambridge ClimateChange Vulnerability Assessment (City of Cambridge, 2015).The climate projections used in each of these reports arespecific to the sites, sectors and time periods of interestand not necessarily consistent with one another. Hence,it is unclear which projections and results are the mostrelevant and useful to the City of Boston proper. To addressthis issue, the Boston Research Advisory Group (BRAG) wasestablished in 2015 to develop a consensus on the possibleclimate changes and sea level rise (SLR) that the City ofBoston will face in the future by 2030, 2050, 2070, and 2100;consensus on the climate projections is necessary because itis important that the results of this study are not disputed.The BRAG was overseen by the UMass Boston project team.A. Introduction1. The need for a climateconsensusOn January 20, 2016, both NASA and NOAAannounced that 2015 was the warmest year on recordglobally, beating the previous record set in 2014, by 0.29 F(Chapel, 2015). In fact, the fifteen warmest years since1880 have all occurred in the seventeen years 1998 to2015 (NOAA, 2015a). For Boston, December 2015 was thewarmest on record and winter 2015-2016 was the secondwarmest on record (National Weather Service, 2015). Withinthe scientific community, the effect of human activities onthe climate is evident. As the Intergovernmental Panel onClimate Change (IPCC; www.ipcc.ch) concluded in 2013,“Human influence on the climate system is clear, and recentanthropogenic emissions of greenhouse gases are the highestin history. Recent climate changes have had widespreadimpacts on human and natural systems.” (IPCC, 2013).Advances in both scientific understanding and computermodeling have resulted in refined projections for futureclimate impacts, and in some cases, a more probabilistic, riskbased approach. These scientific advances are bittersweet,however. On the one hand, we have increased confidenceof both the underlying causes and model estimates of ourchanging global climate (NOAA, 2015b). On the other hand,with this increased confidence has come greater concern andmotivation for action at local and community scales. Localaction requires local information. While advances in climatemodels continue, the granularity (in space and time) of thesemodel outputs does not directly map against local concerns.Thus, the climate community must meet these needs whilereconciling irreducible uncertainties – and more and moreby providing probabilistic information of all outcomes thatpresent a threat.2. Risk factors evaluated in thereportThis report summarizes the current understandingof the local factors that influence Boston’s future exposureto climate change risks. The following four risk factorswere considered most relevant to Boston and are thereforeevaluated in this report: sea-level rise, extreme precipitation,coastal storms and extreme temperatures. For each riskfactor, a team of scientific experts, comprised of a teamleader and three or more team members, was selected toevaluate and summarize the available information containedin both grey (reports, conference proceedings and the like)and peer-reviewed literature. Each team met independentlybetween October 2015 and January 2016, and team leadershad regular teleconferences with the UMass Boston projectteam to keep them apprised of progress and to help overcomeproblems that were encountered. The process for reachingconsensus is outlined in the next section.The IPCC was established by the United NationsEnvironment Programme and the World MeteorologicalOrganization in 1988 and has provided the world witha series of scientific assessments of the current stateof knowledge about climate change and the potentialenvironmental and socio-economic impacts, beginning withthe First Assessment Report in 1990 (IPCC, 1990). The IPCCreviews and assesses the most recent scientific, technical andsocio-economic information produced worldwide relevantto the understanding of climate change; it does not conductresearch or monitor climate-related data or parameters(IPCC, 2000). However, the results presented by the IPCCare relevant at continental to regional scales and cannot bedirectly applied at the level of a municipality for each townor city. As a result, site-specific projects and research must becarried out to determine local vulnerabilities.3. Process for reaching consensusa. Building the group: To build the BRAG, the co-chairsdeveloped a list of faculty at institutions around Massachusetts who specialize in coastal storms, temperatures, precipitation and sea level rise. At the same time,the BRAG project manager researched faculty at localschools to ensure that there were no oversights. Somescientists were immediately identified as potential riskteam leaders. A conversation with these experts followed to get their input on additional invitations.b. Kickoff: Once the teams were finalized, the BRAG waslaunched at a kickoff meeting in late October 2015. This2
meeting provided an opportunity to discuss the scopeof work for each team and identify issues that cut acrossrisk areas.c.and since the 1950s, many of the observed changes areunprecedented over decades to millennia.” In order toplan for a changing climate in the future, we need to makeassumptions and then project what the future could look likebased on those assumptions. Currently, the biggest source ofuncertainty in understanding the impacts of future climatechange lies in human-caused carbon emissions; we knowhumans will continue to emit carbon into the atmosphereas we move through the 21st century, but exactly how muchdepends on the choices made by individuals and by societies.Fortunately, a series of future greenhouse gas emissionsprojections, known as “emissions scenarios,” have beencreated that are based on a wide range of scenarios for futurepopulation, demographics, technology and energy use, whichare then input into climate models in order to project theplanetary response. These scenarios are not meant to predictthe future, but instead offer a range of plausible futureconditions that allow us to better understand uncertaintiesand the implications of the human development decisions.Previous scenarios, such as IS92 (Leggett et al., 1992) andSpecial Report on Emission Scenarios (SRES; Nakicenovic etal. 2000), have been presented by the IPCC for this purpose.SRES scenarios were used for the IPCC third (TAR, released in2001) and fourth (AR4, released in 2007) assessment reports.Since 2000, our ability to understand and model the behaviorof natural and human systems have improved substantially,hence a new, more highly resolved set of scenarios was usedin the IPCC Fifth Assessment Report (AR5, released in 2013;http://www.ipcc.ch/).Research presentation: After the launch, the leadersof the teams talked weekly and prepared to present theirwork to the entire BRAG group in December 2015. Atthis meeting there was a chance for dialogue across riskfactor teams.d. Report: Based on the conversation in December andadditional research, the BRAG team leaders submittedtheir draft reports in January 2016. The co-chairs thencompiled these drafts into one document and edited theresult for consistency.e.Review: Once the document was finalized it was sentout for review to an international group of scientists.This group was selected through a nominating processthat included the BRAG team leaders, the membersof the Green Ribbon Commission’s Higher EducationWorking Group and additional stakeholders.f.Finalization: The feedback from the external reviewerswas incorporated into this final document which is nowavailable publicly.4. Process for updating the BRAGprojections in the future1. Understanding greenhouse gas(GHG) emissions scenariosEach section of the report contains information ongaps in our understanding about the climate change and SLRBoston will face in the future. The BRAG recommends thatthe projections be updated at least every two years and thatresources are allocated to do so. One potential mechanismis that UMass Boston continues to manage the process, bethe point of contact, and hold annual calls with each of theteam leaders or their replacements. The calls will focus onadvancements to the science and the extent that any previousfindings need to be updated. This will determine the scheduleand resources needed for an update. It is expected that aspart of the city’s adaptation plan, key indicators for climateand sea level will be developed that will signal when certainadaptation actions should be initiated. This informationshould be conveyed to the BRAG team via the UMass Bostonproject team so that the indicators can be kept up to date ifthey are not parameters in the BRAG reports.In order to interpret the results of climate modeloutput and analysis based on these scenarios, it is veryimportant to understand the characteristics of eachscenario. “If we don’t put our assumptions about the future onthe table, then we have the same situation we had in the run-up tothe financial crisis, and that is, we blindly follow the assumptionsabout the future that are built into our disciplines and models,”says Angela Wilkinson of Oxford University (as quoted inInman, 2011). The latest IPCC emissions scenarios are called“representative concentration pathways” or RCPs, a set offour future scenarios developed by integrated assessmentmodelers, climate modelers, terrestrial ecosystem modelersand emission inventory experts. The RCPs represent acomprehensive and internally consistent data set with highspatial and sectoral resolutions through 2500. The words“concentration pathway” are meant to emphasize that theseRCPs are not the final new, fully integrated scenarios (i.e.they are not a complete package of socio-economic, emissionand climate projections), but instead are internally consistentsets of projections of the components of radiative forcingthat are used in subsequent phases. The four RCPs (2.6, 4.5,6.0 and 8.5) are named for the possible range of radiativeforcing (the globally averaged heat trapping capacity of theatmosphere, measured in Watts per square meter or W m-2)B. A Brief Primer on ClimateScenariosScientific evidence from around the globe led theIntergovernmental Panel on Climate Change (IPCC) (2013)to declare that “warming of the climate system is unequivocal,3
Figure i-1: Illustration of energy use, oil consumption and energy source (upper) and land use change (lower)trajectories use in the development of each RCP scenario. Vegetation is land use other than cropland andgrassland (Source: van Vuuren et al., 2011).values in 2100 relative to pre-industrial values. Figure i-1illustrates the energy and oil consumption, energy sourcesand land use trajectories underlying each RCP (van Vuuren etal., 2011).Following is a summary of the characteristics ofRCP 8.5, 4.5 and 2.6. Concentrations of CO2, CH4 and N20resulting from these RCPs are shown in Figure i-2. RCP8.5 is the highest of the emission scenarios,consistent with the continuation of fossil-fuelintensive economic growth that characterizedthe past two centuries. Under this RCP, globalCO2 emissions increase about 2.5 timesbetween 2015 and 2080, and atmospheric CO2concentrations grow to about 940 ppm by theend of the century, leading to a likely warmingin 2080-2099 of about 3.3-5.5ºC relative to preindustrial temperatures.4 RCP4.5 assumes that CO2 emissions stay aroundtheir current levels through 2050, then areslowly reduced in the second half of the century.RCP4.5 yields a CO2 concentration of 540 ppmin 2100 and a likely late-century warming ofabout 1.9-3.3ºC. RCP2.6 is a stringent emissions reductionpathway in which net global CO2 emissions arereduced to less than a third of their currentlevels by 2050 and are brought to zero by about2080. CO2 concentrations peak below 450 ppmand late-century warming is limited to about1.3-2.2ºC. The RCP 2.6 scenario is also knownas 3PD, for radiative forcing peaking at 3 W m-2then declining. RCP 2.6 is the only scenario thathas a good chance of limiting warming to lessthan 2 C of atmospheric warming, the targetadopted at COP21 to avoid the most devastatingimpacts of climate change.
Figure i-2: Greenhouse gas emission trajectories used for RCP development (Source: van Vuuren et al., 2011).2. How GHG emissions scenariosare usedmodels as well as new, test models. These are known as theCMIP5 models with resolutions of 100 to 200 km (Melilloet al., 2014) and were used for the IPCC AR5 (IPCC, 2014).CMIP5 represents the current generation of climate models,but not all CMIP5 models are necessarily more reliable thanCMIP3 models, because some are experimental (K. Hayhoe,personal communication, Feb 17, 2016). However, both setsgive similar results in terms of the magnitude and directionof projected changes in temperature, precipitation, and sealevel.The emissions scenarios previously described areused as input to global climate models (GCMs), which arecomplex, three-dimensional mathematical representationsof the Earth’s climate system, including atmosphere andocean circulation and biogeochemical processes, whileaccounting for land use change, etc. GCM output includestemperature, precipitation, and other climate variablesat daily and monthly scales. GCMs are continually beingimproved as our understanding of these Earth processesimproves. However, because the true climate system is socomplex, it is fundamentally impossible to include all itsprocesses in even the most complex climate model (Tedbaldiand Knutti, 2007). Some GCMs are better than others atreproducing important large-scale climate features, but itis scientifically invalid to identify one GCM or even a subsetof GCMs that are “best” for a particular location or region.The generally accepted practice is to evaluate the outputfrom multiple GCMs (a so-called “model ensemble”) becauseusing the output of many models tends to cancel out thelimitations of any one model and generally increases theskill, reliability and consistency of model forecasts. However,the CMIP ensembles are “ensembles of opportunity” ratherthan statistically valid samples (Tebaldi and Knutti, 2007).CMIP3 ensembles were generated using the SpecialReport on Emission Scenarios (SRES) emission scenarios(IPCC, 2000). CMIP5 ensembles were generated using theRCP emission scenarios (van Vuuren et al, 2011; Meinshausenet al., 2011). The U.S. National Climate Assessment (Melilloet al., 2014) used mainly CMIP3 models, with some limiteduse of CMIP5 models. Some of the projections presented inthis report were generated from SRES/CMIP3 scenarios,others are based on RCP/CMIP5. Distinctions are noted asappropriate. Figure i-3 compares carbon emissions for someof the scenarios used in this report.3. Climate change projectionsused in this reportClimate change projections in this report weredeveloped from GCM ensembles run with various scenariosof emissions of greenhouse gases (GHG). One set of GCMswas developed prior to IPCC AR5—otherwise known asCMIP3 (Third Coupled Model Intercomparison Project)models with spatial resolutions of 200 to 300 km at midlatitudes (Melillo et al., 2014). The other most recent setof GCMs include enhancements and additions to CMIP3Figure i-3. Comparison of SRES and RCP EmissionScenarios (City of Cambridge, 2015)5
marsh drowning events more frequent andwidespread. Eventually salt marshes such asthose located at Quincy, Neponset, and BelleIsle will be converted to tidal flats and sub-tidalbays, because the ecological limits of in situorganic sediment production and the very lowsuspended sediment concentration in BostonHarbor are insufficient to keep pace with theprojected rates of RSL rise.C. BRAG Findings1. Sea Level Risea. Key findings The overall trend in relative sea level rise (RSLR)in Boston between 1921 and 2015 has beenabout 2.8 mm/yr (0.11 in/yr). Due to the influence of regional-scale processessuch as ocean dynamics and the gravitationaleffect of melting ice sheets, RSLR in Boston willlikely exceed the global average throughout the21st century, regardless of which emissionstrajectory is followed. The amount and rate of RSLR in Bostonduring the first half of the 21st century isnearly independent of emissions. The mostlikely estimates of RSLR from 2000 to 2050(associated with exceedance probabilities of83%, 50%, and 17%) are 19, 32 and 45 cm (7.5,13 and 18 in), thus a 2050 range of 19 cm to 45cm (7.5 to 18 in) can be considered, but higherRSLR approaching 75 cm (30 in) is possible. After 2050 the scenarios diverge sharply,with substantially more RSLR under thehigher emissions pathways. Under the highestemissions pathway (RCP8.5), the most likelyestimates of RSLR from 2000 to 2100 in Bostonare 97, 149 and 226 cm (3.2, 4.9 and 7.4 ft).Under the moderate-emissions RCP4.5 pathway,RSLR estimates from 2000 to 2100 are 74, 111and 156 cm (2.4, 3.6 and 5.1 ft). Thus a 2100range of 74 cm to 226 cm (2.5 to 7.4 ft) can beconsidered. Sea-level rise will not stop in 2100, and becausesome long-lived infrastructure and land useplans will likely extend into the 22nd century,changes in RSL should be considered beyond2100. If the high RCP8.5 emission scenario isfollowed, the rate of RSL rise by the end of the21st century may be 19-48 mm/yr (0.75-1.9 in/yr), an order of magnitude faster than today,and will continue to accelerate. The accelerating rate of RSLR that willcharacterize RSL change in Boston duringthe 21st century will soon make salt- The maximum physically plausible sea-level risefrom 2000 to 2100 at Boston was estimatedto range from 1.9 m and 3.2 m (6.2 and 10.5ft) in this analysis. This is substantially morethan the maximum RSLR of 2.08 m (6.83 ft)from 2003 to 2100 under the highest emissionsscenario reported in a recent study by CZM(2013). RSL rise will increase tidal range, wave energy,and tidal inundation, resulting in increasederosion of existing geomorphic features andexisting or planned coastal engineering workssuch as flood defenses. It will also increase theelevation of coastal storm surges.b. Review of existing science1.DefinitionsRelative sea level (RSL) is the difference in elevationbetween the sea surface and land surface at a specific placeand time (Farrell & Clark, 1976). By convention, the referencetime period is a multi-year average; this minimizes theeffect of tidal and seasonal cycles, and multi-annual climatevariability (e.g. Shennan, Milne, & Bradley, 2012). We usea 19-year period centered on the year 2000 as a baseline,such that negative and positive values denote periods whenRSL was either lower or higher than the reference period,respectively. Previous analyses of Boston sea-level trendshave used the mid-point (1992) of the 1983-2001 NationalTidal Datum Epoch (NTDE) as their reference point. About3cm (1.2 in) of sea-level rise occurred between 1992 and the2000 reference point used here. Additionally, between 1990and 2010, the average rate of sea-level rise at Boston was5.3 cm (2.1 in) per decade, so RSL in 2015 is about 7.9 cm(3.1 in) above the 2000 reference level. As discussed below,there is considerable annual to decadal variability in RSL.For example, average annual RSL in Boston has varied fromthe long-term average (over the duration of the tide gaugerecord since 1921) with 1σ standard deviation of 5.8 cm(2.3 in). We note that projections of future RSL are providedspecifically for the location of the Boston, MA tide gaugestation (#8443970) operated by the National Ocean andAtmospheric Administration (NOAA).6
2.Processes causing relative sea-level changein Bostonof the global mean sea-level signal), but more thanthe global average for sea-level rise due to mass losson the West Antarctic Ice Sheet (WAIS; about 125%)or the East Antarctic Ice Sheet (EAIS; about 105%).Changes in RSL are caused by mul
Management Team Ellen Douglas, University of Massachusetts Boston, Ellen.Douglas@umb.edu Paul Kirshen, University of Massachusetts Boston, Paul.Kirshen@umb.edu . should be conveyed to the BRAG team via the UMass Boston project team so that the indicators can be kept up to date if they are not parameters in the BRAG reports. B. A Brief Primer .
