Transcription
Design of Potable Water PlumbingSystemsCourse No: M04-023Credit: 4 PDHA. BhatiaContinuing Education and Development, Inc.22 Stonewall CourtWoodcliff Lake, NJ 07677P: (877) 322-5800info@cedengineering.com
DESIGN OF POTABLE WATER PLUMBING SYSTEMSThis course is divided into four parts: PART I - PART II - Estimating Non-Residential Water Demand PART III - Water Distribution System PART IV - Regulatory and System Reliability ConsiderationsEstimating Potable Water Demand
PART IESTIMATING POTABLE WATER DEMANDA fundamental consideration in the sizing of a plumbing water system or its componentsis an estimate of the amount of water expected to be used by the customers.Estimating demand depends on the water usage patterns and is usually unique for aparticular system.residential system.For instance, a difference can exist for a residential and a nonA water usage pattern may also be unique because of theindividuality of consumers on the system and their expectations to use water wheneverand however they wish.Water demand estimation is complex and involves consideration of a number of factors:1. Climatic influences (evaporation, vapor transpiration, temperature, precipitation,winds, etc.); Climate has a significant impact on water use. For instance, inareas where freezing temperatures are prevalent, water use should be closelyevaluated. Some systems may see higher demands as users allow faucets torun to prevent freezing.2. Socioeconomic influences (property values, economic status, residentialdensities); Demographics change with the nature of a development. Populationdensities are different for single family and multi-family residences; for housingprovided for families and housing provided for singles or senior citizens/retirees;and for individual lots and mobile home park type developments.3. Property lots; Housing sizes are usually directly linked to the income levels of theresidents. Middle-income residents typically occupy 1,500 to 3,000 square foothomes with moderate sized lawns.Higher income residents occupy homeslarger than 3,000 square feet. With respect to water use, the greatest impact ofincome level is probably the extent of landscaping. The major factor in water userelated to larger lot sizes is in the irrigable area, such as lawns, gardens, andother agricultural uses.4. Recreational or seasonal uses; Water use and demand at public places, such asamusement parks, vary and can be different.Recreational areas usuallyexperience peak demands during summer holiday weekends such as MemorialDay, Independence Day, and Labor Day.
5. Extent of metering or pricing schedules; Water pricing structure may vary fromplace to place. Some systems may use a water meter that tends to price onactual use; others may have ‘flat rates’ fixed on property size.6. Historic water log sheets; Places like airports, hotels, hospitals and publicbuildings see more or less consistent overall demand. The only design variableinvolved for the facility is the volume of traffic.7. Land use; The purpose of a facility should be assessed. Commercial, industrialand public facility demands are much different from residential demand. Wateruse associated with the services of cleaning, landscaping, and farming need tobe assessed carefully.8. Conservation practices; Areas that have acute or scarce water resources resortto mandatory conservation measures. Mandatory conservation practices include,but are not limited to, alternate day watering schedules, installation of low wateruse fixtures, water closet tank displacement devices, leak detection, rainwaterharvesting, and use of treated effluent water for landscaping.Unaccountedwater demand reduction programs also exist. Community covenants, bylaws orlocal ordinances may exist to support water conservation practices. It is veryimportant to determine if water use restrictions are enforceable.Why Plumbing Codes?It is nearly impossible to predict the consumer mind-set or socioeconomic ethics onwater use. There is usually insufficient data to account for all the factors that mayinfluence the water demands of a particular water system.Defined design criteria are laid out in the ASHRAE guide and the Uniform PlumbingCode (UPC). Both criteria focus on the use of probability theory with a safety factor tocompensate for unknown variables. Required flow rates are defined based on a “FixtureCount” method that is determined after appropriate research and analysis of controllingvariables. Among a host of other factors, these variables are fixture types, people usefactors for structure types, and people socioeconomic factors.
There is no substitute for reliable and accurate meter records of water usage forestimating future demand. An historic data approach allows a designer to use meteredwater use data from an existing facility to estimate the demand of a new system.Model Plumbing CodesThe model universal plumbing codes list minimum requirements for potable watersystems based on probability theory.The five model plumbing code agencies in the United Sates are:1. Uniform Plumbing Code (UPC); adopted mainly in the western U.S.2. Standard Plumbing Code (SPC); adopted mainly in the southern U.S.3. BOCA Plumbing Code (BOCA); adopted mainly in the eastern U.S.4. International Plumbing Code (IPC).5. CABO Plumbing Code (CABO); exclusively for residential construction.Salient features of these codes are: The IPC is relatively new code originating in 1995 as a joint effort of the threemajor model code groups (UPC, SPC and BOCA). The CABO, also derived from these three major codes, is designedexclusively for plumbing of one and two family residential dwellings. The provisions of the above codes are essentially consistent, but containsomewhat different requirements to address factors that are unique to localconditions. For instance, the UPC contains information that considers theearthquake prone western U.S. region. In many cases, a local municipality orjurisdictional authority will add addenda to deal with a specific situation of anarea. All of the model plumbing codes require water supply systems to be designedto deliver a specified flow rate (gallons per minute) within certain pressurelimits. Each code lists procedures for calculating design flow rates that are directlyrelated to the number of plumbing fixtures within the building. (Check UPC-
1997, Appendix A; SPC-1997, Appendix F; IPC-1995, Appendix E; CABO1995, Sect 3409). The model codes require a minimum inlet nominal diameter of water supplypiping to be at least ¾ inch. (Check UPC-1997, Sect. 610.8; SPC-1997, Sect.608.2; IPC-1995, Sect. 604.1; CABO- 1995, Sect 3403.4)Estimating Potable Water DemandTheoretically all plumbing system (pipes) should be sized for a maximum flow rate that iscapable of serving the fixtures simultaneously. In practice the chances of theirsimultaneous use are remote and the plumbing (piping) design criteria may be relaxed tosome degree. Plumbing water distribution systems shall be designed based on the ideaof the most probable peak demand loading, which reflects the worst-case scenario for asystem.There are two methods that have been proposed to aid in the design of plumbing watersystems. Currently, the plumbing industry uses Hunter’s method for approximating peakdemand loadings on a building’s water distribution system. This method was developedin the 1940’s and presented in the National Bureau of Standards published report BMS65, “Methods of Estimating Loads in Plumbing Systems”. It is still the most widely usedprocedure and forms the basis for model plumbing codes (e.g. The InternationalPlumbing Code, The Uniform Plumbing Code and ASHRAE guide).Another method, which is not cited in any major U.S. plumbing codes, has beendeveloped by the American Water Works Association (AWWA). The “fixture valuemethod” was introduced in 1975 and presented in AWWA’s M22 Manual. This method isan empirical approach based on data obtained from water meter data loggers. Thismethod is not recommended for sizing the plumbing water branches, laterals or risersand is primarily used for sizing for water service lines only. Both procedures areseparately discussed in the following paragraphs.Before we proceed further let’s define a few important terms:
1. Fixture - A fixture is any device for the distribution and use of water in a building.Example: shower, urinal, fountain, shower, sink, water faucet, tap, hose bibs, hydrantetc.2. Maximum flow – Maximum flow or maximum possible flow is the flow that will occurif the outlets on all fixtures are opened simultaneously. Since most plumbing fixturesare used intermittently and the time in operation is relatively small, it is not necessaryto design for the maximum possible load. Maximum flow is therefore of no realinterest to the designer.3. Average flow – Average flow is flow likely to occur in the piping under normalconditions. Average flow is also of little concern to the designer, for if a system wasdesigned to meet this criterion, it would not satisfy the conditions under peak flow.Average flow is typically used for determining the storage tank volume factoring thehours of storage required.4. Maximum probable flow – Maximum probable flow is the flow that will occur in thepiping under peak conditions. It is NOT the total combined flow with all fixtures wideopen at the same time, but is proportional to the number of fixtures that may beexpected to be in use simultaneously. It is also called peak demand or maximumexpected flow. The plumbing water system is designed based on maximum probableflow.5. Continuous demand - Some outlets impose continuous demand on the system; forexample; hose bibs, lawn irrigation, air-conditioning makeup, water cooling, andsimilar flow requirements are considered to be continuous demand. They occur overan extended period of time.6. Intermittent demand – Plumbing fixtures that draw water for relatively short periodsof time are considered an intermittent demand. The examples include bathroomfixtures, kitchen sinks, laundry trays and washing machines. Each fixture has its ownsingular loading effect on the system, which is determined by the rate of water supplyrequired, the duration of each use, and the frequency of use.What is the Fixture Unit Count?The fixture unit concept is a method of calculating maximum probable water demandwithin large buildings based on theory of probability. The method is based on assigninga fixture unit (f/u) value to each type of fixture based on its rate of water consumption, on
the length of time it is normally in use and on the average period between successiveuses. All the above factors, together, determine the rate of flow with a plumbing pipe.Hunter’s Method of Estimating Loads in Plumbing SystemsHunter’s method of estimating loads in plumbing systems is based on assigning a fixtureunit weight (f/u) to the plumbing fixtures and than converting these to equivalent gallonsper minute, based on the theory of probability of usage.Hunter observed that all fixtures are not used simultaneously. The durations of use aredifferent and times between uses are different. He estimated the flow rates throughvarious fixtures by capturing average flow and the time span of a single operation fordifferent fixtures. For example, a flush valve was considered to operate over a 9-secondperiod providing an average volume of 4 gallons. This yields a design flow of 27gpm[(4/9)*(60) 26.6gpm]. Similarly for flush tanks, he found that it takes approximately 60seconds to deliver 4 gallons. This yields a design flow of 4gpm [(4/60)*(60) 4gpm].Hunter also found an average time between successive usages (frequency of use) fromrecords collected in hotels and apartment houses during the periods of heaviest usage.This was important to evaluate “how many fixtures could be operated simultaneously”since it is less likely that all the fixtures in the building will be operated simultaneously.Consider a building with 20 flush valves and 20 flush tanks. Hunter applied theprobability theory to determine how many of these 20 fixtures will be operated at anygiven instant with the condition that this occurrence won’t exceed more than one percentof the time. He observed that the probability of using more than 3 flush valves and 8flush tanks simultaneously is less than 1%.Therefore, the peak design flow is worked out to be 3 * 27 81gpm for flush valve and 8* 4 32gpm for flush tanks.Therefore, the pipe capacity shall be (3 *27) (8 *4) 113gpm.Hunter realized that the probability theory could be greatly simplified, if a common fixtureloading unit is applied to the plumbing fixtures. Hunter arbitrarily assigned a singularbase fixture unit weight of 10 to the flush valve, and other fixture types were then given afixture unit weight in terms of their comparative flow rate and time-usage factor in
relation to the base fixture (flush valve). He obtained a weight of 5 for the flush tank and4 for the bathtub which corresponds to a demand ratio of 1:2:2.5 between the threecommon fixture types (flush valves, flush tanks, and bathtubs, respectively). All fixturesare thus converted, in essence, to one fixture type. In other words, each unit of flushvalve corresponds to 10 fixture units; each unit of flush tanks has 5 fixture units andeach unit of bathtub has 4 fixture units.Table 1 lists the demand weights in “fixture units” as determined by the National Bureauof Standards. It is used in conjunction with Figure 1 or Table 2 in determining theexpected normal peak flow for any number or combination of fixtures.TABLE – 1Demand Weights of Plumbing Items in Fixture UnitsFixture or GroupOccupancyCold Water(CW) onlyHot Water(HW) onlyWater Closet (FlushValve)Water Closet (Flush Tank)Pedestal Urinal (FlushValve)Stall or Wall Urinal (Flushvalve)Stall or Wall Urinal (FlushTank)Lavatory (Faucet)Bathtub (Faucet)Shower Head (Mix valve)Service Sink (Faucet)Kitchen Sink (Faucet)Public10--TotalBuildingSupply HW& ivate5.252.256Water Closet (Flush valve)Water Closet (Flush tank)Lavatory (Faucet)Bathtub (Faucet)Shower Head (Mix valve)Bathroom Group (Flushvalve)Bathroom Group (Flushtank)
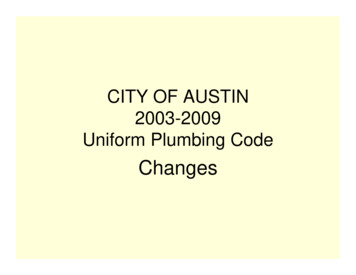
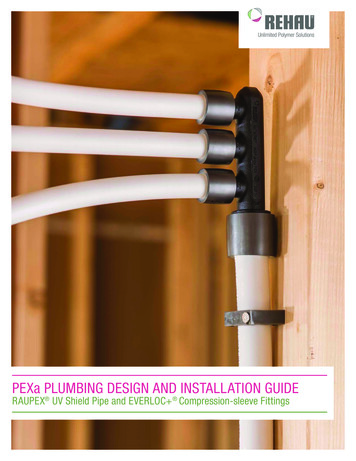
Fixture or GroupOccupancyCold Water(CW) onlyHot Water(HW) onlyShower (Mix valve)Kitchen Sink (Faucet)Laundry Trays (Faucet)Combination ngSupply HW& CW2233Private334(Source: National Bureau of Standard Report: BMS 65 by Late Dr. R. B. Hunter)From the tabulated fixture units Table 1, the designer can assign fixture unit weights tothe specific fixtures of concern in his design. When these are added, their total gives abasis for determining the maximum probable flow that may be expected in a water pipe.Both hot and cold water service will be required within the building. As a general rule,separate hot and cold water demands can be taken as ¾ of the total shown; forexample, a bathtub faucet would be counted as 1½ fixture unit on the cold water system,and 1½ fixture unit on the hot water. Supply piping would be calculated accordingly,while the total figure of the two fixture units would be used to design the drainage piping.Note: The fixture unit loading method is used to quantify intermittent demand and couldbe applied to any of the residential or non-residential facilities. The other continuouswater usage requirements such as hose bibs, air conditioning cooling tower makeup,gardening or process cooling requirements, etc. need to be carefully added to determinethe peak water demand.Fixture Unit – Flow RelationshipIt is obvious that as the number of fixtures increases, the probability of theirsimultaneous use decreases. Figure 1 below shows the graphic representation ofprobability of flow as a function of fixture unit count, also commonly referred to as“Hunter’s Curve”
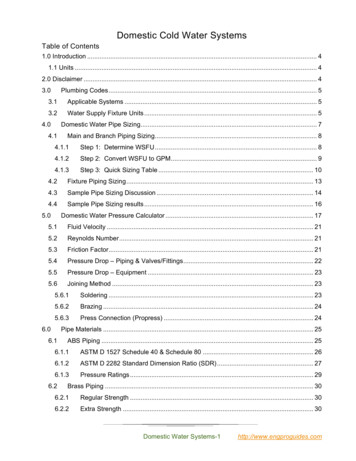
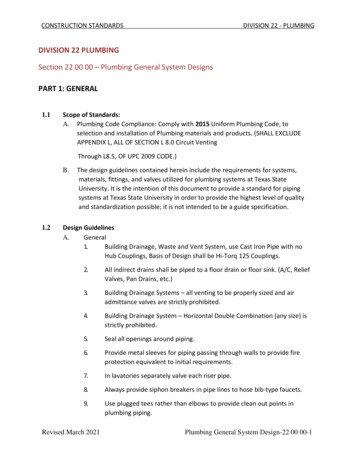
The figure above shows two separate curves; one for flush valve (Curve 1) and the otherfor flush tanks (Curve 2). The curves show slight discrepancies from 0 to 1,000 fixtureunits. The flush tank curve has slightly larger flow rate values within this range. Thereason for different flow rate values has to do with sudden instantaneous draw rate ofthe flush valve water closet. The difference in demand for each system decreases as thefixture unit load increases until 1,000 f/u’s are reached. At this loading and beyond, thedemand for both types of systems is the same.The enlarged view of Figure 1 is also presented below for the benefit of smaller buildingsutilizing lesser number of fixtures.FIGURE – 1 (Enlarged View)
It is customary engineering practice to employ Curve 2 for hot water service pipe sizingand for cold water service when flush tanks are involved.The flush valve Curve 1 is used only for cold water and total service water flowestimation. Quite often it will be compared to the actual flush valve manufacturer’srecommendations.Curve 1 is seldom used for hot water side sizing. Reason: “Instantaneous maximum orpeak probable flow is not expected to appear except at very infrequent intervals and isexpected to be of short duration”.The conversion of fixture unit loads to equivalent gallons per minute demand is alsoavailable in a tabulated form as indicated in Table 2 below:TABLE – 2Conversion of Fixture Units to Equivalent GPMDemand (Load)Fixture UnitsDemand (Load),gpm system withFlush 125170208240Demand (Load),gpm systemwith 78208240
Demand (Load)Fixture UnitsDemand (Load),gpm system withFlush 432525593769Demand (Load),gpm systemwith FlushValves267294321375432525593769Note that the relationship between gallons per minute (gpm) and fixture unit is notconstant, but varies with the number of fixture units. For example, 1000 FU is equivalentto 208 gpm, but 2000 FU is not double that, but is only 1.5 times as much, or 321 gpm.As the number of fixture units is increasing, the flowrate is not increasing linearly. Thisreflects the proper application of the theory of probability.Caution:# 1: The Hunter’s method of probability is accurate for large groups of fixtures only andits use may be inaccurate for small applications. For example, consider a branch isserving 5 water closets fitted with flush valves in a public restroom. If the hypotheticalprobability of use is set at 1%, this implies that the system will overload only one percentof the time and only two fixtures need to be “on” for the system. If three or more fixturesare in operation simultaneously, the system is automatically overloaded, and Hunter’smethod “fails”. When a system contains a large number of fixtures, one or severaladditional fixture loadings will have an insignificant effect on the system. A judicialdiscretion is advised.# 2: Even for large applications, the estimate design flow may be construed as low forsome situations. One may wonder that in a crowded environment, for example in sportfacilities and auditoriums, the demand flow rates may exceed those determined byHunter’s curve because many people will use the toilet rooms during breaks in the gameor performance.# 3: It should be kept in mind when calculating maximum probable demands, fixture unitvalues are always added and NOT the gpm values. For example, if the maximum
probable demand for two branches is required and one branch has a load of 1000 f/u’sand the other 2000 f/u’s, it would be improper to add 208 gpm 321 gpm to obtain 529gpm for the total demand. The correct procedure is to add 1000 f/u’s 2000 f/u’s toobtain a total f/u’s value of 3000 and then from Table 2 determine the correct peakdemand as 432 gpm. This value reflects the proper application of the theory ofprobability.# 4: For supply outlets that are likely to impose continuous demands, estimate thecontinuous demand separately from the intermittent demand, and add this amount ingallons per minute to the demand of the fixtures in gallons per minute.# 5: Hunter’s method provides a design demand value for a specified number of fixturesbut it does not tell us how many fixtures should be provided. The required number offixtures is dependent on the peak occupancy rate which is governed by local regulations.# 6: One disadvantage of utilizing Hunter’s curve is the elapsed time between itsconception and the technological changes. Over the past sixty years new technologiesand ideologies have been developed regarding the design of plumbing distributionsystems. An example is the movement of the industry towards low-demand fixtures. Forexample, a flush valve (Hunter’s Type fixture) in the 1940’s had a flow rate of 27 gpm,flow time of 9 seconds, and a recurrence time of 300 seconds. The probability of use ofthis fixture type was 9/300 0.03. Contemporary flush valves are currently restrained toa flow volume of 1.6 gallons over a period of 4 seconds. The reduction in flow timecauses a decrease in the probability of use to 4/300 0.013, and decrease in flow rateto 24 gpm. The reader is advised to use the table of fixture unit values in the codeapplicable to the locality of the project. The values vary slightly from code to code.Example:What is the hot, cold and total water flow rate for a group of plumbing fixtures in a smallhotel building consisting of 52 flush valve water closets, 30 flush valve urinals, and 40lavatories? The hotel requires 30 gpm for air-conditioning water makeup and 10 gpm foreach of the 3 hose bibs.
SolutionFrom Table 1, determine the FU values:FixtureQty.Fixture demand weightHot WaterCold WaterTypeTotal (Hot &Cold)WC (flush52@ ories40@ 1.5606060 f/u730 f/uvalve)Total750 f/uFrom Table 2 or Figure 1: 60 f/u 32 gpm hot water demand (for hot water demand read flush tank column) 730 f/u 175 gpm cold water demand (read flush valve column and interpolate) 750 f/u 178 gpm total water demand (read flush valve column and interpolate)The continuous demand must be added to the cold water and total water demands:Continuous Demand: Hose bibs 30 gpm Air-conditioning makeup 30 gpm Total 60 gpmThen: Hot water demand: 32 gpm Cold water demand: 174 60 234 gpm Total water demand: 178 60 238 gpmNote that the total water demand is required for sizing the water service line for thebuilding and also for the cold water piping inside the building up to the point where theconnection is taken off to the hot water heater supply.
Residential Demand Estimating ProcedureMost plumbing codes have similar requirements for sizing the plumbing water system.These requirements are designed to ensure that water fixtures will have an adequatesupply of water under normal household use. A step-wise estimating approach is:1. Determine the local plumbing code adopted by the area (UPC, SPC, BOCA, IPCor CABO).Check the applicability of the model codes to the design oralternatively, for the applicability of local municipality or jurisdictional authoritystandards. A conservative approach is to use the more stringent of the twocodes during the conceptual phase, and depending on the economics, adopt themore lenient code, if feasible, during the detailed phase.2. Begin by making a list of the type and number of fixtures that will be installed.Determine other water usage, such as fire sprinklers and/or outdoor bibs forcleaning or gardening. A reduction in the required flow rate can be considered ifthe fire sprinkler and/or outdoor service bibs can be isolated from the potablewater plumbing system.3. Refer to the sizing tables provided by the code authority having jurisdiction, orthe sizing tables of the applicable plumbing code (Table 3 below), or use Table 1to assign the fixture unit count. Following the steps above in order, will result in aconservative design.4. Using the tables, find the water supply fixture units (wsfu) rating for each fixtureand add these individual ratings to obtain a total wsfu for each house or facility.5. Use the total wsfu rating to find the required minimum flow rate (gallons perminute) from the curve (Figure 1 above), or directly from the tables. (InterpolateTable 4 below).6. If the home is equipped with fire sprinklers that cannot be isolated from thepotable water plumbing system, add an additional water demand of 26 gallonsper minute in accordance with the requirements of NFPA 13D-1994, Section 4-1.(NFPA recommends 13 gallons per minute of flow for the simultaneous operationof two sprinklers).
7. If the home is equipped with hose bibs that cannot be isolated from the potablewater plumbing system, assume a water demand of 10 gallons per minute forone nozzle hose bib operation at a time. For gardening or irrigational use, anadditional flow of 10 gallons per minute should be added to the calculated peakhour demand (PHD) for each acre of land use.8. Since a hose bib does not result in a consistent demand, add 10 gallons perminute to the value calculated in Step 5 to obtain the peak water requirementsand appropriate pump sizing.9. Since firewater is not a consistent demand, use a minimum of 26 gallons perminute, or the maximum valve calculated in Step 8, to obtain the minimum waterrequirements and appropriate pump sizing.Illustration:Plumbing Flow Estimation using model codesStep # 1Determine the total number of water supply fixture units for all water fixtures to besupplied by the plumbing system. Use Table 3 below:TABLE – 3Fixture Units as Defined by Plumbing CodesUPC CodesCABO CodesSPC & IPCCodesFixture UnitsFixture UnitsFixture UnitsBathtub (with/without overheadshowerShower StallLavatoryWater Closet (tank type)Kitchen SinkDishwasherClothes washerHose Bibb (outdoor faucet)Combinedhot & cold4.0Combinedhot & cold1.4Combined hot& ose Bibb-each tion-Type of Fixtures
Step # 2After summing the fixture units of the individual water fixtures, use Table 4 below to findthe minimum required flow rate.TABLE – 4Fixture Unit V/s Probable Flow RateTotal Fixture Units7.589101214151618202530UPC CodesCABO CodesRequiredWaterRequiredWaterSPC & 018.018.819.621.523.3Source of Data:1. Fixture Units- UPC Table 6-4, 1997 edition, & values based on individual dwelling2. Flow Rate- UPC, Chart A-3, Appendix C, 1997 edition, section A2.13. Fixture Units- CABO Table 3409, 1995 edition4. Flow Rate- CABO Table 3409, 1995 edition5. Fixture Units- SPC Table F101B, 1997 edition, & IPC Table E101B, 1995 edition6. Flow Rate- SPC Table F102, 1997 edition, & IPC Table E102 1995 edition
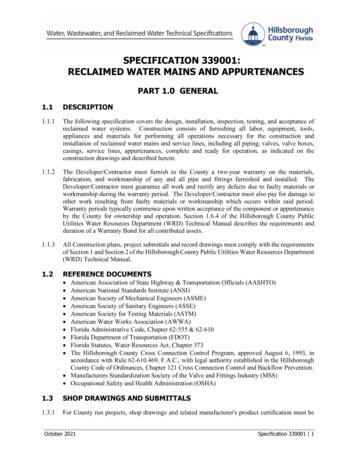
PART IIESTIMATING NON-RESIDENTIAL WATER SYSTEM DEMANDIndustrial, commercial, or other nonresidential water demands should be separated fromresidential demands.Non-residential water demand can include:1. Small-scale buildings that are not typical single-family houses but comprised ofbuildings such as apartments, condominiums, motels, and trailer parks.2. Commercial facilities including hotels, shopping centers, retail/wholesalebusinesses, restaurants, public and office buildings.3. Industrial customers that require process water.4. Public facilities such as schools, public hospitals, governmental offices, parks,landscaped roads, and cemeteries.5. Landscaping such as farms, gardens, horticulture, irrigated crops etc.6. Recreational users including campgrounds, RV parks, seasonal rental units, etc.American Water Works Association – “Fixture Value Method”AWWA method is typically used in sizing the water service lines for non-residentialdemands. Also known as the “Fixture Value Method”, this method is presented in theAWWA M22 Manual titled, “Sizing Water Service Lines and Water Meters”.This method is an empirically derived approach that rely on the actual measured data;both the independent variable (fixture value) and the dependent variable (average peakflow rate) for specific building categories. Using the mechanical data loggers, the AWWAwas able to compile peak flow measurements for different customer classes includingthe small scale buildings, hotels, hospitals, commercial, and public buildings. Peakdemand graphs were created by plotting the measured average peak flow rates percustomer class versus the cumulated fixture value. The resulting pair of graphsrepresents “Probable customer peak water demands vs. Fixture values”. These curvesdepict “low-range” (under 1,300 combined fixture values) and “high-range” (up to 13,000combined fixture values) conditions. Various classes are shown on different curves andallow the fixture value method to account for the diverse water usage characteristics ofdifferent customer types.
The M22 manual also states that these values “represent the peak flow in gallons perminute of each fixture or appliance when it is operated without the interference of otherfixtures at 60 psi”. This approach yields fixture values that are specific to each fixturetype and are represented in gallons per minute. For example, the M22 Manual suggestsa fixture value of 35 gpm and 4 gpm for water closets with flush valves and flush tanks,respectively. Designers can also modify fixture values based on personal preference.The application of fixture values to peak demand loadings is quite different than Hunter’stechnique.Procedures for Estimating Non-Residential Demands using M22 ManualThe M22 Manual lists the following procedure estimating customer demand:1) Required system characteristics: Pressure at the water meter outlet Type of customer (i.e. customer class) Number and type of fixtures2) Determine combined fixture value: Total the number of simil
The model universal plumbing codes list minimum requirements for potable water systems based on probability theory. The five model plumbing code agencies in the United Sates are: 1. Uniform Plumbing Code (UPC); adopted mainly in the western U.S. 2. Standard Plumbing Code (SPC); adopted mainly in the southern U.S. 3.