Transcription
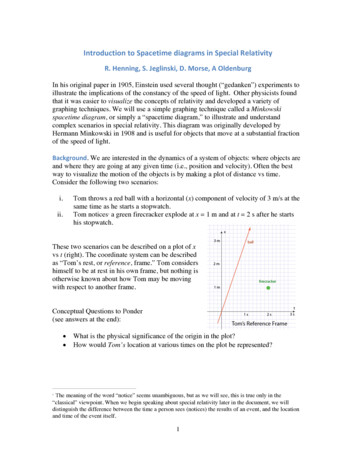
Introduction to Spacetime diagrams in Special RelativityR. Henning, S. Jeglinski, D. Morse, A OldenburgIn his original paper in 1905, Einstein used several thought (“gedanken”) experiments toillustrate the implications of the constancy of the speed of light. Other physicists foundthat it was easier to visualize the concepts of relativity and developed a variety ofgraphing techniques. We will use a simple graphing technique called a Minkowskispacetime diagram, or simply a “spacetime diagram,” to illustrate and understandcomplex scenarios in special relativity. This diagram was originally developed byHermann Minkowski in 1908 and is useful for objects that move at a substantial fractionof the speed of light.Background. We are interested in the dynamics of a system of objects: where objects areand where they are going at any given time (i.e., position and velocity). Often the bestway to visualize the motion of the objects is by making a plot of distance vs time.Consider the following two scenarios:i.ii.Tom throws a red ball with a horizontal (x) component of velocity of 3 m/s at thesame time as he starts a stopwatch.Tom notices a green firecracker explode at x 1 m and at t 2 s after he startshis stopwatch.1These two scenarios can be described on a plot of xvs t (right). The coordinate system can be describedas “Tom’s rest, or reference, frame.” Tom considershimself to be at rest in his own frame, but nothing isotherwise known about how Tom may be movingwith respect to another frame.Conceptual Questions to Ponder(see answers at the end): What is the physical significance of the origin in the plot?How would Tom’s location at various times on the plot be represented?The meaning of the word “notice” seems unambiguous, but as we will see, this is true only in the“classical” viewpoint. When we begin speaking about special relativity later in the document, we willdistinguish the difference between the time a person sees (notices) the results of an event, and the locationand time of the event itself.11
Let’s now assume Tom sees his good friend Sarah cruising down the road at 2 m/stowards him She is moving along his x-axis and the red ball he threw is on a collisioncourse with her. As it happens, Sarah is 6 m away from Tom when he throws the ball,and it takes her one second to react after he has thrown the red ball, at which time shestarts her own stopwatch. What does the above distance vs time plot look like fromSarah’s frame of reference?Before we answer this question, itwill help to superimpose Sarah’smotion onto Tom’s plot:From Tom’s perspective, Sarah (blue)is moving at –2 m/s as the red ball hethrew moves in her direction at 3m/s. From simple constantacceleration kinematics, we find thatthe red ball meets Sarah at(t 1.2s, x 3.6 m) in Tom’s referenceframe. Sarah continues to approachand reaches Tom’s location at t 3 s.In contrast, Sarah considers herself tobe at rest. She sees Tom moving inher direction at 2 m/s and the red ballmoving in her direction at 2 3 5 m/s.To prove this result mathematically,we note a connection to the relativemotion vector equation: v13 v12 v23It is traditional to distinguish the tworeference frames by labeling one with primes; Tom’s reference frame is referred to as S,and Sarah’s as S'. Assign the red ball to subscript 1, and subscripts 2 and 3 to therespective reference frames. Then, v1S v1S ' vS 'S 3 m/s v1S ' (–2 m/s) v1S ' 5 m/sWe can now think about drawing Sarah’s plot, but we need more information to lock itdown: Tom’s “time zero” is one second before Sarah’s “time zero.” This means that thenumbers on Sarah’s stopwatch lag the same numbers on Tom’s stopwatch. To properlylocate this relationship on Sarah’s plot, we note that the red ball is 1 m away from herwhen she starts her stopwatch. Using the same constant-acceleration kinematics as inTom’s case, we find that the red ball meets Sarah at (t' 0.2 s, x' 0 m) in Sarah’scoordinate system.2
To complete the picture, Sarahnotices the firecracker at t' 1 s,as opposed to Tom’s t 2 s(because she started herstopwatch later).The firecracker is 1 m in frontof Tom and thus 5 m in front ofSarah when he throws the redball, but it doesn’t explode until2 s after. During this time, Sarahhas moved 4 m in Tom’sdirection. The firecracker istherefore at her 1 m markaccording to Sarah.The final result from Sarah’sframe of reference is shown tothe right. In this case, the bluetrajectory is Tom’s motion inSarah’s frame.In either reference frame, the 2m/s value describes the relativespeed of the reference frames(v ). In this example, thisrelative speed is a “closing”speed. Notice that the same redball appears to have differentspeeds in each reference frame,because Tom and Sarah aremoving with respect to each other.S’SSarah’s plot depicts exactly the same occurrences as Tom’s plot. These occurrences arewhat we will soon call “events.” The conversion of the description from one referenceframe (Tom’s) to another (Sarah’s) is known as a “Galilean transformation.” Thefollowing features characterize this transformation: The frames of reference are moving with respect to each other at a constant velocity.The position coordinate (x) of an event in one frame will typically have a differentposition coordinate (x') in another frame.The time coordinate (t) of an event in one frame may have a different timecoordinate (t') in another frame, but the passage of time will be the same in bothframes (Δt Δt').Objects with a velocity in one frame will have a different velocity in anotherframe.3
The Galilean Transformation comprised our understanding of relative motion and howmeasurements compare between frames up until 1905, when Einstein first published hispaper on special relativity. In most applications, Galilean transformations remain correctto a very high accuracy; however, one fundamental observational fact, that the speed oflight is measured to be the same in all reference frames, forces us to modify the Galileanideas and gives rise to some very interesting and non-intuitive results when two referenceframes are moving relative to one another at speeds significant compared to the speed oflight.To begin our own “transformation” to this new way of thinking, we first introduce someimportant terminology, and then modify our use of these Galilean kinematics plots to ouradvantage.Terminology. In the jargon of spacetime diagrams, the green point on Tom’s and Sarah’splots is an event and the red or blue trajectories are worldlines.An event is anything that can be characterized by a single point on a spacetime diagram(or on a position vs time graph). An event must have both a time and a place, andspecifically refers to where and when the event actually happened within that referenceframe. We distinguish this from when an event is seen or noticed – seeing or noticing anevent is actually a second event with its own time and place. Examples of events includethe point in time and space at which Tom threw the red ball, as well as the point and timewhen the ball collides with Sarah. Yet another event is when and where the firecrackerexploded, and still another event is when and where Tom sees the light from thefirecracker explosion. All of the events are known to occur by both Tom and Sarah, buteach of them will consider the events to have different time and position coordinates intheir respective frames.A worldline can be defined as ‘a curve in spacetime joining the positions of a particlethroughout its existence.’ Each object has its own worldline within a given referenceframe. The worldline thus describes the entire history and future of the object. Aworldline is composed of an infinite continuum of events (e.g., the location of the red ballat one time, the location of the red ball an infinitesimal time later, ad infinitum) anddescribes the motion of an object within that reference frame. Objects moving at aconstant speed have straight worldlines. Objects that accelerate have curved worldlines;however, we typically won’t consider accelerations in our treatment of special relativity.Building a Spacetime Diagram. Most of the problems we will consider in specialrelativity only have one relevant position coordinate, which is the direction of relativemotion between objects we wish to study. We call this coordinate x and plot it on thehorizontal axis. We plot time on the vertical axis. This is reversed compared to what youare used to, but as we work through some examples, you will see that this is sensible forrelativistic scenarios. In addition to this reversal, there is one other important difference:time is rescaled by the speed of light; that is, ct (rather than t) is plotted on the verticalaxis. As a consequence, the unit of time is replaced by its meter equivalent, so that both4
axes are measured in the same units. As a result, the time “1 s” is replaced by “thedistance light travels in 1 s.”To obtain a worldline in the new system of units, start with the known equation of motionand then manipulate it in a way that is useful for our purposes, but does not change thecontent of the equation. To wit:vx vt x (ct)cBecause we want ct on the y-axis, the velocity term is moved to the opposite side toobtaincct xvThis equation tells us that the slope of the worldline of an object traveling at velocity vrelative to a frame S is c/v.The red ball on a spacetime diagram inTom’s reference frame then looks likethe figure to the right. In this example,the red ball is moving very slowlycompared to the speed of light. Thusthe two axes are most naturallypresented with scales that differ byeight orders of magnitude; however, inproblems that are interesting from theperspective of special relativity, thescale of the two axes (x and ct) will beof comparable size.Here are some key concepts required to draw correct spacetime diagrams: A spacetime diagram applies to a specific reference frame. You can draw a spacetimediagram for any reference frame, but the diagram will not look the same when drawnin a different reference frame.Events on any horizontal line have the same value for t and are simultaneous in thereference frame.Events on any vertical line have the same value for x and thus occur at the sameposition.The spacetime origin (x 0, t 0) is the present time and location of the observercentered in this reference frame. Events with t 0 are in the future and events with t 0 are in the past of this observer.The location of the origin can be chosen to make the solution of a problem asconvenient as possible, just as for regular kinematics.We present below two examples of drawing spacetime diagrams to help clarify. Yourfirst Relativity studio will refer to these examples, so it is important that you read them.5
Scooby and ShaggyScooby and Shaggy, stationed at a remote astrophysical observatory, are tasked withmonitoring the life cycle of nearby stars. Scooby looks out the window just in time to seea distant star go nova. He checks his charts and learns that that particular star is 1.8billion km away. Shaggy immediately jumps in his shaggyship and jets away at hismaximum speed of 0.5c towards the star. Thirty minutes later Scooby observes yetanother star go nova; this one is 2.7 billion km away in the opposite direction. Scoobyimmediately signals Shaggy on the radio to let him know about the second nova. Whenhe receives the transmission, Shaggy decides that the latter explosion is of greaterscientific interest so he slams on the brakes and reverses direction towards the remnantsof the second star. Our goal is to describe these events with a spacetime diagram.Because it initially seems like the simplest approach, we select Scooby’s reference framefor the spacetime diagram. We choose to define t 0 as the time when Scooby sees thefirst star explode (in general, note the extreme importance of distinguishing betweenwhen an event occurs and when it is observed). The events and worldlines providedexplicitly in the example are shown below in Scooby’s frame of reference:The locations of the stars areknown independently fromScooby’s star charts. Forreference, the tick marks are6 10 meters (0.6 billion km)apart. Their worldlines are shownin dotted form and are consideredto be at rest with respect toScooby’s observatory.11The red eye is the event “Scoobysees the 1 star explode.”stThe blue eye is the event “Scoobysees the 2 star explode.”ndConceptual Question to Ponder:Does it make sense that thesecond event is approximately 1tick mark (6 10 meters) alongthe ct-axis from the first event?(see answer at the end).116
From the above starting diagramwe can trace the world lines ofthe light given off from the novaeexplosions to figure out exactlywhen the stars self-destructed.The worldlines of light (sincelight moves at speed c) alwayshave a slope of 1. These aresuperimposed on the diagram.The diagram immediatelyinforms us that, in Scooby’sframe of reference, Star 2exploded first, and Star 1 second,even though Scooby sees theevents in the reverse order. Thediagram immediately shows whythis is the case: light from star 1has to travel a smaller distance.The next step is to add Shaggyand the radio communication tothe spacetime diagram.Shaggy’s initial speed is 0.5c,which has a slope of 2 on thediagram (brown worldline). Theradio signal (slope 1, yellow)on its way to Shaggy’s headsetis not sent until Scooby sees thesecond nova:7
When Shaggy gets the signal to turnaround, we add in the worldline for thelast leg of his journey. Shaggy hasreversed direction, so his new slope is–2. As a result of the reversal, heeventually returns to Scooby’s locationat a later time, and continues to thesecond nova.Given the size of the tick marks on thediagram, it is possible to determine allthe numerical values by reading themoff the diagram. At times, we will usethe equations of relativistic kinematicsto compare the results to those on thediagrams.Answers to Conceptual Questions from page 1: What is the physical significance of the origin in the plot?The origin is Tom’s position at t 0, which we’ve defined as when hestarts his stopwatch. Note that you may make a plot where time is shiftedthat still represents Tom’s reference frame; in this problem we drew theball toss starting at t 0 for our convenience. How would Tom’s location at various times on the plot be represented?Since Tom is not moving within his reference frame, he remains at x 0 atall times. Thus, his location is represented by the horizontal (time) axis.Answer to Conceptual Question from page 6: Does it make sense that the second event is approximately 1 tick mark (6 10meters) along the ct-axis from the first event?11We know that the two events are 30 minutes apart in Scooby’s referenceframe. If we calculate the distance light travels in 30 minutes:ct (3 10 m/s)(60 s/min)(30 min) 5.4 10 m/sIt’s close – the second event is slightly below the 1 tick mark.811st8
You Don’t Know Jack(will be covered in studio)Jack is sitting at a table on a spaceship that passes by a lonely blue space meteor. Therelative speed between Jack’s spaceship and the meteor is 0.9c. Jack observes the meteormoving in the direction of his negative x-axis, while an observer at rest on the meteorwould observe the spaceship moving along their positive x-axis. On board the ship withJack is a red meter stick – it rests on the table with its ends at x 1 m and 2 m. Themeter stick is at rest in Jack's reference frame; therefore, its red world line has a slope ofc/0 (infinity), which describes a vertical line. The blue space meteor, however, is movingpast Jack with a velocity of –0.9c, so its blue world line has a slope of c/(–0.9c) –1.11.Notice the advantage gained by plotting time “as a distance”: all slopes on a spacetimediagram are dimensionless (they are merely positive or negative numbers).The spacetime diagram in Jack’s referenceframe (right) shows the worldlines of the redmeter stick and the blue space meteor, as justdescribed. Jack’s location is along the ct axis, atx 0. Although Jack is at rest in theconventional sense, he is in fact traversingthrough spacetime: he is moving into his future.The black dot represents the spacetimecoordinates of the event we denote as “the timewhen and the place where the blue space meteorpasses Jack.”Imagine now that Jack’s captain, sitting in theship to Jack’s left, slides a green meter sticktowards Jack on the table at a velocity of 0.8c with respect to Jack, oriented such that it isparallel to the red stick. Jack watches the green stick slide by the red stick (very quickly!).The green stick is moving past Jack with a velocity of 0.8c, so its green worldline has aslope of c/(0.8c) 1.25. Jack starts his stopwatch (ct 0) at the moment that the left endof each of the meter stick lines up. These occurrences are shown in the figure below right.Note an interesting omission from the figure –what happened to the right end of the green meterstick? It’s missing from the figure, becausesomething peculiar happens which cannot beexplained yet: according to Jack, the right ends ofeach meter stick won’t line up at the same timethe left ends do, and the two meter sticks willappear to be different lengths. This “relativity ofsimultaneity,” and its consequence, “lengthcontraction,” will be addressed in the 2 and 3Relativity modules.ndrd9
distinguish the difference between the time a person sees (notices) the results of an event, and the location and time of the event itself. 2 Let’s now assume Tom sees his good friend Sarah cruising down the road at 2 m/s towards him She is moving alo