Transcription
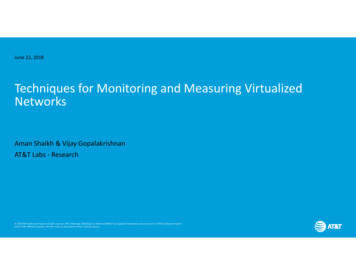
June 22, 2018Techniques for Monitoring and Measuring VirtualizedNetworksAman Shaikh & Vijay GopalakrishnanAT&T Labs ‐ Research 2018 AT&T Intellectual Property. All rights reserved. AT&T, Globe logo, Mobilizing Your World and DIRECTV are registered trademarks and service marks of AT&T Intellectual Propertyand/or AT&T affiliated companies. All other marks are the property of their respective owners.
OutlineIntroduction and Background Service‐provider and datacenter networks Introduction to Network Function Virtualization (NFV)– Software Defined Networking (SDN)Challenges General challenges in network measurements Challenges specific to NFVMeasurement and monitoring What and how of data collection Data collection and tools in today’s cloud Measurement applications: trouble‐shooting, performance improvement, verification Leveraging SDN and end‐hosts for measurementsSummary Additional Resources2
3Introduction and BackgroundWhy the move towards SDN and NFV
Network Traffic Trends*Unprecedented growth in data traffic Ten‐fold increase in traffic volume b/w 2014 and 2019Large number of diverse devices Devices becoming mobile 11.5 billion devices, including 3B IoT devices by 2019Multitude of Demanding applications ¾ of the data traffic will be video by 2019Growth of Cloud Computing Variable demand, transient applications*Source: Cisco Visual Networking Index: Global Mobile Data Traffic Forecast Update 2014‐20194
Traditional NetworkingTechnology trendsIntroducing, modifying, or scaling networking services is difficultProprietary, fixedfunction, and hardwarenature of networkappliances5High spatial andtemporal variability in“demand”, especiallycloser to the edgeThe cost of reservingthe space and energyfor a variety of networkequipmentThe cost and lack ofskilled professionals tointegrate and maintainnetwork services
Concrete Example: Cellular Network Architecture Hardware appliances supportingspecific cellular network functions– specialized, expensive6 Statically provisioned at a fewcentral locations– hard to predict load at edge,cannot repurpose
Problems with Traditional deployments7Inefficient load distributionPath InflationPerformance ImpactsLimited Customization
Problems with Traditional deployments4Inefficient load distributionPath InflationPerformance ImpactsLimited Customization
Problems with Traditional deploymentsCity A load distributionInefficientCity APath InflationCity BCity a centerhosting S/P‐GWsServerPerformance ImpactsLimited CustomizationData centerhosting S/P‐GWsInternetServer4
Problems with Traditional deploymentsInefficient load distributionCity APath InflationCity BUserCellularNetworkInternetData centerhosting S/P‐GWsServerPerformance Impacts4Limited Customization
Problems with Traditional deploymentsInefficient load distributionCity APath InflationCity BUserCellularNetworkData centerhosting S/P‐GWsInternetServerPerformance ImpactsLimited CustomizationDiverse DevicesDiverse applicationsSmartphoneFleet trackingSmart meter4Diverse NFsTranscoderIDSFirewall
Moving towards SDN and NFV 12Take advantage of advances in Cloud technologyNetwork elements are applications running on a common hardware platformReduce capital and energy expenses by consolidating network elementsSoftware as a driver to change the innovation cycleReduce time to market customer targeted and tailored services
How does it work?Virtual MachineVirtual MachineVirtual MachineVirtual MachineVirtual NetworkFunctionVirtual NetworkFunctionVirtual NetworkFunctionVirtual NetworkFunctionVirtual SwitchServer PlatformPhysical Network13
Key NFV technologyStrengths and Weaknesses
NFV Design PrinciplesSeparation of software from hardware Enable software to evolve independent from hardware, and viceversaFlexible deployment of network functions Deploy automatically network‐function software on a pool ofhardware resources Run different functions at different times in different datacentersDynamic service provisioning Scale the NFV performance dynamically and on a grow‐as‐you‐need basis Fine granularity control based on the current network conditions15
Technical Requirements16PerformanceManageability– Keep the degradation as small as possible– Different from data center networking, wherethe hardware resources are almost equivalent– Understand the maximum achievableperformance of the underlying programmablehardware– Support sharing spare resources and elasticprovisioning of network services effectivelyReliability and StabilitySecurity– Minimize service reliability and service levelagreement impacts when evolving to NFV– Share underlying networking and storage, run inother’s data center, outsource to 3rd party– Ensure service stability when reconfiguring orrelocating software‐based virtual appliances– Introduction of new elements, such asorchestrators and hypervisors
Problem with Software‐based Packet Processing17
User‐space software libraries for accelerating packet processingworkloads on Commercial Off The Shelf (COTS) hardware platformPer Core L3Performance(Mpps)Enter DPDK (Data Plane Development Kit)40302010031.21.1LinuxHigh‐performance, community‐driven solution Delivers 25X performance jump over Linux Open Source, BSD License; Vibrant community support andadoption; Comprehensive NFV and Intel architecture support User space application development; multiple models Over two‐dozen pre‐built sample applicationsPlatformDPDK WorkMALLOCDISTRIBMBUFExtns Software prefetch, Core‐thread affinity, vector instructions,Algorithmic optimizations, Hardware offload, Bulk Functions18ISV XNET3FM 10KKNIXENVIRTCisco VIC*POWERPCAPMellanox*MEMPOOLRINGTIMERHost of other techniques to improve Ds: Native &Virtual)EXACTMATCHACLClassifyMETERSCHEDQoSUser SpaceKNIIGB UIOVFIO
How does DPDK work?Driver constantly polls the NIC for packet core ispegged at 100% use Takes advantage of multiple cores on modern CPU Not all cores used for computation; Dedicate a (few) core(s)for packet processing Gets around limitations with interrupt driven packetprocessing (used by traditional NIC drivers)Provides memory management libraries forefficient packet copy Allocate large chunk of memory in application mapped toDPDK Raw packets copied directly into application memory19User‐Spacepacket processing(Event‐based)DPDK App(Poll‐based)VNF ApplicationVNF ApplicationDataplane2. System Call(read)UserSpaceDPDKDataplaneSocketAPISocket API3. System Call(write)KernelSpaceskb buf1. Interrupt& DMA1. DMAWrite2. DMARead4. DMAEthernet Driver APINICPacket BufferEthernet Driver APINICDriverNICPacket Buffer
Need for Interface SharingPhysical ServersVirtualized Servers?Network20Network
Software‐Based SharingUtilizes emulation techniques to provide a logical I/Ohardware device to the VM Interposes itself between the driver running in the guest OSand the underlying hardware (via emulation or split‐driver)Features Parses the I/O commands Translates guest addresses into host physical addresses Ensures that all referenced pages are present in memory Maps multiple I/O requests from VMs into a single I/O streamfor underlying hardwareExamples Open VSwitch (Layer‐2), Juniper Contrail (Layer‐3)Drawback Poor performance21* Source: Intel White Paper on SR‐IOV
Direct AssignmentBypasses the VM I/O emulation layer to write directlyto the memory space of a virtual machine Akin to servers’ ability to safely DMA data to directlyto/from host memory Uses enhancements like Intel VT‐d Results in throughput improvement for the VMsDrawback Limited scalability; a physical device can only be assignedto one VM* Source: Intel White Paper on SR‐IOV22
Single Root I/O Virtualization (SR‐IOV)PCI‐SIG Standard to find middle ground betweendirect attached & software‐basedStandardizes a way to bypass the hypervisorinvolvement in data movement SR‐IOV capable device appears as multiple devices,Physical or Virtual Functions (PF / VF) Provides independent memory space, interrupts, andDMA streams for each virtual machine SR‐IOV assigns one or more VF to a virtual machine SR‐IOV enables hypervisor bypass by providing theability for VMs to attach to a VF* Source: Intel White Paper on SR‐IOV23
Using SR‐IOV and DPDKExisting VNFimplementationsrely on thisapproach forperformance!24
Pros and Cons of these approachesSoftware‐based sharingHigh level of flexibility and control, easy extensibilityPreferred approach with virtualization because of recovery and migrationRecent efforts on getting better performanceSupports only subset of functions provided by the network card (NIC)Significant CPU overheadSR‐IOVProvides good network performance and sharing of network interfaceRequires support in the BIOS as well as in the operating system/hypervisorOrchestration limitations; no easy way to migrate VMsNetworking restrictions in a cloud environment (because of hypervisor bypass)25
NFV platforms/building blocksVector Packet Processor (VPP)‐ Originally from Cisco, but currently open source (fd.io) DPDK based data plane, features implemented as graph, Large code base with lots of featuresDANOS project – Started by AT&T, but now an open source project (getting set up) Provides an architecture and code to build disaggregated network functionsOther efforts: ClickOS (NSDI 2014), NFF‐Go (Intel), etc Control plane: Quagga, Free Range Routing (FRR), BIRD, GoBGP, XORP,Cellular: OpenAirInterface, OpenEPC, etc 26
ChallengesWith networks, and specifically virtualized networks
Troubleshoot the problem with this network!
Traditional Challenges in Monitoring and Measuring IP NetworksNetworks are large, complex, diverse and change constantly Not trivial to monitorScale and size of networksHundreds of locations,hundreds of thousands ofelements, millions tobillions of devicesspanning the globe29Complexity of networksNetworks are built onlayers with each layerhaving a its own quirks;and it is hard to reasonabout cross‐layer impactsDiversity of ElementsMost networks havediverse sets of devices,each differing in terms oftheir function andimplementationNetworks changeTechnology evolution,traffic demands and day‐to‐day updates causenetworks to changingconstantly
New Challenges due to NFV and SDNNetwork functions are implemented in a different way Composition and disaggregation of functions Challenge: changes how a function is monitoredAdditional components come into play Virtualization layer (e.g., hypervisor) on servers and for network, cloud management systems, Challenge: need to monitor these additional componentsMore ways in which network functions can interact Network functions running on same server affect one another’s performance Challenge: makes it harder to understand behavior of co‐hosted NFsNascent technology Move to NFV and SDN started recently; IP networks have been around for about 50 years Challenge: absence or immature monitoring and management capabilities30
Fallacies Recast to NFV** Source: Steven Wright @ Dell NFV Summit 201531
Performance BottlenecksVirtual MachineVirtual MachineVirtual MachineVirtual MachineVirtual NetworkFunctionVirtual NetworkFunctionVirtual NetworkFunctionVirtual NetworkFunctionVirtual SwitchServer PlatformPhysical Network32
Architectural Factor Impacting PerformanceStrategies: 32 lcores in total. 16 lcores are local (in thesame NUMA domain asthe NIC port)33 NUMA‐Aware: assign alocal lcore (1‐16) to a VM. Random: randomly assigna lcore to a VM. Worst Case: assign aremote lcore (17‐32) to aVM
Summary of Performance IssuesPacket Processing at line rate Architecture factors affecting packet I/O at line rate Memory allocation and packet copy Sharing the network interface card across VMsVirtual Switching between virtual network functions (VNFs) at line rate Virtual switch implementation and featuresVNF implementation and Inter‐VNF communication No hardware acceleration, Protocol details, Packet copy overheadRunning multiple VNFs on a single physical server Hardware architecture, Resource sharing, scheduling34
Chained FunctionalityFunctions are often ualization LayerPhysical ServerPacket In35Need High SpeedInter‐Function (VM) CommunicationPacket Out
Architectural Variations hroughL2‐SwitchL2‐SwitchNIC (SR‐IOV)Neither can achieve full line‐rate in VMs– Flexible(dynamic) Configuration– Max 63 virtual functions (tx/rx)– Control over packet switching– Static configuration– Control over load balancing– Inter‐VM switch is limited per port– Has more overhead– No control over packet switching– No control over load balancing36
Enter NetVM NetVM (with DPDK) runs in hypervisor User SpaceEach VM has its own ring to receive/transmit apacket descriptorPacket directly DMAs into huge page memory– Applications in VM receive references (location) via shared ringbuffers– Applications decide an action: chain to another VM, send out,discardApplications in VMs pass packet references to otherVMLockless design with core‐queue matching(horizontal cores) and data structure separation(vertical cores)NetVM can achieve full line‐rate in chained VMs37
Virtual Switching LimitationsInitial virtual switching implementations too slow Involves a packet copy from the Tap Device to the virtio frontend inthe Guest, via the backend Vhost module in the host kernelVirtual Machine (VM)DPDKuserE1000VFVirtioivshm DPDKivshm VirtioVFE1000userkernelVFkernelVirtioVFControl &Mgmt Virtio for Linux needs to cross kernel boundary to access user spaceVirtual Machine (VM)GuestPoor performance for VM Linux (kernel) virtio loopback 700kppsVirtioQEMUQEMUVirtual Machine Monitor(VMM) OVS kernel code responsible for packet I/O, tunneling, etc. Packet need to cross kernel boundaryuserovsdb-serverHostOpen vSwtich also slowovs-vswitchdnetlinkkernelvHost-netTAPKVMOVS Kernel Moduleopenvswitch.koIntel VT-dServerVF VFLeads to slow VM‐VM access38PF10 GbE 82599(SRIOV)
Accelerating Open vSwitch with DPDKOpen vSwtich OVS kernel code responsible for packet I/O, tunneling, etc.GuestVirtual Machine (VM)DPDK additionVFControl &Mgmt VM communications via IVSHM model Multi‐threaded OVS– DPDK PMD with RSS (Receive Side Scaling) can distribute packets tocores– Flow classification helped by DPDK exact match rkernelVirtioQEMUVirtual Machine Monitor(VMM)VFShared Memory(IVSHM)Shared Memory1G(IVSHM)/ 2M 1G / 2MVirtioQEMU3ovs‐vswitchduserHost DPDK memory allocation with Hugepages (1G) reducesTLB thrashing VirtioDPDKuserkernel DPDK PMD takes on packet I/O– Some loss of functionality e.g. TunnelsVirtual Machine (VM)ovsdb‐serverVirtio backend2DPDKUserspace vHost-netPFkernelKVMServerVMDqVF VFL2 SwitchPF110 GbE 82599(SRIOV)
Other Notable Soft‐Switch EffortsRoutebricks – Using software and servers for routing and forwarding Basis for much of the enhancements from Intel on packet processingNetmap ‐ Research efforts from Univ. of Piza for packet processing (similar to DPDK) Vale is a software switch implementation based on NetmapmSwitch – Modular software switch with good performance (Best Paper SOSR’15)BESS – Modular packet processing pipeline graph, with each node performing a functionClick Modular Router, Juniper Contrail, 40
Measurement and MonitoringWhat type of data can be collected?
Why sign and PlanningMaintenance and UpgradesSecurity
Typical Operational ProcessAnalyze the data todetermine anomaliesor other conditionsCorrelate data todetermine rootcause(s)DetermineAppropriate courseof action(s)ActionTriggerControlCollect differentkinds of data usingcollectors or othertoolsLoopControllerOrOrchestratorDataControl ActionVNF/PNF43
Measurement IdealismMeasure everything with zero overhead Input to the network:– Traffic, commands, (surrounding) environment Response from the network:– Change in the internal state resource consumption Output:– Traffic, answers, changes to externally visible state of the networkNo such thing as “zero overhead” measurements Corollary: measure as much as possible with as little overhead as possible44
NetSight: Achieving Measurement Idealism for Network Traffic*Goal: capture packet history for every packet at every hop Packet history path taken by the packet header modifications switch state encounteredNetSight Captures packet histories– Every switch sends a postcard to NetSight Infrastructure– Postcard contains packet header, switch ID, output port(s) and version number for switch forwarding state Provides a query language for applications to concisely and flexibly retrieve packet histories of interestPaper shows feasibility and practicality of NetSight on Stanford backbone network Average path‐length: 5 hops, average packet‐size: 1031 bytes Overhead of NetSight: 3% extra trafficAT&T’s network: Carries more than 150 petabytes on an average business day as of December 2016** Overhead of NetSight: 4.5 Petabytes/day *I know what your packets did last hop: Using Packet Histories to Troubleshoot Networks, USENIX NSDI 201445** f‐builder/people/network‐reliability.html
Active v/s Passive Network MonitoringPassive Monitoring Collect different types of data and infer what is going on Let network function provide information “on their own” Examples: SNMP, Syslog, IPFIX/NetFlow, sFlow, control‐plane monitorsActive Monitoring Inject packets into network for desired measurements Examples: Ping, Traceroute, iPerf46
SNMP (Simple Network Management Protocol)Purpose Collect information from network functions about traffic and state Get notification of eventsHow Information organization– Hierarchical and extensible structures called Management Information Base (MIB) SNMP Manager Image source: ‐and‐net‐snmp.html– queries network function for specific information periodically– receives traps for desired eventsLimitations Periodic query of information means sampling Data can get lost Have to go through IETF to standardize new information47Image source: https://docs.oracle.com/cd/E13203 01/tuxedo/tux81/snmpmref/1tmib.htm
SyslogPurpose Allow network functions to convey errors, warnings, information via {key, value} pairs or textual messagesHow Content conveyed between syslog applications: generators, relays and collectors Generators, relays and collectors can be on same or different network functionsLimitations Lack of standardization in how content is formatted Content is transported in an unreliable manner48
Netflow / IPFIX (IP Flow Information Export)Purpose Gather information about amount of traffic on a per‐flow basis– Flow source address, destination address, source port, destination port, transport protocolHow Each router IPFIXExporterIPFIXMessage– samples 1 out of N packet and updates count for the flow– sends flow record to one or more collectors upon flow completion or time‐out IETF‐standardized protocol based on Cisco‐proprietary NetflowLimitations Sampling leads to information loss, especially for flows with low traffic volume Does not provide any information about the traffic content49IPFIXCollector
sFlow (Sampled Flow)Purpose Gather information about individual packets within trafficHow Routers sample and truncate packets before sending them to a collector– Packets to be sampled can be specified through configuration Routers also send number of packets sent/received Information is sent over UDPLimitations Sampling leads to information loss50Image source: https://kb.juniper.net/InfoCenter/index?page content&id KB14855
FlowRadar: IPFIX/Netflow for Data‐centers*Problem with running IPFIX/Netflow in data‐centers Running IPFIX exporter on switches place is enormously expensiveGoal of FlowRadar: report counters for all flows at fine‐grained time granularity Mirroring packets from switches to a collector puts enormous burden on network and collectorFlowRadar Key Idea:Overhead atthe collectorMirroring Division of labor between switches and collectorLow memoryusageFlowRadarIPFIX/NetFlowFixed per‐packetoperations51* FlowRadar: A Better NetFlow for Data Centers, USENIX NSDI 2016Overhead atthe switches
FlowRadar DetailsHow FlowRadar performs division of labor At every switch– Encode per‐flow counter in an efficient data‐structure Use of Invertible Bloom Lookup Table– Easy to implement in merchant silicon– Fixed operations in hardware– Small memory requirement: 2.36 MB for 100,000 flows– Export encoded flow‐set every 10 ms to collector At the collector– Decode flow‐sets to determine per‐flow counters Leverage information from multiple switchesPrototype implementation in P4 simulator Two use‐cases on top of FlowRadar Transient loop/blackhole detection Per‐flow loss map52
Route MonitoringPurpose Determine how packets are routed in (traditional) networksBGP speakerHow Collect routing messages from routers by establishing a peering sessionBGP message Use BGP‐LS (link‐state) and BMP (BGP Monitoring Protocol)– BGP‐LS: inject topology changes conveyed by IGP into BGP– BMP: BGP info is conveyed to a collectorBenefits Allows tracking of control‐plane state in (near) real‐time Provides visibility into how routers are forwarding trafficLimitations Places extra load on routers53BGP messageBGP Collector
Programmable Packet CapturePurpose Capture packets traversing a network function matching specified criteriaHow Capture packets arriving or leaving an interface in the kernel– Several libraries allow packet capture libpcap (Unix), Berkeley Packet Filter (BPF), Data Link Provider Interface (DLPI), SOCKET PACKET sockets (Linux only)– Several tools exist for processing and exploring packet captures (real‐time or off‐line) tcpdump, wireshark, Limitations Requires privileged (root) access ‐ privacy and security concerns High overhead (especially on high‐bandwidth links)54
Active Measurement: Ping, Traceroute, iPerfPurpose Determine reachability, path and bandwidth/latency to a destinationHow Ping– Sender sends ICMP echo request packets; destination responds with an echo reply packet Traceroute: Exploits TTL expiry mechanism to determine path– IP/MPLS packets have a TTL (Time To Live) which is decremented by every router along the path– If TTL reaches zero, the router drops packet and sends ICMP TTL Exceeded message back to sender– Sender sends first packet with TTL 1 which elicits response from first router along the path Continues sending packets with increasing TTL eliciting responses from router along the path iPerf: tool for active measurements of the maximum achievable bandwidth on IP networks– Reports the bandwidth, loss and other parametersImage source: andLimitation Places overhead on the network iPerf requires a process running on the server55
SDN Traceroute*Main idea Inject a probe packet at ingress switch Program SDN switches so that a probe packet goes alternatively between controller and switches Allows controller to record the path taken by the probe packetHow SDN controller programs switches Assign tags to switches where no two adjacent switches share the same tag– Vertex coloring problem Adds highest priority rules to every switch– If a packet comes in with any tag other than switch's own tag, send to controller– If a packet comes switch's own tag, forward along the normal next‐hop56* SDN Traceroute: Tracing SDN Forwarding without Changing Network Behavior, ACM Sigcomm HotSDN 2014
SDN Traceroute Data‐plane: Controller Inserts Probe Packet into Network57SDN Traceroute: Tracing SDN Forwarding without Changing Network Behavior, ACM Sigcomm HotSDN 2014
SDN Traceroute Data‐plane: First Switch Forwards Packet to Second Switch58SDN Traceroute: Tracing SDN Forwarding without Changing Network Behavior, ACM Sigcomm HotSDN 2014
SDN Traceroute Data‐plane: Second Switch Sends Packet to Controller59SDN Traceroute: Tracing SDN Forwarding without Changing Network Behavior, ACM Sigcomm HotSDN 2014
SDN Traceroute Data‐plane: Controller Returns Packet to Second Switch60SDN Traceroute: Tracing SDN Forwarding without Changing Network Behavior, ACM Sigcomm HotSDN 2014
SDN Traceroute Data‐plane: Second Switch Forwards Packet to Third Switch61SDN Traceroute: Tracing SDN Forwarding without Changing Network Behavior, ACM Sigcomm HotSDN 2014
Measurements Along a Path in SDN**Compiling Path Queries, USENIX NSDI 201662
How the Path Querying System WorksCompiling Path Queries, USENIX NSDI 201663
Software ProfilingPurpose Analyze performance and resource usage of a running programHow Instrument the source‐code or binary of a program using a profiler tool Determine memory usage, time complexity, usage of particular instructions, or frequency and duration offunction calls Example: OProfile, an open source statistical profiler for Linux systemsLimitation Provides details of program run‐time and resource usage, but overhead can skew its performance64
Software TracingPurpose Record details of program execution for debugging and trouble‐shootingHow Trace execution of a program to identify source of problems– Write low‐level details and messages while the program executes, geared towards developers Example: LTTng (Linux Trace Toolkit next generation), a tracing framework for applications– For applications written in C/C , Java, Python, Limitation Can slow execution of the program65
Measurement and MonitoringData Collection and Tools in Today’s Cloud
A Study of Issues in Cloud Systems*Issues opened by users for six cloud‐based systems: Hadoop MapReduce, Hadoop File System (HDFS), HBase, Cassandra,ZooKeeper and Flume Issues submitted over three yearsClassification of issues across various dimensions Examples:– Bug scope (single machine, multiple machines, entire cluster),– Hardware (core/processor, disk, memory, network, node)– Software (logic, error handling, optimization, config, race, hang, space, load)Cloud Bug Study Database: http://ucare.cs.uchicago.edu/projects/cbs/* What Bugs Live in the Cloud? A Study of 3000 Issues in Cloud Systems, ACM SoCC 201467
Amazon CloudWatch* and CloudWatch **CloudWatch monitors EC2 resources and applications in real‐time Allows users to (a) collect and track metrics, (b) define policies on the metrics Several metrics are available (e.g., CPU, Disk, network, etc.)– Metrics are organized into namespaces (e.g., name‐space: AWS/EC2 for above metrics)– Metrics have dimension which can be used to filter statistics collection based on name/value pairsCloudWatch : Application‐aware web latency monitor for cloud tenants Two components:– uCluster: automatically classifies web requests into applications based on the URL clustering– Anomaly Detector: identifies time‐periods with anomalous latency based on a threshold68* Guide: t/monitoring/acw‐ug.pdf#cloudwatch architecture** Application‐Aware Latency Monitoring for Cloud Tenants via CloudWatch , IEEE CNSM 2014
Network Performance in Amazon EC2 [Infocom 2014]Conducted analysis of networking performance for VMs in Amazon EC2 Metrics: throughput, delay and packet loss Transport protocols: TCP and UDPFindings Performance of some VMs is worse than other VMs Variation and degradation is due to the role played by CPU scheduler for handing computation tasks andnetworking tasks (e.g., copying packets between physical NICs and VMs)How to mitigate the issue? CPUs are divided into two pools:– Pool for network‐intensive VMs– Pool for compute‐intensive VMs69
Monitoring in Microsoft Azure*Allows users to collect various metrics, activity logs and diagnostic logs Deep application monitoring (application insights) and Deep infrastructure monitoring (log analytics,management solutions, network monitoring, service map) Core monitoring (azure monitor, advisor, service health and activity log) Shared capabilities (alerts, dashboards, metrics exporter)NetPoirot: Fault‐localization based on TCP statistics collected at end‐hosts (Sigcomm 2016) Fault localization happens at the granularity of client, server or network– Fine‐grained localization and root‐cause analysis performed by administrators Use of machine learning algorithm for classifying observed TCP stats into fault localization classes– Supervised learning on 132 numeric values collected every 30 seconds for each TCP connection Metric collection is done by NetPoirot agents running on VMs (or hypervisors)– Prototype implementation for Windows and is deployed in Microsoft Azure production cloud*Guide: f/monitoring‐and‐diagnostics/toc.pdf?branch live70
Monitoring in Microsoft Azure (Cont’d)Pingmesh: active probing between pairs of servers in a data‐center [Sigcomm 2015] Forms multiple levels of complete graphs, and then performs pings within these graphs Helps define and track service level agreements (SLAs), determine if issue is related to network Allows determining issues like network latency, packet drop rate, silent packet drops, etcEverFlow: allows tracing of specific packets; implements packet filter on top of "match andmirror" functionality of commodity switches [Sigcomm 2015] Match and Mirror important packets– TCP packets with SYN, FIN and RST flags, desired packet with a debug bit in header, packets belonging to control‐plane protocols such as BGP Allows insertion of pro
Physical or Virtual Functions (PF / VF) Provides independent memory space, interrupts, and DMA streams for each virtual machine SR‐IOV assigns one or more VF to a virtual machine SR‐IOV enables hypervisor bypass by providing the ability for VMs to attach to a VF 23