Transcription
ACCESS TO NEW MEDICINESIN PUBLIC DRUG PLANS:Canada and Comparable Countries2016 ANNUAL REPORT
Authors:Brad Millson1, Sherri Thiele1, Yvonne Zhang1, Wendy Dobson-Belaire1, Brett Skinner2Author Affiliations:1IMS Health Canada Inc., 16720 Trans-Canada Highway, Kirkland, Quebec H9H 5M3Innovative Medicines Canada, 55 Metcalfe Street, Suite 1220, Ottawa, Ontario K1P 6L52Foreword provided by:Russell Williams, President, Innovative Medicines Canada
Table of ContentsForward. . . . . . . . . . . . . . . . . . . . . . . . . . . . . . . . . . . . . . . . . . . . . . . . . . . . . . . . 1Summary . . . . . . . . . . . . . . . . . . . . . . . . . . . . . . . . . . . . . . . . . . . . . . . . . . . . . . 2Highlights. . . . . . . . . . . . . . . . . . . . . . . . . . . . . . . . . . . . . . . . . . . . . . . . . . . . . . 51.0 About the Report. . . . . . . . . . . . . . . . . . . . . . . . . . . . . . . . . . . . . . . . . . . . . 72.0 Health Systems: Structure and Design. . . . . . . . . . . . . . . . . . . . . . . . . . . 133.0 Results: Comparing Access To New Medicines In Public Drug Plans . . 164.0 Conclusion. . . . . . . . . . . . . . . . . . . . . . . . . . . . . . . . . . . . . . . . . . . . . . . . . 235.0 Appendix. . . . . . . . . . . . . . . . . . . . . . . . . . . . . . . . . . . . . . . . . . . . . . . . . . 246.0 About Innovative Medicines Canada . . . . . . . . . . . . . . . . . . . . . . . . . . . . 32
FORWARDTo the reader,Innovative Medicines Canada is pleased to publishOur member companies support 31,000 highthe 2016 edition of our annual report comparingquality jobs, contribute 3.8 billion dollars to ourcoverage for new medicines under public drugeconomy, and invest over one billion dollars inplans in Canada and other countries. Since 2006,research and development each year.Innovative Medicines Canada has been examiningaccess to new medicines in a global context inToday, we have in hand the tools we need toorder to gauge the performance of Canada’smanage and often cure diseases. With personalizedhealthcare system. The findings of this reportmedicine, we are further targeting therapies toprovide important information that has practicalpatients’ genetic makeup and minimizing sideimplications for the health of Canadians.effects. People are living full, productive lives wherefor many, that wasn’t an option even just a fewAccording to the World Health Organization (WHO),years ago.access to medicines and vaccines is a keycomponent to a quality health system. There is noGlobally, there are over 7,000 new medicines indoubt that innovation in medicines and vaccinesdevelopment. There are 1,800 oncology medicineshas made a significant contribution to improvingin development. Five hundred in mental health, andhealth outcomes in Canada and around the world.nearly 1,400 in neurological disorders. Over 1,200It is therefore important for Canadians to know themedicines are in development to fight infectiousstate of access to new medicines in their country,diseases, 600 to manage cardiovascular disorders,relative to comparable countries. The goal of this475 for diabetes and 1,120 for immune disorders.study is to measure access against internationalbenchmarks in order to drive improvements toFair and equitable access to innovative medicinesacross the country means that Canadians canaccess here at home.benefit from a world-class healthcare system whereInnovative Medicines Canada is committed tocutting-edge treatments can turn chronic,engaging in policy issues from an evidence-baseddebilitating and sometimes life-threateningperspective. Our industry is also an important partillnesses into a thing of the past.of Canada’s life sciences sector, and our companiesplay a critical role in the Canadian economy.Russell WilliamsPresidentAccess to New Medicines in Public Drug Plans: Canada and Comparable Countries1
SUMMARYInnovative medicines make an importantplans in the wealthiest Organization for Economiccontribution to achieving good health. It is thereforeCo-operation and Development (OECD) countriesimportant that Canadians are well-informed about(for which complete data were available) accordingthe state of access to new medicines in Canada.to the drug approvals, commercial launch rates,For this reason, Innovative Medicines Canadapublic reimbursement rates, scope of reimbursementannually examines how well Canada’s public drugand wait times for reimbursement in each country.plans are performing on access to new medicinesIn total 18 countries were included. Based oncompared to public drug plans in other countries.feedback and discussions following the release of1the 2015 Annual Report, Innovative MedicinesIn 2014 Innovative Medicines Canada partneredCanada decided to continue this partnership withwith IMS Health to develop a sophisticated andIMS Health to provide an updated study includingtransparent methodology using data compiled bya total of 20 OECD countries and a refinedIMS Health which was published as part of themethodology.2015 Annual Report. The study examined accessto new medicines in the context of the health careThis study compares public drug plan coveragesystems across a group of countries that are mostagainst the particular basket of new medicinescomparable to Canada in terms of economicapproved for sale within each country. All newdevelopment. Specifically, the report comparedmolecular entities (NMEs) or combinations containingcoverage for new medicines under public drugat least one new NME granted national marketingauthorization by each country’s national regulator1 Data are not currently available to allow for aninternational comparison of access that would includeprivate sector drug plans.2during the five year period between January 1, 2010and December 31, 2014 were included. NMEs or
NME-containing combinations were consideredscheme to eligible populations. For this report,new if they had not been previously approved orcoverage for new medicines was measured acrossavailable in that specific country. The newthe six largest private insurers that combined covermedicines were selected for each country using83% of Medicare lives. For both Canada and thethe applicable, publicly available health regulatoryUS, reimbursement was measured at three levels:agency approval lists. For example, in Canada,1) the product was listed in at least one of themedicines with marketing authorization wereCanadian provinces or US plans examined, 2) theidentified from the Health Canada Notice ofproduct was available for 50% of the eligibleCompliance (NOC) database. In Europe, this listnational public drug plan population covered inwas determined from the pan-country Europeaneach respective country, and 3) the product wasMedicines Agency (EMA) database with aavailable for 80% of the eligible national publicsubsequent launch status investigation to ensuredrug plan population covered in each respectivemolecules were NMEs on an EMA country bycountry.country basis. While some products in Europecould be granted market authorization directly froma country’s own health authority instead of theEMA, they were not included given the infrequentnature of these occurrences.Reimbursement status was current as of December2015, allowing for one full year to mature followingthe end of the five-year marketing authorizationperiod that sets the parameters for the drugsincluded in this study. In general, most countriesmake public drug plan reimbursement decisions atthe national level. Canada and the US are outliersin that reimbursement decisions are madeseparately and independently at the federal,provincial, or state level, creating a challenge inassigning a nationally representative measure ofaccess to new medicines. As such, a uniqueapproach was developed for the original study forboth Canada and the US that weighted theobserved drug reimbursement findings in eachplan by taking into account the proportion of thepopulation that was eligible for coverage under thepublic drug plan and aggregating across thecountry as a whole. In the US, public reimbursementwas determined based on Medicare Part B and PartD. Under the US Medicare model private insurersprovide drug coverage within a publicly fundedAccess to New Medicines in Public Drug Plans: Canada and Comparable Countries3
The study examined access to new medicines in the context of thehealth care systems across a group of countries that are mostcomparable to Canada in terms of economic development.Notable changes from the first report include: Reimbursement coverage time periodconsideration advancement from June 2014 We have advanced the study period definingthe basket of drugs to the most recent 5-yrmarketing authorization period fromJanuary 1, 2010 to December 31, 2014. The removal of fixed dose combination (FDC)products composed only of molecules previouslylaunched within a country. FDC products notcontaining NME molecules can often havequicker reimbursement if the compositemolecules are already reimbursed which couldskew an analysis that intends to focus on newmedicines. Improved data availability permitted the countryto end of 2015. The removal of First-In-Class and World HealthOrganization (WHO) Anatomical TherapeuticChemical (ATC) sub-analyses since theseanalyses were difficult to compare acrosscountries in a meaningful way.The findings from this report represent the mostcurrent and robust assessment currently availableabout how governments support access to newmedicines in Canada in comparison with a groupof Canada’s economic peer countries, and buildson other global research on the subject of accessto medicines.2comparison list to be expanded to include SouthKorea, Portugal and Spain. Denmark wasremoved from the list of OECD countriesincluded due to the difficulty in standardizingreimbursement information year over year.42 For an example see EFPIA (2015). PATIENTS W.A.I.T.INDICATOR. European Federation of PharmaceuticalIndustries and Associations (EFPIA). URL — Delays.
HIGHLIGHTSOVERALLBIOLOGICS When only considering products that were In Canada, 23% of new biologic medicines werereimbursable across provinces accounting for atreimbursed in public drug plans across provincesleast 80% of the eligible national public drugcomprising at least 80% of the eligible nationalplan population, Canada ranked 18 of 20public drug plan population, ranking Canada 19thcountries with only 37% of new medicinesof 20 countries.threceiving public reimbursement acrossCANCERthe country. In Canada, the wait from national marketing In Canada, 59% of cancer medicines wereapproval to public drug plan reimbursement wascovered in public drug plans across provinces449 days across provinces comprising 80% ofcomprising at least 80% of the eligible nationalthe eligible national public drug plan population,public drug plan population, ranking Canada 17thranking Canada 15 of 20 countries.of 20 countries.th Canadian public drug plans placedreimbursement conditions on 90% of newmedicines when measured across provincescomprising 80% of the eligible national publicdrug plan population, ranking Canada 17th of20 countries.Access to New Medicines in Public Drug Plans: Canada and Comparable Countries5
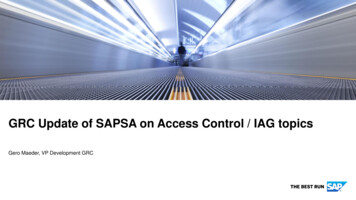
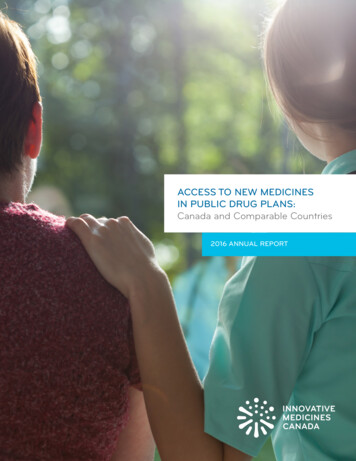
In Canada, the wait from national marketing approval to public drugplan reimbursement was 449 days across provinces comprising80% of the eligible national public drug plan population, rankingCanada 15th of 20 countries.CONSOLIDATED RESULTS The relative international performance ofbottom right quadrant showed lower rates ofCanada’s public drug plans is illustrated below.reimbursement, and longer time to reimbursement.Countries that fall into the upper left handRelative to the average bubble size, countriesquadrant showed higher rates of publicwith a smaller/larger bubble size had more/lessreimbursements for new medicines and shorterrestricted reimbursement than the averageFigure 7: Overall comparison of countries based on three metrics: percentage reimbursed of new medicinestime to public reimbursement. Countries in theacross countries.approved, quality of reimbursement, and time to reimbursement from marketing authorization.2.5 -% Reimbursed of approved, indexed to the averageHigh % and fast reimbursement2.0 -1.5 -ATJPUS1DEUK1.0 -BENLCHSECA1IEBEITNOUS2FIFRUS3AU0.5 -CA3KOCA3PONZ0.0 - 0.0Low % and slow reimbursement 0.5 1.0 1.52.0 2.5Time to reimbursement from approval, indexed to the averageAll countries (excl Canada)Canada1 Listed in one province/Medicare plan;2 Covered for 50% of the eligible public drug plan population;3 Covered for 80% of the eligible public drug plan population6Average bubble sizeBubble size pertains to the percent of new medicinesreimbursed without restrictions (i.e. fully reimbursed),indexed to the average across countries
1.0 ABOUT THE REPORTThis report is the latest evolution of the work by Proportion Launched: The proportion of newlyInnovative Medicines Canada to objectivelyapproved medicines that were subsequentlycompare access to new medicines across themade available and sold up to December 31,public drug plans of Canada and its peer countries.2015.The report builds on previous editions, broadeningthe global perspective, and refining themethodology to support study stability and ensurecountries are compared fairly and evenly in thecontext of highly unique health care systems. The Proportion Reimbursed: The proportion of newlyapproved medicines that were reimbursed underpublic drug plans as of December 31, 2015. Restrictions and Criteria: Comparing the qualityanalysis begins with a review of the process,of reimbursement by looking at product-specificmechanisms, and scope of public drug planprescribing restrictions and criteria for usereimbursement across countries. From there,imposed on reimbursed products.several key analyses were conducted to compareaccess to new medicines in publicly funded drug Time to Launch and Time to Reimbursement:Calculating the time elapsed from marketingplans, including:approval to launch and from approval to New Medicines: Identifying the new medicinesapproved for sale in each country betweenJanuary 1, 2010 and December 31, 2014.reimbursement across countries. Sub-Analyses: Determining if differences inaccess exist in sub-segments of interest suchas cancer and biologics.Access to New Medicines in Public Drug Plans: Canada and Comparable Countries7
1.1 COUNTRIES OF FOCUSThe study focused on 20 of the top 30 OECD countries ranked by highest GDP per capita, as listed below(Table 1)3. This subset of OECD countries was selected because the countries are most similar to Canada interms of social and economic factors and comparable and complete data was available to measurereimbursement for new medicines within their public drug plans.3 OECD.StatExtracts. Accessed December 2015. http://stats.oecd.org/Table 1: OECD countries analyzedCanadaCAIrelandIESouth New ZealandNZUnited KingdomUKFranceFRNorwayNOUnited StatesUSGermanyDEPortugalPO1.2 DATA SOURCES1.3 PRODUCT SELECTIONIMS Health propriety databases, including MIDAS Throughout the report, all new molecular entitiesand Pricing Insights , were used as the primaryand new combinations selected for analysis will besource of product and country specific datareferred to as "new medicines". All new molecularregarding product launch and reimbursement.entities or new combinations granted nationalThese actively managed datasets bring togethermarketing authorization between January 1, 2010health care facts and figures from overand December 31, 2014 were included in the70 countries, allowing for multi-country analyses inanalysis. New medicines or new medicine-a systematic and uniform approach. Data was alsocontaining combinations were considered new ifcollected from public sources, including nationalthey had not been previously approved or availablehealth regulatory agencies, and non-governmentalin that specific country. Unique product lists wereorganizations. More details on the data sources aregenerated for each country. For details regardingprovided in the Appendix of this report. Additionally,exclusion criteria, see Appendix 5.2.1.this report drew on input from IMS Health subjectmatter experts across the world to review the dataThe new medicines were selected for each countryand methodology, as well as provide additionalusing the applicable, publicly available healthinsights and context to the findings.regulatory agency approval lists. In Europe, this listReimbursement status continuously evolves. Datawas determined from the pan-country EMA4used in this report is current to December 2015.84 European Medicines Agency, European publicassessment reports, Accessed January 2016. http://www.ema.europa.eu/ema/index.jsp?curl pages/medicines/landing/epar search.jsp&mid WC0b01ac058001d124
CANADA’S UNIQUE SITUATIONFor Canada, the reimbursement decision is made independently by each province, and as such, the same productreimbursed in one province may not be reimbursed in another, adding to the complexity of a global comparison. Inorder to fully understand the reimbursement levels for Canada, this analysis uses three benchmarks:1.Products with at least one public drug plan approval: Tracks all products that were listed for coverage in at leastone provincial drug plan.2.Products reimbursed for 50% of the eligible national public drug plan population: Tracks all products that werecovered for at least 50% of the total national population that was eligible for publicly funded drug plan benefits,and was calculated using a weighted average by province.3.Products reimbursed for 80% of the eligible national public drug plan population: Tracks all products that werecovered for at least 80% of the total national population that was eligible for publicly funded drug plan benefits,and was calculated using a weighted average by province. This level of reimbursement represents coverage formost Canadians, and in the context of this global analysis, best represents the reimbursement coverage incomparator OECD countries.1.4 LAUNCH AND PUBLICREIMBURSEMENTANALYSISdatabase with a subsequent launch statusA new product was considered "launched" if it hadinvestigation to ensure molecules were newbeen introduced into the market. The date ofmedicines on an EMA country by country basis.market introduction was considered the "launchWhile some products in Europe could be granteddate". Launch status and date of launch weremarket authorization directly from a country’s ownidentified for each of the selected products byhealth authority, they were not included given thecountry using the IMS Health MIDAS database.infrequent nature of these occurrences. In Canada,medicines with marketing authorization wereReimbursement measured whether or not the newidentified from the Health Canada Notice ofproduct was granted public reimbursement, and/orCompliance (NOC) database5. To better understandincluded in a government-mandated reimbursednew medicine basket comparability between countriesmedicines list. The corresponding date on whichthe Canadian new medicine marketing approval listthe reimbursement was granted was defined as thewas also cross-referenced against each respective"reimbursement date". Reimbursement status wascountry’s list for the same period of time.determined using information from the IMS HealthPricing Insights database, as of December 31, 2015.Reimbursement status was also supplemented withlocal country reimbursement sources where necessaryand/or applicable. This analysis only tracks the status5 Health Canada Notice of Compliance (NOC) database.Accessed January 2016. http://webprod5.hc-sc.gc.ca/noc-ac/index-eng.jspof medicines on public reimbursement systems.Access to New Medicines in Public Drug Plans: Canada and Comparable Countries9
Eligibility for public reimbursement can vary bywas determined at 3 levels: 1) the product wascountry, with most countries in Europe providinglisted in at least one of the four aforementionedcoverage to the entire population, while countriesplans, 2) the product was available for 50% of thelike Canada and the US mainly provide coveragepopulation covered under any of the four plansto select populations. This study focuses only onconsidered, and 3) the product was available forpublic coverage of medicines as a proportion of80% of the population covered under any of thethe population eligible under public plans,four plans considered. Additional details can benotwithstanding supplementary private drugfound in the appendix of this report.coverage or cash paying customers.It is important to note that some countries haveIn general, most countries make publicspecial access programs for exceptionalreimbursement decisions at the national level.circumstances that are not part of an officialCanada and the US are outliers in that theformulary. These special access programs were notindividual provinces, states and/or planincluded in the analysis as they are not widelyadministrators make independent regionalavailable, are typically on an individual case-by-casereimbursement decisions, creating a challengebasis, and have limited public transparency forin understanding national access to medicines.empirical evaluation.As such, as part of the a unique approach wasdeveloped for both Canada and the US, takinginto account the proportion of the eligible national1.5 SUB-ANALYSESpublic drug plan population that was grantedAdditional analyses were conducted to understandaccess to each new medicine.if there were any differences in how countriesprovide access to specific types of products.In the US, public reimbursement was determinedbased on Medicare Part B and Part D. CoverageBiologics: This group was selected as they arewas determined across the six largest privatetypically high cost, yet innovative, medicines.insurers that combined, cover 83% of MedicareAll products that were produced from biologicallives. Similar to Canada, product reimbursementsources or systems were included, such asantibodies, hormones, and enzymes.Cancer: Many nations put a priority on lifethreatening diseases, such as cancer. Cancerproducts were identified using the WHO ATCclass L classification and eliminating non-oncologicimmunomodulating agents. The final list wasvalidated by IMS Health expertise.10
1.6 QUALITY OFREIMBURSEMENT1.7 TIME TO LAUNCH ANDTIME TO REIMBURSEMENTMoving beyond a binary analysis of reimbursement,In addition to measuring the extent of reimbursementthis metric provides insight into how broadly reimbursedacross countries, it is also important to examine theproducts are made available to the eligible nationalspeed at which new medicines are made available.public drug plan population, and how extensivelyThese metrics look at the time required to access newcountries impose restrictions on access. This analysismedicines, starting from the date of health regulatorydisregards any system-wide eligibility restrictions orapproval in each country.co-pays, and instead focuses on restrictions uniquelyassigned to individual products. Each product was Time to launch: The time, measured in calendarcategorized into one of three levels in increasingdays, from the date of market authorization toorder of restriction:the date of introduction on the market. This isan indicator of the relative time each company1.Full reimbursement: The new product receivedrequired to make their product generally availablethe highest level of reimbursement available forto the public.that country.2.3. Time to reimbursement: The time, in days, from thePartial reimbursement: Only part of thedate of market authorization to the date of publicproduct’s eligible cost is covered.reimbursement. This is an indicator of the timeRestricted reimbursement: Access to thereimbursed product was restricted to a subset ofrequired for public payers to review and include newmedicines in their formularies.the eligible national public drug plan population,The date of marketing authorization was available ator required special authorization or prerequisitethe exact day, month, and year, whereas dates ofconditions to be met.launch and reimbursement were available only atProducts with more than one level of coverage werecategorized according to their most restrictivecondition. Partial reimbursement was not applicablein Canada as no province employs variable co-pays atthe product specific level.month and year. As such, in order to calculate thetime to launch and time to reimbursement in calendardays, the date of launch and reimbursement was setat the 15th of the month, to equally balance for allproducts launched or reimbursed before and after thisdate. Where the calculation yielded a negative value,the days to launch or reimbursement were set to zero. In Canada, the time to reimbursement was calculatedas the average time from NOC (notice of compliance)to reimbursement for all products in each province.The average time to reimbursement for eachprovince was then weighted by the relative size ofthe eligible national public drug plan population ineach province to determine a final weighted averagetime to reimbursement.Access to New Medicines in Public Drug Plans: Canada and Comparable Countries11
The present study expanded the list of countries compared toCanada include South Korea, Portugal and Spain to broaden thecomparative findings amongst countries with reliable medicineauthorization, launch and reimbursement information.1.8 NON-COMPARABILITYWITH PREVIOUS REPORTSThis report marks the second iteration of a The present study expanded the list of countriespartnership with Innovative Medicines Canada andcompared to Canada include South Korea,IMS Health to comparatively assess the access toPortugal and Spain to broaden the comparativenew medicines across comparable countriesfindings amongst countries with reliable medicinehowever study to study comparability is not validauthorization, launch and reimbursementfor a number of reasons:information. Denmark was removed from the listof OECD countries included due to the difficulty The list of new medicines considered from studyto study varied and is expected to vary year overin standardizing reimbursement information yearover year.year as novel new medicines are considered andaged medicines are removed. Thus we haveadvanced the study period defining the basketconsideration was advanced from June 2014 toof drugs to the most recent 5-yr marketingend of 2015 to again keep findings current butauthorization period from January 1, 2010 toalso standardized all periods of consideration toDecember 31, 2014.end of calendar year. The present study refined new medicine inclusionmethodology to only consider FDC containing atleast one new molecule to minimize reimbursementbias. FDC products not containing new moleculescan often have quicker reimbursement if thecomposite molecules are already reimbursed.12 Reimbursement coverage time period The study focused on biologic and cancer classsub-analyses.
2.0 HEALTH SYSTEMS:STRUCTURE AND DESIGNEach country has its own political priorities,A good health system is one that “delivers qualityeconomic constraints, and cultural expectationsservices to all people, when and where theywhen it comes to health care. These factors andneed them”7. The WHO has listed several keyothers lead to significant diversity in how healthcomponents of an effective health system: healthcare is administered and delivered. For this reportsystem financing, health workforce, healththe structure of each health system was analyzed toinformation and resources, national health policiesdevelop a contextual understanding of the drugand essential medicines and health technologies7.coverage model in each country. Health systems financing can range from general2.1 COMPONENTS OF AHEALTH SYSTEMtaxation to fee for service models. These financingThe World Health Organization (WHO) defines abarriers to access to health care in a systemhealth system as the sum of all organizations,where the goal is to achieve universal coverage.methods ensure that funds and resources areallocated equally, are sustainable, and can reduceinstitutions and resources whose overall objective isto improve health6. These systems operate with theaim to improve people’s lives in everyday tangibleways, including a broad spectrum of activities from A highly skilled and knowledgeable healthworkforce is an essential component in providingquality care in complex medical settings.disease prevention to treatment and management.6 World Health Organization Website. Accessed 21 April2016. http://www.who.int/gho/publications/worldhealth statistics/2015/en/7 World Health Organization Website. Accessed 21 April2016. http://www.who.int/topics/health systems/en/Access to New Medicines in Public Drug Plans: Canada and Comparable Countries13
Health information and resources are thefoundation for efficient and effective managementof a health system by providing access toinformation. Health information allows for informedand appropriate health decision making, healthsector reviews, planning, resource allocation andprogram monitoring and evaluation.2.2 HEALTH CARE SYSTEMFINANCING &REIMBURSEMENTPOLICIESStructural differences between health care systemscan impact how the burden of cost is distributedacross governments, employers, and individuals,Structural differences between health caresystems can impact how the burden of costis distributed across governments, employers,and individuals, and thus may confusecomparisons of access to new medicinesacross public drug plans.and thus may confuse comparisons of access tonew medicines across public drug plans. Forexample, many countries publicly fund prescriptiondrug costs on a universal basis for their entirepopulations. With some variation between them,other countries such as the Netherlands, Sw
contribution to achieving good health. It is therefore important that Canadians are well-informed about the state of access to new medicines in Canada. For this reason, Innovative Medicines Canada annually examines how well Canada's public drug plans are performing on access to new medicines compared to public drug plans in other countries.1