Transcription
WATER COMMODIFICATION IN THE LOWER RIO GRANDEVALLEY, TEXASA Senior Scholars ThesisbyBIANCA GARCIA AND MANUEL HERNANDEZ JR.Submitted to the Office of Undergraduate ResearchTexas A&M Universityin partial fulfillment of the requirements for the designation asUNDERGRADUATE RESEARCH SCHOLARApril 2011Major: Environmental Studies and Environmental Geosciences
WATER COMMODIFICATION IN THE LOWER RIO GRANDEVALLEY, TEXASA Senior Scholars ThesisbyBIANCA GARCIA AND MANUEL HERNANDEZ JR.Submitted to the Office of Undergraduate ResearchTexas A&M Universityin partial fulfillment of the requirements for the designation asUNDERGRADUATE RESEARCH SCHOLARApproved by:Research Advisor:Director for Honors and Undergraduate Research:Wendy E. JepsonSumana DattaApril 2011Major: Environmental Studies and Environmental Geosciences
iiiABSTRACTWater Commodification in the Lower Rio Grande Valley, Texas.(April 2011)Bianca Garcia and Manuel Hernandez Jr.College of GeosciencesTexas A&M UniversityResearch Advisor: Dr. Wendy JepsonDepartment of GeographyThe lower Rio Grande Valley of Texas is one of the poorest regions with the largestpopulation lacking suitable water supply in the entire United States. The region ischaracterized by low-income, rural and peri-urban communities called ―colonias.‖Nearly half of the 238,000 colonia residents face known infrastructure deficiencies inwater, sanitation, or both, while nearly one-fifth have unknown water and sanitationstatus. The commodification of water quality through water vendors has expandedrapidly throughout South Texas, questioning their motives for positioning theirbusinesses in certain locations. We will explore the relationship between poverty andwater vending through a spatial analysis using a Geographic Information System. Ouranalysis revealed significant correlations between demographic variables and watervending unit locations. The spatial distribution was strong in relation to colonialocations, confirming the belief that water companies placed water vending units for theregion’s poor communities.
ivDEDICATIONWe would like to dedicate this thesis to everyone that supported us through the creationof this project.
vACKNOWLEDGMENTSWe would like to thank our advisor, Dr. Wendy E. Jepson, for her guidance, patience,and support throughout this project. This project wouldn’t have occurred without herknowledge and passion for the study area. Also, we would like to thank MiriamOlivares and Iliyana Dobreva for their technical assistance with the ArcGIS software.
viNOMENCLATUREEPAEnvironmental Protection AgencyFDAU.S. Food and Drug AdministrationGISGeographic Information SystemsLRGVLower Rio Grande ValleyNRDCNatural Resources Defense CouncilSDWASafe Drinking Water ActTCEQTexas Commission on Environmental Quality
viiTABLE OF CONTENTSPageABSTRACT . iiiDEDICATION . ivACKNOWLEDGMENTS . vNOMENCLATURE . viTABLE OF CONTENTS . viiLIST OF FIGURES . viiiLIST OF TABLES . ixCHAPTERIINTRODUCTION . 1The bottled water industry – a historical overview . .4IIMETHODS. 14Study region . 14IIIRESULTS. .22Quantitative results . .22IVDISCUSSION . 33VCONCLUSION. .36REFERENCES . 37APPENDIX . 39CONTACT INFORMATION . 51
viiiLIST OF FIGURESFIGUREPage1Watermill Advertisement Image .122Map of LRGV .153Google Earth Image of Hidalgo County .154Aquamax Buffer Analysis (1 kilometer). .235Aquamax Buffer Analysis (2 kilometer). .246Avant Buffer Analysis (1 kilometer). . .257Avant Buffer Analysis (2 kilometer). . .268Watermill Express Buffer Analysis (1 kilometer) .279Watermill Express Buffer Analysis (2 kilometer) .2810Waterplex Buffer Analysis (1 kilometer) .2911Waterplex Buffer Analysis (2 kilometer) .3012Water Availability in Hidalgo County, TX . 4213Family Concentrations in Hidalgo County, TX . . .4314Total Income in Hidalgo County, TX 4415Families with No Vehicle in Hidalgo County, TX . 4516Families with 1 Vehicle in Hidalgo County, TX .4617Families with 2 Vehicles in Hidalgo County, TX . .4718Families with 3 Vehicles in Hidalgo County, TX . .4819High School Education in Hidalgo County, TX . 4920College Education in Hidalgo County, TX . 50
ixLIST OF TABLESTABLE1PageU.S. Census Bureau: 2005-2009 American Community Survey 5-YearEstimates . .162Colonias classification and population 2006 .173Colonias inside the 1 kilometer buffer . . .314Colonias inside the 2 kilometer buffer . . .315Pearson correlation between colonias and water vendors at 1 Km .316Pearson correlation between colonias and water vendors at 2 Km . 327Avant locations . . 388Watermill locations . . . .399Waterplex locations . . . .3910Aquamax locations . . .40
1CHAPTER IINTRODUCTIONEvery human being is entitled to the basic human right of having clean water. Yet over thepast twenty years, drinking water has been transformed from a public good to a commodity(Gleick, 2011). The commodification of bottled water has increased through globalization,becoming readily available to the public (Klessig, 2004). Despite the availability and costof tap water, people are willing to spend great amounts of money to ensure they receive―good quality water‖ that many bottle water companies promise them (Doria, 2006). ManyAmericans believe that bottled water is a necessity; not only is it more convenient, but it isbelieved to be healthier than tap water. Water as a commodity is a part of the fastestgrowing and least-regulated industries in the world (Barlow & Clarke, 2002; Lewis, 2010).The recent bottled water craze has left American’s ―obsessed‖ with bottled water. Thebottled water industry grosses hundreds of millions of dollars per year (Gleick, 2010).Each year, sales for bottled water continue to increase. In 2001 alone, more than 5.4 billiongallons of bottled water were sold to and consumed by the American public (Boldt-VanRooy, 2003: 273) yet by 2008, this volume almost doubled, as nearly 9 billion gallons werepackaged and sold in the United States (Gleick, 2010: 5).This thesis follows the style of Geoforum.
2Consumer’s predisposition of bottled water over tap water differs between each person.One person may prefer bottled water because of the certain taste while another person mayview bottled water as part of the modern lifestyle and a status symbol (Parag & Roberts,2009). One source confirms American preference for bottled water, as they drink morebottled water than beer or milk, around 30 gallons per year (Gleick, 2010: 6). As one criticwrote, there is an advertising ―war on tap water‖ that has increased consumer preferencefor bottled water over tap water (Gleick, 2010: 10). This idea of pure and safe drinkingwater has been instilled in consumer’s heads due to bottled water companies creating theimage that tap water is inferior to bottled which in turn develops distrust of the quality oftap water in the minds of consumers (Parag & Roberts, 2009).The Lower Rio-Grande Valley (LRGV) is an area located in south Texas, along the borderof the United States and Mexico. In the residential areas in the LRGV, colonias, havefaced problems associated with water, which includes water quality and access (Haynes,1977). The quality of water in the LRGV is affected primarily by pollution. The pollutionfrom wastewater plants, known as ―point sources‖, and "nonpoint‖ sources that includecontaminants that run off due to rainfall from parking lots and agricultural fields affect thewater quality. To help solve this problem, an agency known as the Lower Rio GrandeValley Development Council has served since 1975 to aid in the management of waterquality with help from the EPA and TCEQ (LRGVDC, 2009). However, there are stillcommunities with little or no access and a strong belief that the water provided to thecolonias is not good (Jepson, personal communication; field notes).
3Water vending companies have been commercializing the access to clean water to theregion’s population. The companies have built water vending machines, such as Watermillsor ―molinitos‖, throughout areas of the LRGV to fulfill a market need for purified drinkingwater. Customers supply their own containers and drive up to the different water vendinglocations to purchase purified water at a fraction of the price they would pay for bottledwater. There are four water vending companies that we will further investigate theirmethods of advertising, technology, demographic market, and distribution locations. Thesefour companies include Watermill Express, Avant, Aquamax, and Waterplex.In this thesis we will describe the water vending industry in the Lower Rio Grande Valley,located in the southern Texas-Mexico border. This area is one of the poorest regions andone of the largest concentrations of Hispanics in the United States. Unlike thecommodification of bottled water for the wealthy, the emergence of the water vendingpurified water economy in the South Texas targets low-income residents who havehistorically lacked access to water or who have access to shoddy public services that supplywater. Therefore, this chapter provides the background necessary to situate the emergenceof water vending to poor residence in the Lower Rio Grande Valley. The first sectionreviews the current literature on bottled water industry, paying attention to the process ofwater commodification to elites. It is then followed by two sections that review theproblems of bottled water industry, focusing on the environmental impacts and thetechnological innovations that support the new packaging and delivery of drinking water toconsumers. The final section demonstrates that while we know much about water vendingto the wealthy, there is little information on the process of drinking water commodification
4to the poor. We argue that a study on water vending to low income communities will addto the broader literature on water commodification through bottling and provide newinsights into the underlying economic assessment of benefits and costs related to sellingpurified drinking water to the poor rather than provide through public services.The bottled water industry– a historical overviewWater suppliers comprise of private firms that distribute bottled water, semiprivate wateragencies that distribute tap water, autonomous state water authorities, and branches of localgovernment. These water suppliers distribute different types of bottled water. The qualityof this water is relayed to the consumers through information provided by the monitoringauthority (Parag & Roberts, 2009). The different types of bottled water include spring,purified, mineral, and sparkling. Spring water is defined as bottled water derived from anunderground formation from which water flows naturally to the surface of the earth. Thistype of water must be collected only at the spring or through a borehole tapping theunderground formation feeding the spring. Purified water is created through treatmentprocesses such as distillation, deionization or reverse osmosis. Mineral water is theconstant level and relative proportions of mineral and trace elements at the point ofemergence from the source. Finally, sparkling water contains the same amount of carbondioxide that it had when it surfaced from its source (Blaurock-Busch, 2009; Gleick, 2011).These are the main types of bottled water that most American’s prefer to consume. Despitethe fact that the bottled water industry has gained popularity over the last several years, itstill has its fair share of setbacks.
5With the amount of revenue coming in from the water bottle industry, many wonder whenthis dependence on ―purified‖ water started. In the 1970’s, water bottle production beganto expand throughout the country at a consistent rate. In the past many Americans did notdrink as much water as today, thus the water bottle business was relatively small. It wasonly in the 1980’s when the industry began to expand at a rapid pace, making it the fastestrising aspect of the bottling and beverage industry. Its revenue increased by 93% between1976 and 1980, with total revenues about 440 million (Coca Cola, 1996). In 1980,companies looked to the United States to begin selling bottled water by advertising in away that would attract consumers to the idea of ―healthy and cleaner‖ water (Coca Cola,1996). To this day, the United States continues to be a top nation, followed by Europe, witha high number of water consumption in regards to bottled water.Around the late 1970’s and early 1980’s, businesses began tapping into the bottle waterindustry as many Americans were drawn into the idea of having safe ―bottled‖ water. Atthis time, large bottle water companies have set aside a large percentage of their revenuesto be directed towards advertisement, since image has been the key ingredient to its topdollars earned. Perrier, now known as one of the top leading bottle water companies, hasbeen one of the first corporations to look into turning water to a commodity. GustaveLeven, chairman of Source Perrier, partnered up with Bruce Nevins, who worked forathletic-wear company Pony (Fishman, 2007). Nevins created a three-part strategy toconvince Americans that bottled water is the beverage to consume. Nevins was able to tiein health by having Perrier sponsor a marathon, have celebrity commercials, and flew inseveral journalists to introduce them to the source of their water (Fishman, 2007).
6Americans were captivated by bottled water, and Perrier’s sales’ reflected that trend assecond—year profits tripled in revenue. Perrier’s introduction of bottled water allowed forother companies to join the ―blue gold‖ rush. Evian, another leading water bottle company,started off in the United States in 1984 (Fishman, 2007). Its marketing strategy revolvedaround images of young men and women in the gym with tight clothes and havingMadonna drink Evian while in concert. Interestingly, Evian was the first company topresent its water in a plastic bottle. There advertisement idea was to show people how theirwater was clean and delicious. Poland Spring, a top water bottle company, started off withproviding water towards resort and spa complexes. Since water was their main revenue,Poland Spring put all of its focus on bottled water once their resort burned down in 1976,right around the time the water bottle industry began to bloom (Fishman, 2007).Bottled water is regulated by the U.S. Food and Drug Administration (FDA) as a foodproduct. Therefore, bottled water companies must comply with requirements established bythe FDA. These requirements include quality, labeling, and manufacturing practices.These companies must also comply with state restrictions with methods for collectingwater, standards for bottled water, and trade industry regulations (Boldt-Van Rooy, 2003).Despite these requirements and FDA guidelines, water scholar Peter Gleick recentlydemonstrated that bottled water is less regulated than tap water, which is regulated by theSafe Drinking Water Act (SDWA) (Gleick, 2011). Others have challenged the clean imageof ―pure spring water‖ through brands like Nestle but this water may not always be saferthan tap water. A 1999 study conducted by the US based Natural Resources Defense
7Council (NRDC) discovered that one third of the 103 brands of water contained levels ofcontamination that included traces of E. coli and arsenic (Barlow & Clarke, 2002).Problems with the bottled water industryOur global water industry is dominated by ten corporate players mostly based out ofEurope, which are divided into three tiers. The first tier is made up of the two mostpowerful water companies in the world, Vivendi Universal and Suez, both based out ofFrance. These two companies control over 70 percent of the world water market. Thesecond tier is comprised of four corporations, Bouygues-SAUR, RWE-Thames Water,Bechtel-United Utilities, and Enron-Azurix. The third tier consists of smaller watercompanies including three British companies and a US based enterprise. The Britishcompanies include Severn Trent, Anglian Water, and the Kelda Group. American WaterWorks Company is the US based company (Barlow & Clarke, 2002).A group of four bottled water companies dominate the United States bottled watermarketplace. These companies are known as ―The Big Four‖ and they includeNestlé/Perrier Group of America, Danone Waters of North America, Pepsi, and Coca-Cola.The soft drink company, Pepsi, is the number one seller of bottled water at retail storeswith its line of purified municipal tap water, Aquafina. Coca-Cola also sells purifiedmunicipal tap water under its brand, Dasani. In 1992, over 700 brands of bottled waterappeared on the shelves of stores all over the United States. Nestlé/Perrier Group ofAmerica dominates in the world market with almost 16% of all bottled water sales (BoldtVan Rooy, 2003). At the present time, we have seen seven large bottled water companies
8rise to the top in an industry that has been known as the fastest growing area in thebeverage market (Excel Water Technologies, 2007). Those companies include Perrier,Evian, Naya, Poland Spring, Clearly Canadian, La Croix, and Purely Alaskan (Barlow &Clarke, 2002). The bottled water industry has negatively affected the local and globalenvironments. Environmental degradation from the bottled water industry is seen throughthe collection, processing, packaging, transport, and disposal processes. The extraction andprocessing of oil and other raw materials to create the plastic used for the bottles add to thedegradation (Parag & Roberts, 2009; Ferrier, 2001; Howard, 2003; Jungbluth, 2005).Water-bottling corporations have been buying farmland in rural communities to accesswells and moving on once the wells have been depleted of water supplies. Once thecorporations have removed areas of their water supplies, they are not obligated to pay anyfees for the extraction of the water like in other industries such as oil and timber (Barlow &Clarke, 2002). Damages caused by the bottled water industry are not limited to groundwater deterioration (Lewis, 2010). In places such as the southwest United States, sizablebottling plants are depleting rare oasis environments. Whereas in more humidenvironments, aquifers have dropped, thus causing desiccation to the wetlands in someinstances (Lewis, 2010).Along with ground water depletion, industry utilizes a considerable amount of energy whileits waste (plastic bottles) adds volume to landfills. Most of the energy used by the industrycomes from the manufacturing and distribution of plastic bottles. According to Gleick(2010), the energy consumption was between 100 and 160 million barrels of oil in 2007(Lewis, 2010). Recently, bottled water companies have reduced the amount of plastic in
9their water bottles because of much criticism that they have generated a substantial streamof plastic waste. By reducing the plastic contained in their bottles, companies haveemphasized recycling and are testing biodegradable containers. Although, there are someproblems associated with these biodegradable containers. These containers decomposepoorly and could possibly end up contaminating the recycling stream (Lewis, 2010).Technology of bottled water industries: case of purified waterWith the growth of bottled water, industries are focusing on the equipment necessary toprovide this purified water for different plants. Unlike spring water or glacial water,purified water is tap water that has been further transformed through a technologicalprocess. With advanced technology, companies have been able to decontaminate water.Bottle water companies have advertised themselves on having clean, safe drinking waterthat has gone through countless purification methods, thus meaning any impurities havebeen removed.First, surface water flows through a process of purification by taking water from surfacesources and running it through to become tap water, regulated by the EPA under theSDWA. This includes techniques such as sand filtration, flocculation, and the addition ofchlorine to eliminate contaminants found in water (Drink More Water; EWT, 2007).Although, this addition of chlorine can be harmful to your body and has been linked todifferent cancers, it does play the role of killing microorganisms in the water that can makeyou severely ill (Drink More Water).
10Bottled water industries claim to treat tap water and take the necessary steps to turnacceptable EPA water into healthy, ― purified water‖ through a series of water purificationmethods. One of the most widely used methods used by companies is to take municipalwater and run it through several filtrations. This allows for further purification and removalof contaminants such as chlorine, organic solvents, pesticides, chloride oxide, and otherpollutants. Reverse osmosis is a type of filtration method of which is chemically pure waterfrom virtually any sources (Watek, 1993). This method of filtration is a widespread in thebottled water industry, removing impurities and other contaminants with both low energyconsumption and maintenance costs. Another filtration method that is commonly used inthe bottled water industry is known as distillation, which deals with the initial boiling pointof water. It separates the substances in water since there is a difference in boiling points,and then the vapor goes through a cooling process (Watek, 1993). Also, demineralization isknown as another purification process used by water bottle industries. This purificationmethod captures ions through an ion exchanger and exchanges salts for hydrogen andhydrate oxide ions (Watek, 1993). These dissolved salts are then removed through cationand anion exchangers. Once that is done, the water goes through a regeneration process byusing hydrochloric acid and sodium hydroxide.Water companies have been known to use different methods to reach its purified water thatis safe and healthy, but researchers have found this is untrue at times. According to anepidemiological study conducted by Payment et. al (1997), gastrointestinal illness canoccur with the consumption of purified drinking water even if it passes the currentdrinking water standard. With carefully set advertisement, some companies are able to take
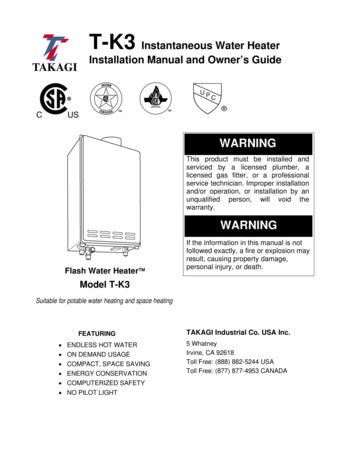
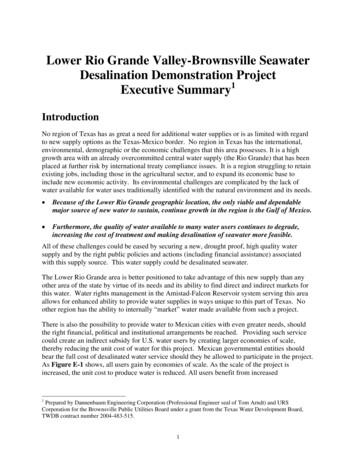
11purified water that has already gone through a process of removing contaminants and addanother purification step (Drink More Water). Advertisement is then sent out to the publicof its intense purification process, making the public believe this water is far safer thanregular tap water. In the end, technological advances have allowed for bottled waterindustries to grow in a business that has increased in revenue at an exponential rate.Purified water in the lower Rio Grande ValleyWater vending locations can easily be identified by their unique appearance. With largeadvertisement banners and signature watermills, water vending companies have been ableto attract a consistent amount of business as time continues to progress (Figure 1).Watermill Express has been a prominent vending business in the LRGV, advertising theirpurified drinking water through their infamous watermills (molinitos). These well-knownwatermills have all the components people look for: convenience, appearance, andconfidence in water they are consuming. The advertising tactics displayed at mostwatermills will have some sort of description of their water that will lure consumer’s towant to purchase their water. For example, an advertisement on these watermills will read―Try Our Water. You’ll Love it!‖ or ―Great Water.‖ These advertisements are eventranslated to Spanish, which will attract their target Hispanic audience wherever thesewatermills are located. Watermill Express has recently taken a direct route in ensuringtheir quality in advertisement. The water company has limited access to informationavailable to the public to view. Such information includes accessible locations of theirwatermills via internet and telephone, technology used throughout their watermill chains,and overall advertisement ideas to contend with other companies in the water industry.
12With the ease of locating and maneuvering around these watermills, further shown througha Geographic Information System, communities are willing to pay the necessary funds toreceive safe and reliable drinking water.Figure 1: An example of a water vendor’s advertisement image.Water vendors in the Lower Rio Grande Valley have taken different approaches whencompared to the water bottle industries. Advertisement is a key component that brings inprofit to many bottled water companies. While this may be true for bottled wateradvertisement, water vendors in the Lower Rio Grande Valley tend to place their businessaround areas where consumers have easy access to and can be seen from all directions, as
13seen on figure 1. Demographically, water vendors in the LRGV seem to target low-incomepopulations, not the wealthy. Compared to these water vendors, bottled water industriestarget historically wealthy, health conscious populations, focusing on different age groupsand other subjects relating to its bottled water.This research project fills a gap in current understanding of the economics of bottled waterindustry because we focus our attention to the rise of purified water among low incomecommunities. We will analyze location data of water vending units in a GeographicInformation System to explore the reason behind why water-vending companies place theirunits in certain areas. We want to establish the hypothesis that low-income and ancillarydemographic data (access to transportation, education) are predictors of water-vendinglocation. Our main focus will center on distribution with the four water companies thatoperate in their region. It is important to have a firm understanding on how business, suchas Watermill Express and Avant, profit from their privatization of water as the Lower RioGrande Valley struggles with low water quality in their homes. The next chapter willreview in detail the methods that we will employ to describe the process of watercommodification through the purified water industry in south Texas.
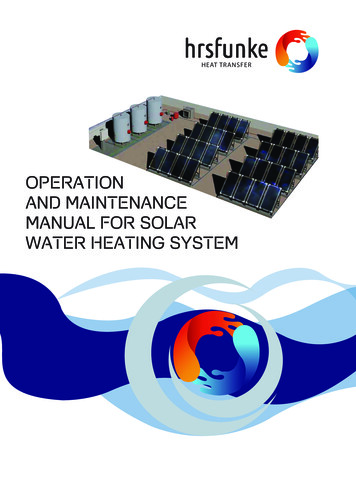
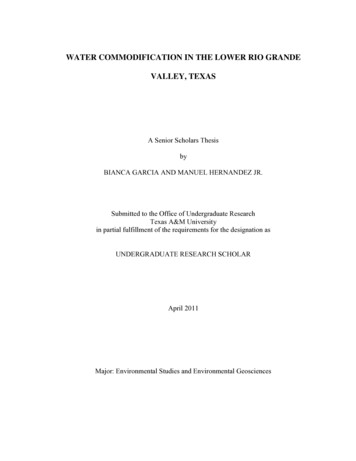
14CHAPTER IIMETHODSOur main research objective centers on the idea of the commodification of water rely on therapid expansion of water vendors near low-income areas in South Texas. Through ourexploration of this swift development and its direct link towards households, we will beable to explain the fundamental idea behind corporation’s tactics and perceived thoughtspopulations have concerning ―safe and clean‖ drinking water. This chapter outlines themain study area, the Lower Rio Grande Valley, more specifically, the peri-urbancommunities, known as colonias. Following that, we will discuss the different methodsused to carry out our hypothesis.Study regionThe study region is the Lower Rio Grande Valley (LRGV), specifically Hidalgo County,located in the extreme Southern tip of Texas, which lies just on the Northern Bank of theRio Grande River. The region is made up of four counties: Hidalgo County, CameronCounty, Starr County, and Willacy County. The LRGV spreads over approximately 4900sq. miles, and has an estimated population of just over 1.17 million people (2009 est.)Hidalgo County is the largest and most populous of the 4 counties, with approximately700,000 people living in the county. Brownsville, McAllen, and Harlingen are the largestand most important cities in the area.
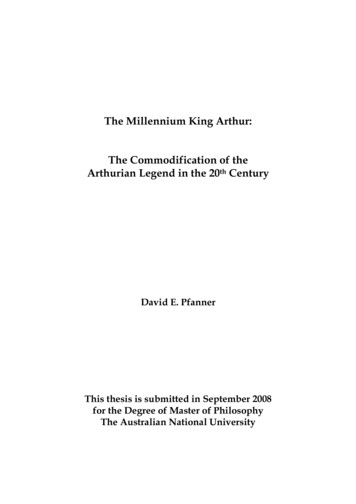
15Figure 2: Map of tx.htmFigure 3: Google Earth image of Hidalgo County
16Hidalgo County is one of the fastest growing counties in the nation, with this increaseaiding in the development of more colonias to the area. Just west of Hidalgo County liesStarr County, as seen in Figure 2, which is one of the poorest counties in the nation, with aper-capita income of less than 10,000, with the entire LRGV as whole only having anaverage per-capita income of just over 13,000. Figure 3 displays the Google Earth imageof Hidalgo County, TX.Table 1: U.
The Lower Rio-Grande Valley (LRGV) is an area located in south Texas, along the border of the United States and Mexico. In the residential areas in the LRGV, colonias, have faced problems associated with water, which includes water quality and access (Haynes, 1977). The quality of water in the LRGV is affected primarily by pollution. The pollution